Abstract
Protein phosphatase 2A (PP2A) is a large enzyme family responsible for most cellular Ser/Thr dephosphorylation events. PP2A substrate specificity, localization, and regulation by second messengers rely on more than a dozen regulatory subunits (including B/R2, B′/R5, and B″/R3), which form the PP2A heterotrimeric holoenzyme by associating with a dimer comprising scaffolding (A) and catalytic (C) subunits. Because of partial redundancy and high endogenous expression of PP2A holoenzymes, traditional approaches of overexpressing, knocking down, or knocking out PP2A regulatory subunits have yielded only limited insights into their biological roles and substrates. To this end, here we sought to reduce the complexity of cellular PP2A holoenzymes. We used tetracycline-inducible expression of pairs of scaffolding and regulatory subunits with complementary charge-reversal substitutions in their interaction interfaces. For each of the three regulatory subunit families, we engineered A/B charge–swap variants that could bind to one another, but not to endogenous A and B subunits. Because endogenous Aα was targeted by a co-induced shRNA, endogenous B subunits were rapidly degraded, resulting in expression of predominantly a single PP2A heterotrimer composed of the A/B charge–swap pair and the endogenous catalytic subunit. Using B′δ/PPP2R5D, we show that PP2A complexity reduction, but not PP2A overexpression, reveals a role of this holoenzyme in suppression of extracellular signal–regulated kinase signaling and protein kinase A substrate dephosphorylation. When combined with global phosphoproteomics, the PP2A/B′δ reduction approach identified consensus dephosphorylation motifs in its substrates and suggested that residues surrounding the phosphorylation site play roles in PP2A substrate specificity.
Keywords: protein phosphatase 2 (PP2A), mass spectrometry (MS), signal transduction, protein phosphatase, protein phosphorylation, protein kinase A (PKA), substrate specificity, protein complex, protein serine/threonine phosphatase (PSP), post-translational modification, consensus dephosphorylation motif, quantitative phosphoproteomics, RNA interference, salt bridge
Introduction
Reversible protein phosphorylation is a ubiquitous post-translational modification that allows cells and organisms to rapidly adapt to environmental changes. Ser and Thr residues are by far the most commonly phosphorylated amino acids (>99%), and most, if not all, proteins are thought to be phosphorylated on Ser/Thr at least during part of their life cycle. The >500 Ser/Thr kinases of the mammalian kinome are opposed by a much smaller number of protein Ser/Thr phosphatase (PSP)2 catalytic subunits, which has led to the historic misconception of the latter as constitutively-active enzymes that will target any phosphoprotein. However, with the discovery of hundreds of PSP-interacting or -regulatory subunits, it is now believed that PSP activity and substrate specificity is as finely regulated as the enzymes whose action they oppose (1–3). However, the existence of PSPs as multisubunit complexes has made their characterization challenging, as it can be difficult to interpret the effects of overexpressing or knocking out or down a single subunit within the PSP complex.
In the case of PP2A, which together with PP1 contributes >90% of the PSP activity in most cell types, the canonical holoenzyme is a trimer of scaffolding (A), catalytic (C), and regulatory (B) subunits. In mammals, PP2A regulatory subunits are encoded by three gene families (B/PPP2R2, B′/PPP2R5, and B″/PPP2R3) with four, five, and three members, respectively, many of which are further diversified by alternative splicing. Although atomic structures of representative members of each of the three PP2A heterotrimer families are available (4), we do not know the extent to which their substrates overlap. The degree of functional redundancy within each PP2A regulatory subunit family is also largely unknown.
We report here on a strategy that allows interrogation of cellular functions, substrates, and consensus dephosphorylation motifs of individual PP2A holoenzymes. Implemented here by stable transfection of human HEK293 cells with a multicistronic plasmid, PP2A complexity reduction uncovered properties conferred by the B′δ regulatory subunits that remained hidden when the regulatory subunit was simply overexpressed.
Results
Identification of complementary charge-reversal mutations in Aα and B regulatory subunits
The principle of PP2A complexity reduction is illustrated in Fig. 1. The strategy aims to replace the endogenous PP2A holoenzyme pool with a single holoenzyme of interest, taking advantage of rapid proteasomal degradation of endogenous regulatory subunits after RNAi-mediated silencing of the scaffolding A subunit (5, 6). This approach requires charge–swap versions of A and B subunits capable of interacting with one another, but not the wildtype (WT) proteins. We first identified potential salt-bridge contacts between Aα and B subunits in available crystal structures of PP2A heterotrimers containing Bα, B′γ, and B″β (Fig. 1A). Allowing for some flexibility of the PP2A holoenzyme (7), we also considered interfacing pairs of oppositely charged residues that were further apart than the minimal distance required for salt bridge formation (4 Å). All regulatory subunit residues that were considered are conserved within each gene family. Site-directed mutagenesis was performed to generate the charge–swap mutations listed in Table 1 in the context of Bα, B′δ, and B″α regulatory subunits with C-terminal FLAG and GFP tags and Aα subunits with a C-terminal polyoma (EE) epitope tag. We then immunoprecipitated WT and mutant Aα-EE from transiently transfected COS-1 cells and tested for association of endogenous and coexpressed B subunits. Those Aα-EE mutations capable of reducing WT regulatory subunit coimmunoprecipitation by ≥70% (8 out of 10, see Table 1) were then tested by coexpression with the complementary B subunit charge–swap mutant for restored PP2A holoenzyme formation. Five out of 10 charge–swap pairs thus emerged as candidates for PP2A complexity reduction (Fig. 1A and Table 1) as detailed below.
Figure 1.
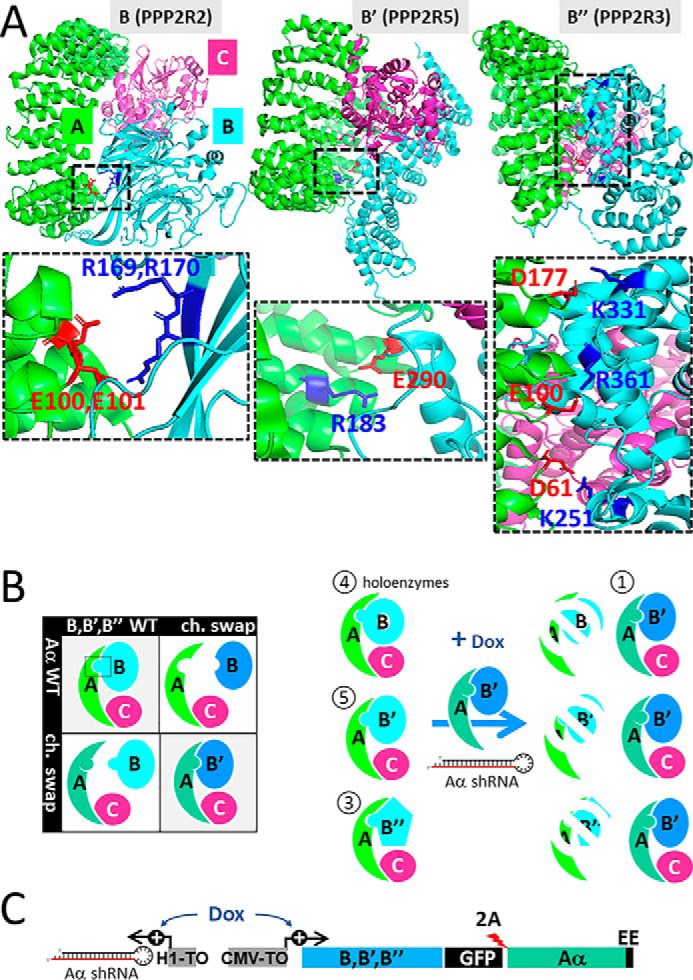
Principle of PP2A complexity reduction. A, ribbon diagrams showing heterotrimeric holoenzyme PP2A complexes containing the scaffold (Aα) subunit (green), catalytic (Cα) subunit (pink), and regulatory (Bα, B′γ, and B″β) subunits (turquoise). The zoomed-in panels highlight interacting residues in A (red) and B regulatory (blue) subunits that maintain interactions when swapped. The residue numbers apply to the regulatory subunit family members characterized in this report, Bα, B′δ, and B″α. B, left, PP2A complexity reduction involves complementary charge–swap mutations in Aα and B subunits. B, right, inducible PP2A reduction utilizes Dox-dependent expression of an A/B charge–swap pair together with shRNA-mediated knockdown of endogenous Aα to replace the endogenous PP2A holoenzyme pool (with 4, 5, and 3 regulatory subunits per family) with one defined PP2A holoenzyme. C, schematic of the inducible PP2A reduction vector (see text for details).
Table 1.
Summary of Aα/B charge–swap mutations tested for complementation
Mutations with a check mark (✓) disrupt binding to the wildtype binding partner. A check mark in the complementation (Compl.) column indicates that mutant subunits interact with one another and that mutant Aα does not interact with the wildtype B regulatory subunit, which are the two prerequisites for PP2A complexity reduction. Note Aα R183E impairs endogenous B′δ association, although overexpressed B′δ still binds (Fig. 3).
| Aα mutation | B mutation | Compl. |
|---|---|---|
| D57K✓ | Bα K129D | |
| E50R | Bα R153E | |
| E50R,D57K✓ | Bα K129D,R153E✓ | |
| EE100RR✓ | Bα RR169EE✓ | ✓ |
| D218R✓ | Bα R257D✓ | |
| R183E✓ | B′δ E290R✓ | ✓ |
| D61K✓ | B″α K251D✓ | ✓ |
| D177K | B″α K331D | |
| D61K,D177K✓ | B″α K251D,K331D✓ | ✓ |
| E100R✓ | B″α R361E✓ | ✓ |
B/R2 family: Bα RR169EE–Aα EE100RR
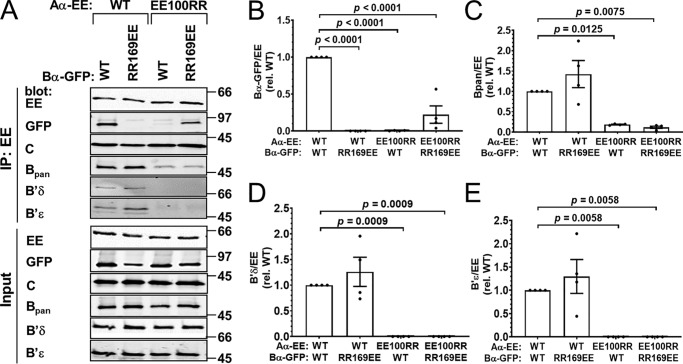
For the PPP2R2 or B family, we tested five charge-swaps in the Bα and Aα subunit interface for complementation and succeeded with one pair, Bα RR169EE + Aα EE100RR (Table 1 and Fig. 1A). Previously and prior to the availability of the PP2A/Bα holoenzyme crystal structure, we had used this very charge-reversal to identify interacting residues in the PP2A/Bγ holoenzyme (8).
We found that pairing of Bα RR169EE with Aα EE100RR subunits resulted in 22% coimmunoprecipitation in cotransfected COS-1 cells compared with WT subunits (Fig. 2, A and B). Pairing neither mutant with its WT counterpart resulted in detectable interactions, indicating that electrostatic interactions between these groups of residues are critical for assembly of the PP2A/R2 holoenzyme. Blotting the same Aα-EE immunoprecipitates for endogenous B (pan-specific antibody recognizing all B but not B′ or B″ subunits), B′δ, and B′ϵ subunits (specific antibodies) confirmed that Aα Glu-100 and Glu-101 are required for PP2A heterotrimer assembly in general (Fig. 2, A and C–E) (8, 9). In this set and in all later experiments, we observed no effect of Aα mutations on catalytic (C) subunit association. This is consistent with biochemical and structural evidence indicating no overlap between B and C subunit interfaces on the A subunit (4).
Figure 2.
Complementation between Bα RR169EE and Aα EE100RR. GFP-tagged Bα wildtype (WT) or RR169EE was coexpressed with EE-tagged Aα WT or EE100RR in COS-1 cells in the indicated combinations at 1:1 plasmid ratios, and PP2A holoenzyme formation was assessed by Aα immunoprecipitation (IP) via the EE epitope tag and immunoblotting for the indicated PP2A subunits. A, Western blottings representative of four independent experiments. Molecular mass marker positions are indicated on the right in kDa. B–E, quantification of transfected Bα-GFP (B), endogenous B (pan-specific antibody, C), endogenous B′δ (D), and B′ϵ (E) in the immunoprecipitate. Signals are normalized to immunoprecipitated Aα-EE levels in the same lane and further normalized to the WT/WT condition. Shown are means ± S.E. as well as individual data points from four independent experiments. Significance levels are indicated as p values obtained by one-way ANOVA followed by Dunnett's post hoc test.
B′/R5 family: B′δ E290R–Aα R183E
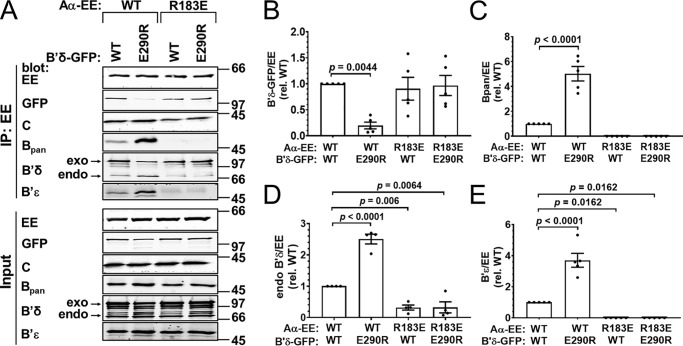
For the B′ or PPP2R5 family, we tested complementation between B′δ E290R and Aα R183E, achieving coimmunoprecipitation efficiency comparable with WT subunits (Fig. 3, A and B). Although Aα WT precipitated little B′δ E290R, we were surprised to find robust interactions between mutant Aα and cotransfected WT B′δ (Fig. 3, A and B). Whereas no endogenous B (pan) and B′ϵ subunits could be detected in Aα R183E immunoprecipitates, endogenous B′δ was detectable at ∼30% of WT Aα levels (Fig. 3, A and C–E). Finally, we observed that WT Aα bound to 2.5–5-fold higher levels of endogenous B and B′ regulatory subunits when coexpressed with interface-mutant B′δ E290R, compared with WT B′δ. Similar effects on endogenous regulatory subunit coimmunoprecipitation with WT Aα were observed when interaction-competent versus -incompetent B″α mutants were coexpressed (Figs. 4, C–E, and 6, C–E). This presumably reflects competition between transfected and endogenous B subunits for limiting levels of Aα.
Figure 3.
Complementation between B′δ E290R and Aα R183E. GFP-tagged B′δ wildtype (WT) or E290R was coexpressed with EE-tagged Aα WT or R183E in COS-1 cells in the indicated combinations at 1:1 plasmid ratios, and PP2A holoenzyme formation was assessed by Aα immunoprecipitation (IP) via the EE epitope tag and immunoblotting for the indicated PP2A subunits. A, Western blottings representative of five independent transfections. Molecular mass marker positions are indicated on the right in kDa. B–E, quantification of transfected B′δ-GFP (B), endogenous pan-B (C), B′δ (D), and B′ϵ (E) in the immunoprecipitate. Signals are normalized to immunoprecipitated Aα-EE levels in the same lane and further normalized to the WT/WT condition. Shown are means ± S.E. as well as individual data points from five independent experiments. Significance levels are indicated as p values determined by one-way ANOVA followed by Dunnett's post hoc test.
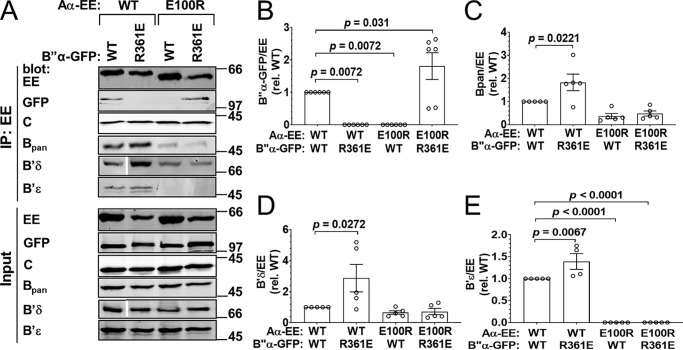
Figure 4.
Complementation between B″α R361E and Aα E100R. GFP-tagged B″α wildtype (WT) or R361E was coexpressed with EE-tagged Aα WT or E100R at 3:1 plasmid ratios, and PP2A holoenzyme formation was assessed by Aα immunoprecipitation (IP) via the EE epitope tag and immunoblotting for the indicated PP2A subunits. A, Western blottings representative of six independent transfections. Positions of molecular mass markers (in kDa) are indicated on the right. In the B′δ blots, the white line indicates the removal of the irrelevant lanes of the same blots. B–E, quantification of transfected B″α-GFP (B), endogenous pan-B (C), B′δ (D), and B′ϵ (E) in the immunoprecipitate. Signals are normalized to immunoprecipitated Aα-EE levels in the same lane and further normalized to the WT/WT condition. Shown are means ± S.E. as well as individual data points from six independent experiments. Significance levels are indicated as p values determined by one-way ANOVA followed by Dunnett's post hoc test.
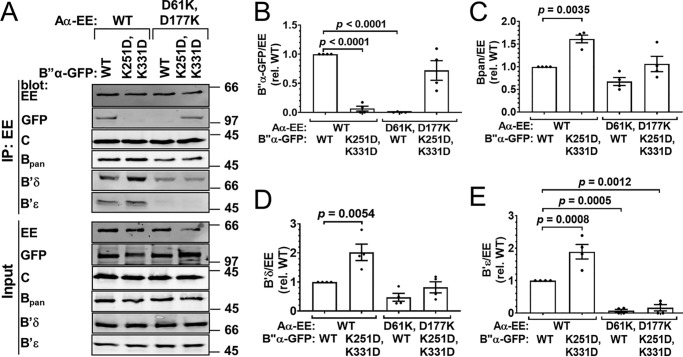
Figure 6.
Complementation between B″ K251D,K331D and Aα D61K,D177K. Wildtype (WT) or mutant B″α-GFP was coexpressed with WT or mutant Aα-EE at 3:1 plasmid ratios, and PP2A holoenzyme assembly was assessed by Aα-EE immunoprecipitation (IP) and immunoblotting for the indicated PP2A subunits. A, Western blottings representative of four independent transfections. Positions of molecular mass markers (in kDa) are indicated on the right. B–E, quantification of transfected B″α-GFP (B), endogenous pan-B (C), B′δ (D), and B′ϵ (E) in the immunoprecipitate. Signals are normalized to immunoprecipitated Aα-EE levels in the same lane and to the WT/WT condition (means ± S.E. and individual data points from four transfections). Significance levels are indicated as p values determined by one-way ANOVA followed by Dunnett's post hoc test.
B″/R3 family: B″α R361E–Aα E100R
For the PPP2R3 or B″ family, we tested four sets of charge–swap mutations in Aα and B″α, of which three had the desired effect of complementing each other while impairing WT interactions (Table 1 and Fig. 1A). In the case of B″α R361E and Aα E100R, either mutation alone disrupted the holoenzyme formed by the cotransfected subunits, whereas combining mutant subunits restored interactions to WT levels (Fig. 4, A and B). The extent to which endogenous regulatory subunits interacted with Aα E100R was variable, however. Whereas endogenous B′ϵ was undetectable, and endogenous B (pan antibody) binding was reduced by ∼60%, Aα E100R caused no significant reduction of endogenous B′δ binding (Fig. 4, A and C–E).
B″/R3 family: B″α K251D–Aα D61K and B″α K251D,K331D– Aα D61K,D177K
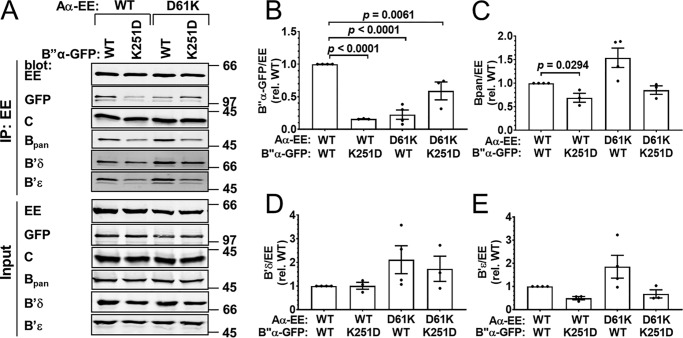
The second pair of complementary charge–swap mutations in B″α and Aα subunits is B″α K251D and Aα D61K. With these mutations, we observed incomplete disruption of WT/mutant interactions (to 10–20% of WT/WT) and incomplete complementation of mutant/mutant interaction (60% of WT/WT, Fig. 5, A and B). Interactions of Aα D61K with endogenous B and B′ subunits were largely maintained (Fig. 5, A and C–E). Assuming that this mutation inhibits binding of endogenous B″ to the same extent as overexpressed B″α (not testable because suitable antibodies are currently lacking), this particular charge-swap could prove useful for isolating the effects of a specific PP2A/B″ holoenzyme without perturbing the cellular pool of PP2A/B and PP2A/B′ holoenzymes.
Figure 5.
Complementation between B″α K251D and Aα D61K. Wildtype (WT) or mutant B″α-GFP was coexpressed with WT or mutant Aα-EE at 3:1 plasmid ratios, and PP2A holoenzyme assembly was assessed by Aα-EE immunoprecipitation (IP) and immunoblotting for the indicated PP2A subunits. A, Western blottings representative of four independent transfections. Positions of molecular mass markers (in kDa) are indicated on the right. B–E, quantification of transfected B″α-GFP (B), endogenous pan-B (C), B′δ (D), and B′ϵ (E) in the immunoprecipitate. Signals are normalized to immunoprecipitated Aα-EE levels in the same lane and to the WT/WT condition (means ± S.E. and individual data points from four transfections). Significance levels are indicated as p values determined by one-way ANOVA followed by Dunnett's post hoc test.
We swapped an additional salt bridge in the Aα/B″α subunit interface to increase discrimination of WT subunits. By itself, the Aα D177K mutation had no effect (Table 1); however, the Aα D61K,D177K double mutant completely disrupted the WT B″α subunit's coimmunoprecipitation. Double-mutant Aα incorporation into the PP2A/B″α holoenzyme was restored by the complementary double mutation in B″α (K251D,K331D), and the double mutant B″α did not associate with WT Aα (Fig. 6, A and B). Therefore, this double charge-swap confers about the same degree of WT/mutant discrimination to Aα and B″α subunits as the E100R and R361E single charge-swap (Fig. 4, A and B). Profiles of endogenous B′ subunit binding to Aα E100R and Aα D61K,D177K were similar, with both single and double mutations disrupting B′ϵ, while largely maintaining B′δ association (compare Fig. 4, D and E, with Fig. 6, D and E). In contrast, Aα D61K,D177K did not affect endogenous B (pan antibody) binding, whereas the E100R mutation reduced it by ∼60% (compare Figs. 6C and 4C).
Effects of stable, inducible PP2A complexity reduction versus overexpression on endogenous PP2A subunits
The purpose of the PP2A reduction approach is to reduce the complexity of the cellular PP2A holoenzyme pool, such that cellular functions and substrates of individual PP2A holoenzymes can be studied in quasi isolation (Fig. 1B). To this end, we devised a single multicistronic plasmid that allows for concomitant expression of the charge–swap mutant Aα and B regulatory subunit and knockdown of endogenous Aα by shRNA (Fig. 1C). Because Aβ protein is expressed at very low levels in HEK293 and other cell lines, Aα-directed shRNAs can deplete total A-subunit levels by 80–90% (6). Charge–swap mutant Aα was rendered RNAi-resistant, carries a C-terminal EE tag, and is expressed from the same mRNA as the complementary B subunit mutant (with C-terminal FLAG and GFP tags). For equal stoichiometry, a ribosome-skipping 2A peptide separates the A and B subunit polypeptides. Both the cytomegalovirus promoter driving expression of A/B subunits and the H1 promoter driving expression of the Aα shRNA include a TetO palindrome providing tetracycline/doxycycline (Dox)-mediated induction via the tetracycline repressor (TetR, T-Rex System, Takara/Clontech) (Fig. 1C).
Starting with HEK293–TRex cells stably expressing TetR (Takara/Clontech), we generated clonal cell lines for inducible PP2A overexpression with complexity reduction (RE) to holoenzymes containing Aα R183E and B′δ E290R. For comparison, we generated cell lines with Dox-inducible overexpression only (OE) of B′δ–FLAG–GFP and analyzed several independent clones of each in parallel.
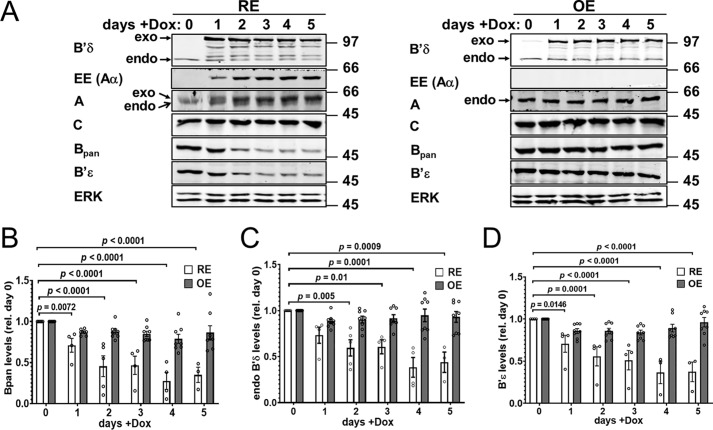
As shown in Fig. 7A, Dox induces B′δ–GFP expression to similar levels (2–3-fold over endogenous) and with a similar time course in RE and OE cells. Despite endogenous Aα knockdown, induction of Aα-EE in RE cells increases total A-subunit levels. In contrast, A-subunit levels remain constant after induction of B′δ OE cells. Dox treatment did not alter C-subunit levels in either RE or OE cells. Significantly, endogenous B, B′δ, and B′ϵ levels are also unchanged following B′δ OE, suggesting that endogenous regulatory subunits remain holoenzyme-associated and that significant levels of B′δ-GFP may be monomeric when overexpressed. In marked contrast, B′δ–GFP RE decreased endogenous B, B′δ, and B′ϵ protein levels to ∼30% within 3–5 days of Dox treatment (Fig. 7, B–D). Thus, PP2A reduction uniquely destabilizes endogenous regulatory subunits, likely as a combined effect of silencing endogenous Aα and of sequestering the endogenous C subunit.
Figure 7.
Comparison of PP2A subunit expression in inducible PP2A/B′δ RE versus OE cell lines. Clonal HEK293 cell lines with either inducible PP2A/B′δ RE (Aα R183E-B′δ E290R) or OE were treated for the indicated number of days with Dox before immunoblotting total lysates for the indicated proteins. A, Western blottings from one representative experiment. Positions of molecular mass markers (in kDa) are indicated on the right. B–D, quantification of endogenous B (pan-specific antibody, B), B′δ (C), and B′ϵ levels (D) normalized to ERK and day 0. Data shown are means ± S.E. of four (RE) and eight (OE) clonal cell lines. Individual symbols are means of two to three replicate analyses of each cell clone. Listed p values are based on one-way ANOVA followed by Dunnett's post hoc test.
B′δ inhibits ERK signaling and dephosphorylates PKA substrates following cAMP mobilization, as revealed by RE but not OE
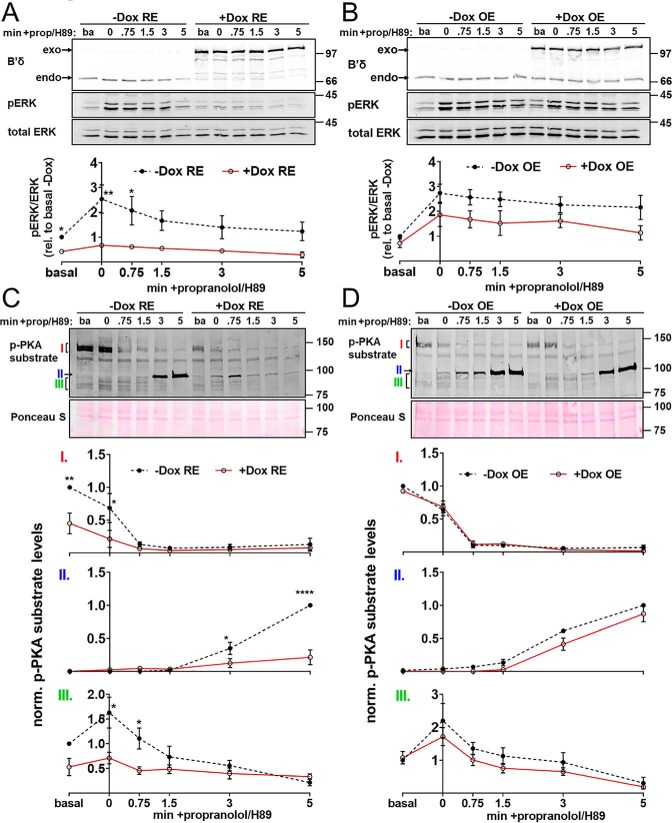
We next evaluated PP2A/B′δ reduction as a strategy to identify signaling functions and potential substrates of the phosphatase. Previous work indicated that PP2A/B′δ phosphatase activity is positively regulated by protein kinase A (PKA)-mediated phosphorylation of a residue in the C terminus of B′δ (Ser-573 (10, 11)). To favor PP2A/B′δ-mediated dephosphorylation events, we treated serum-starved, inducible RE and OE cells briefly (5 min) with the β-adrenergic receptor agonist isoproterenol to elevate cAMP. Adrenergic signaling was terminated by combined addition of the β-adrenergic antagonist propranolol and the PKA inhibitor H89 at a concentration that likely targets other kinases as well (50 μm). SDS cell extracts prepared before isoproterenol treatment and at 0 to 5 min post-propranolol/H89 were then immunoblotted with phospho-specific antibodies to track apparent dephosphorylation events. β-Adrenergic stimulation of uninduced (−Dox) RE and OE cell lines resulted in a similar 2–3-fold increase in ERK1/2 phosphorylation that slowly decayed over 5 min in propranolol/H89 (Fig. 8, A and B). Inducible PP2A/B′δ OE appeared to attenuate ERK1/2 phosphorylation, but trends did not reach statistical significance at any time point. Inducible PP2A/B′δ RE, in contrast, obliterated ERK1/2 phosphorylation before and after β-adrenergic stimulation (Fig. 8, A and B), suggesting that RE is more sensitive than OE and that PP2A/B′δ is a potent negative regulator of ERK1/2 signaling. It has been reported that PP2A/B′ enzymes can dephosphorylate ERK1/2 directly (12). To explore this possibility in our model system, we assessed phosphorylation of MEK, the kinase immediately upstream of ERK1/2 in the mitogen-activated protein kinase cascade. Isoproterenol-induced MEK1/2 phosphorylation and propranolol/H89-induced dephosphorylation remained unaffected by PP2A/B′δ RE and OE (Fig. S1), suggesting that this PP2A holoenzyme targets ERK1/2 directly.
Figure 8.
PP2A complexity reduction, but not overexpression, detects B′δ-mediated dephosphorylation events. PP2A/B′δ RE and OE cell lines were treated ± doxycycline for 3 days, serum-starved for 4–6 h, and then stimulated with isoproterenol (1 μm, 5 min). β-Adrenergic signaling was terminated by subsequent incubation with propranolol (prop, 10 μm) and H89 (50 μm) for 0–5 min, after which SDS lysates were prepared and analyzed by immunoblotting for the indicated total and phospho (p)-proteins. The top of each panel shows representative blots. Positions of molecular mass markers (in kDa) are indicated on the right. The graphs at the bottom of each panel depict densitometry as means ± S.E. of three clonal cell lines. A and B, pERK to total ERK ratios were normalized to the basal (ba), no Dox condition. C and D, p-PKA substrate signals were first normalized to total protein (Ponceau S stain). Signals of bands labeled I and III were then normalized to the basal, no Dox condition, whereas band II signals were normalized to the no Dox, 5-min time point. Error bars smaller than symbols are not shown. Asterisks denote significant differences between +Dox and −Dox groups based on two-way ANOVA analysis followed by Sidak's multiple comparison post hoc test. *, p < 0.05; **, p < 0.01; and ****, p < 0.0001.
Because PKA is reported to activate PP2A/B′δ, we also examined protein phosphorylation in the same extracts with a commercial antibody that recognizes phosphorylated PKA motifs (R(RK)X(ST)). Of note, this motif is shared with many other Arg-directed kinases. Isoproterenol treatment followed by propranolol/H89 chase resulted in a complex pattern of PKA substrate phosphorylation that was similar in uninduced (−Dox) B′δ RE versus OE cells. Dox-induced B′δ OE had no effect on phosphorylation levels of three bands detected by the phospho-PKA substrate antibody that changed in response to the β-adrenergic stimulation/inhibition regimen (labeled I–III in Fig. 8D). In contrast, Dox-induced B′δ RE resulted in significant dephosphorylation of all three bands compared with the uninduced state (Fig. 8C). As a side note, only the group of proteins labeled “III” respond to the transient isoproterenol treatment as expected for a direct PKA substrate. Taken together, these results indicate that PP2A complexity reduction is uniquely suited to identify phosphatase substrates.
PP2A complexity reduction identifies B′δ dephosphorylation motif in the global phosphoproteome
Emerging evidence indicates that PSPs, including PP2A, rely on short docking motifs in their substrates for recognition and dephosphorylation. Also referred to as short-linear interaction motifs (SLIMs), these degenerate hydrophobic motifs are often distant from targeted phospho-Ser/Thr residues (13–15). We hypothesized that residues adjacent to sites targeted for dephosphorylation may also play a role in directing PP2A substrate selectivity (16). To identify such consensus dephosphorylation motifs in an unbiased fashion, we interrogated the global phosphoproteome in inducible RE and OE cell lines. Three clonal cell lines were mixed prior to analysis to minimize potential selection artifacts. To again favor activity of the PP2A/B′δ holoenzyme (10, 11), serum-starved naïve and Dox-induced cells were challenged with isoproterenol for 5 min to activate PKA. Cells were flash-frozen, and urea extracts were subjected to tryptic digestion. Peptides were labeled with tandem mass tag (TMT) isobaric mass tags and enriched for phosphopeptides using Ti-IMAC beads before quantitative analysis by LC-MS/MS. Isoproterenol treatment led to the expected enrichment of peptides with Arg and Lys residues N-terminal to the phosphorylation sites (consensus motif in Fig. S2A) that are predicted to be targets of basophilic kinases, such as PKA (Fig. S2B and supporting Excel File S2). Isoproterenol also stimulated phosphorylation of the PKA site in B′δ, Ser-573 (3.96-fold in RE and 3.98-fold in OE cell lines, see supporting Excel File S1).
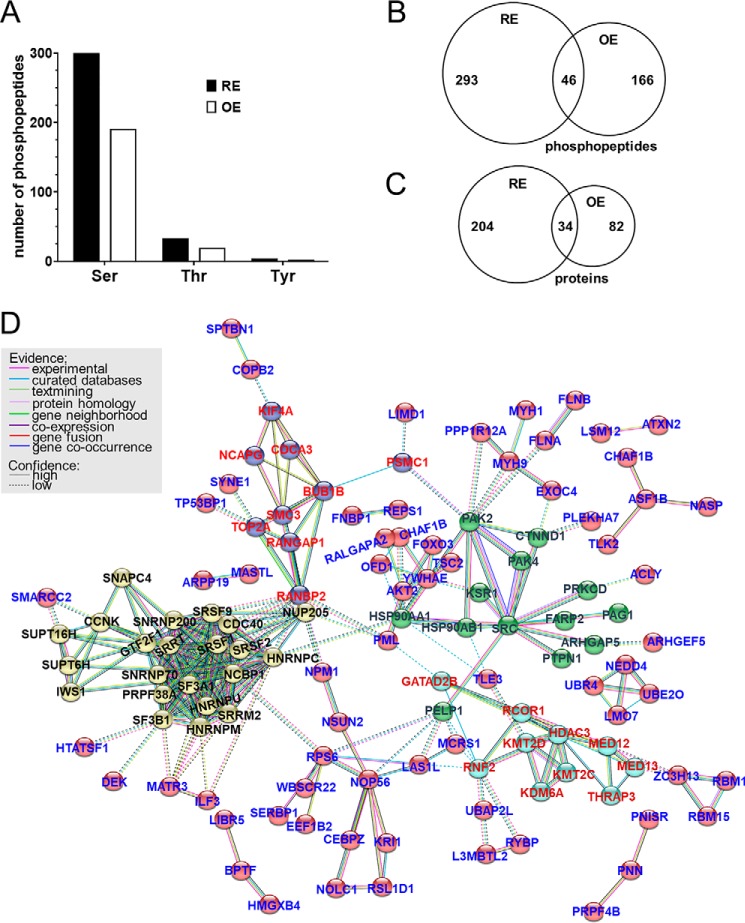
We identified 8235 phosphopeptides in 3786 proteins after isoproterenol stimulation (supporting Excel File S1). Normalization of phosphopeptide to protein abundance resulted in 5254 normalized phosphopeptides. To identify Dox-induced changes in the phosphoproteome, we determined a Dox-induced to naïve (−Dox) ratio. Phosphopeptides more than 1.5-fold depleted by Dox treatment (abundance ratio <0.67) were considered as potential PP2A/B′δ substrates. We thus identified 339 and 212 dephosphorylated peptides in isoproterenol-treated RE and OE cell lines, respectively (Fig. 9A). Of these, 46 peptides were dephosphorylated by both PP2A/B′δ RE and OE (Fig. 9B and supporting Excel File S2). Phosphopeptides were derived from 238 (RE) and 116 (OE) proteins, with 34 potential substrate proteins identified in both cell lines (Fig. 9C and supporting Excel File S2). The limited overlap between substrates identified by RE and OE approaches deserves comment. It has recently been reported that B′δ can associate with the Ser/Thr phosphatase PPM1G (PP2Cγ) (17). It is therefore possible that peptides/substrates selectively depleted by B′δ overexpression, when endogenous B subunits can effectively compete for PP2A holoenzyme formation, are instead dephosphorylated by a PP2Cγ/B′δ complex.
Figure 9.
PP2A complexity reduction identifies putative B′δ substrates in the global phosphoproteome. Three clonal PP2A/B′δ RE and OE cell lines were pooled and treated ± Dox for 3 days, serum-starved for 4–6 h, and then stimulated with isoproterenol (1 μm, 5 min). Urea lysates were digested with trypsin, TMT-labeled, phospho-enriched, and subjected to quantitative LC-MS/MS analysis. After normalization to protein abundance, phosphorylation changes were calculated as the ratio of +Dox to −Dox phosphopeptide levels. A, numbers of phospho-Ser, phospho-Thr, and phospho-Tyr–containing peptides that were at least 1.5-fold depleted by PP2A/B′δ RE and OE. B and C, Venn diagrams illustrating numbers of phosphopeptides (B) and proteins (C) that were either uniquely depleted by RE and OE (numbers to the left and right) or depleted by both RE and OE (numbers in the intersections, see also supporting Excel File S2). Proteins were counted as potential substrates if at least one phosphopeptide was depleted ≥1.5-fold. Because some proteins were identified as phosphopeptides only (not in the total peptide pool), phosphopeptide ratios were calculated without normalization to total protein for C only. D, STRING network analysis (18) shows four major subnetworks and potential protein–protein interactions among the 238 potential PP2A/B′δ RE substrates. Node colors represent different subnetworks based on k means clustering of 5. Substrates that are not connected within the network are not shown.
Functional gene clustering of the 238 PP2A/B′δ RE substrate proteins by STRING (18) revealed four major clusters (Fig. 9D). Proteins within all four clusters have previously been linked to PP2A. Specifically, PP2A is associated with the spliceosomal complex (yellow spheres in Fig. 9D) (19, 20), kinetochore complex (blue) (21–23), cell–cell adhesion complexes (green) (24–27), and epigenetic regulation (cyan) (28–31). In contrast, grouping of the 116 PP2A/B′δ OE substrates (data not shown) revealed only a subset of two clusters (spliceosome and kinetochore complex), which are composed of proteins within the overlap of the Venn diagram in Fig. 9C. No clusters were detected among the 82 substrates identified only by PP2A/B′δ OE.
Using the PANTHER classification system (32, 33), we further analyzed the PP2A/B′δ RE substrates for gene ontology, protein class, and pathway (Fig. S3 and supporting Excel File S2). This analysis revealed parallels to functional gene clustering. For instance, 30% of substrates belong to the largest “nucleotide-binding” class, which contribute to the largest gene cluster, the spliceosomal complex (Fig. 9D).
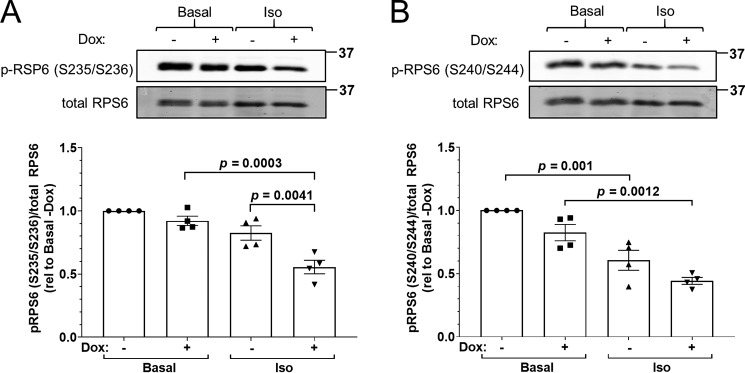
For validation as a PP2A/B′δ target, we selected ribosomal protein S6 (RPS6), which was detected by both RE and OE as several depleted phosphopeptides. Phosphorylation of clusters of C-terminal Ser residues in RPS6 is a widely used marker for enhanced protein synthesis and cell growth downstream of the phosphatidylinositol 3-kinase/Akt/mechanistic target of rapamycin kinase cascade (34). RPS6 phosphorylation was assessed with antibodies specific for phospho-Ser-235/236 (Fig. 10A) and phospho-Ser-240/244 (Fig. 10B). Both PP2A/B′δ RE (+Dox) and isoproterenol treatment promoted dephosphorylation of RPS6 at the two sets of Ser residues. Effects were additive, with cAMP mobilization in PP2A/B′δ RE-expressing cells resulting in 50–60% dephosphorylation of RPS6 (Fig. 10, A and B).
Figure 10.
RPS6 is a putative substrate of PKA-activated PP2A/B′δ. P2A/B′δ RE cells were treated ± Dox for 3 days, serum-starved for 4–6 h, and then stimulated ± isoproterenol (1 μm, 5 min). SDS lysates were analyzed by PAGE and immunoblotting for total and phospho (p)-ribosomal protein S6 (RPS6; A, pSer-235/236; B, pSer-240/244). The top of each panel shows representative blots with molecular mass markers (in kDa) indicated on the right. The graphs at the bottom of each panel depict pRPS6 to total RPS6 ratios of four clonal cells lines normalized to the basal/−Dox condition as individual data points and as means ± S.E. p values were obtained by one-way ANOVA with Tukey's post hoc test.
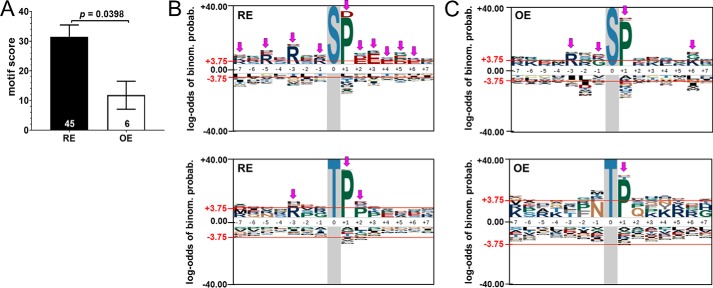
To uncover consensus dephosphorylation motifs, ≥1.5-fold depleted 15-mer peptides with centered phospho-Ser/Thr residues were analyzed for motif enrichment using the pLogo web tool, which assesses the statistical significance of motifs relative to a species-specific background (35). This analysis identified 45 motifs after PP2A/B′δ RE versus only six motifs after PP2A/B′δ OE (supporting Excel File S2), with the latter displaying significantly higher degeneracy (lower motif scores, Fig. 11A). Fig. 11, B and C, shows sequence logos for RE and OE, respectively, separating phospho-Ser- (top panels) and phospho-Thr–containing motifs (bottom panels) for clarity. Common to most motifs is a Pro at the +1 position, consistent with previous evidence that PP2A/B′ holoenzymes dephosphorylate substrates of mitotic, proline-directed kinases (36, 37). PP2A/B′δ RE revealed phospho-Ser motifs with N-terminal Arg and C-terminal Glu or Asp residues, with enrichments at 11 of 14 positions reaching significance (denoted by pink arrows, Fig. 11B, top). PP2A/B′δ OE, however, yielded significant enrichments at 4 of 14 positions only (Fig. 11C, top). Similarly, PP2A/B′δ RE yielded phospho-Thr–containing motifs of higher definition than PP2A/B′δ OE (Fig. 11, B and C, bottom panels, and supporting Excel File S2). Further analysis of the phosphopeptides depleted by PP2A/B′δ RE using the phospho-NET kinase predictor (38) indicates that the top three protein kinase groups predicted to target these peptides are proline-directed kinases (CMGC group, 48.5% of peptides) and arginine-directed kinases (AGC group, 17.1%; CAMK group, 16.4%) (Fig. S2C and supporting Excel File S2). These predictions reflect the preference of PP2A/B′δ for Arg and Lys N-terminal and Pro C-terminal to the phosphorylation site according to motif analysis (Fig. 11B).
Figure 11.
PP2A/B′δ reduction identifies consensus dephosphorylation motifs in the global phosphoproteome. Phosphopeptides depleted ≥1.5-fold by PP2A/B′δ RE and OE were subjected to motif analysis. A, motif scores (means ± S.E.) of the 45 (RE) and 6 motifs (OE) identified by pLogo (see supporting Excel File S2 for a list of motifs). The p value is based on Student's t test. B and C, motif logos for phospho-Ser- (top) and phospho-Thr–containing peptides (bottom) depleted by PP2A/B′δ RE (B) and OE (C). Pink down arrows indicate positions with significantly enriched residues, which are identified by heights exceeding the significance threshold (red line at +3.75).
In conclusion, our approach of simplifying the PP2Aome permits unbiased identification of cellular targets of individual PP2A holoenzymes and suggests that, in addition to SLIMs, residues vicinal to the phosphorylation site are important selectivity determinants for PP2A.
Discussion
We describe here a strategy to replace the majority of endogenous PP2A holoenzymes with a defined holoenzyme that consists of Aα and B subunits with complementary charge-reversals complexed to the endogenous catalytic subunit. We identified complementary charge-swaps for all three regulatory subunit families, allowing future characterization of each of the 12 regulatory subunits in a cellular context in near isolation. We applied this PP2A reduction strategy to the PP2A/B′δ holoenzyme and uncovered substrates and dephosphorylation motifs that were not apparent by overexpression of the B′δ regulatory subunit. We therefore propose that PP2A complexity reduction is superior to overexpression as a complement to classical loss-of-function (knockout and knockdown) approaches. Unfortunately, because of functional redundancy within, possibly even across PP2A regulatory subunit families, silencing of individual regulatory subunits often has only moderate effects on cellular signaling (39, 40).
The incomplete removal of endogenous PP2A regulatory subunits (∼70% in the case of PP2A/B′δ, see Fig. 7) is considered a feature rather than a weakness of PP2A complexity reduction. We had previously shown (using a precursor of the current approach) that all three PP2A regulatory subunit families are required for cellular viability (39). Hence, residual endogenous PP2A holoenzymes ensure compatibility of the PP2A reduction strategy with long-term studies, including growth and proliferation experiments.
Even though B′δ and B′ϵ display near-perfect sequence conservation in their A subunit interfaces, the endogenous proteins responded differently to Aα mutagenesis. Specifically, and regardless of which Aα interface mutant was immunoprecipitated, interactions with B′ϵ were more strongly impaired than interactions with B′δ. In addition, even though PP2A/B′δ RE was accompanied by efficient degradation of endogenous B′δ (Fig. 7), the overexpressed protein was capable of interacting with the interface-mutant Aα R183E (Fig. 3, A and B). Thus, B′δ appears to bind more tightly to the A subunit than at least B′ϵ. Interestingly, compared with other B′ subunits, B′δ features an additional predicted anti-parallel α-helical repeat at its C terminus, which could be involved in stabilizing interactions within the PP2A holoenzyme.
The quantitative phosphoproteomic data set presented here indicates that PP2A is sensitive to residues flanking the phosphorylated Ser/Thr. In particular, PP2A/B′δ RE depletes phosphopeptides enriched in positive charges (largely Arg) at the N-terminal 1-, 3-, 5-, and 7-positions relative to phospho-Ser. In addition to a near-obligatory Pro at the +1-position, positions +2 through +6 display significant enrichments of acidic residues (Glu and Asp, Fig. 11B). Consensus dephosphorylation motifs centered on phospho-Thr show trends toward similar enrichments, although, with the limited number of phospho-Thr peptides in these data set, fewer positions reach statistical significance. Even though only a few of the depleted phosphopeptides have both N-terminal positive and C-terminal negative charges, the apparent polarity of the motifs suggests that substrates align with the catalytic site in a defined orientation that is dictated by nearby residues on the surface of the regulatory subunit. For B′δ and other B′-family subunits, residues that engage N-terminal Arg residues in substrate peptides include a string of highly-conserved acidic residues (197EEDE200 in B′δ), as we have previously shown in the context of PPP2R2B/B′β (16). Intriguingly, recurrent de novo charge-reversal mutations in human PPP2R5D/B′δ, including E197K, E198K, and E200K, cause autosomal-dominant mental retardation type 35 (MRD35, also known as Jordan's syndrome (41–43)), and PP2A reduction studies are underway to identify novel, potentially pathogenic substrates of the mutant PP2A/B′δ holoenzyme.
Experimental procedures
Antibodies
The following commercially-sourced antibodies and labels were used: mouse anti-GFP (clone N86/8, 1:500, Neuromab catalog no. 75-131); rabbit anti-Glu–Glu (1:1000, Cell Signaling catalog no. 2448); mouse anti-PP2A–Bpan (clone 2G9, 1:1000, Upstate catalog no. 05-592);, rat anti-PP2A-A (clone 6G3, 1:1000, Cell Signaling catalog no. 2260); mouse anti-PP2A-Cα (1:1000, BD Biosciences catalog no. 610556); rabbit anti-PP2A/B′δ (1:1000, Abcam catalog no. ab188323); rabbit anti-PP2A-B′ϵ (1:1000, Abcam catalog no. ab1985000); rabbit anti-ERK1/2 (1:500, Santa Cruz Biotechnology catalog no. sc-94); mouse anti-ERK1/2 (1:500, Santa Cruz Biotechnology catalog no. sc-514302); rabbit anti-phospho-ERK1/2 (Thr-202/Tyr-204) (1:1000, Cell Signaling catalog no. 4370); rabbit anti-phospho-PKA substrates (1:1000, Cell Signaling catalog no. 9624); mouse anti-MEK1/2 (1:1000, Cell Signaling catalog no. 4694); rabbit anti-phospho-MEK1/2 (Ser-217/Ser-221) (1:1000, Cell Signaling catalog no. 9154); rabbit anti-phosphoribosomal protein S6 (Ser-235/Ser-236) (1:1000, Cell Signaling catalog no. 4858); rabbit anti-phosphoribosomal protein S6 (Ser-240/Ser-244) (1:1000, Cell Signaling catalog no. 5364); mouse anti-ribosomal protein S6 (1:1000, Cell Signaling catalog no. 2317); goat anti-mouse IRDye® 680RD (LiCOR, catalog no. 926-68070); goat anti-rabbit IRDye® 800CW (LiCOR, catalog no. 926-32211); goat anti-rat IRDye® 800CW (LiCOR, catalog no. 926-32219).
Cell culture conditions and plasmid construction
COS-1 cells and HEK293 cells were cultured in Dulbecco's modified Eagle's medium (Gibco, catalog no. 11965092) supplemented with 10% fetal bovine serum (Atlanta Biologicals, catalog no. S11150) and 1% GlutaMAX (Gibco, catalog no. 35050061). pcDNA3 plasmids expressing Aα WT and mutants harboring a C-terminal EE-epitope tag were described previously (6).
Generation of tetracycline-inducible HEK293 cell lines and assessment of PP2A subunit protein expression
HEK293 T-REx cells (Takara/Clontech) were transfected with 5 μg of the linearized vector pcDNA6/TR encoding the tetracycline repressor protein and 10 μg of either the RE or OE constructs encoding PP2A/B′δ. 48 colonies were selected using 500 μg/ml hygromycin B (Thermo Fisher Scientific, catalog no. 10687010) and 5 μg/ml blasticidin S hydrochloride (MP Biomedicals, catalog no. 150477) and screened for overexpression of GFP-tagged PP2A/B′δ by fluorescence microscopy upon doxycycline induction. The selected clonal cell lines were further expanded and maintained in 100 μg/ml hygromycin B and 5 μg/ml blasticidin S hydrochloride. Subsequently, the protein expression of PP2A subunits following a time-dependent induction of doxycycline was assessed by immunoblotting. Briefly, 15,000 cells/well were seeded in a collagen-coated 24-well plate, and one column of cells was treated with 1 μg/ml doxycycline for 5 days. On the 6th day, the cells were washed with ice-cold 1× Dulbecco's PBS (Gibco, catalog no. 14190144), sonicated in 80 μl of 1× sample buffer, and subjected to Western blotting.
Transfection and coimmunoprecipitation
COS-1 cells were seeded in collagen-coated 6-well plates at a density of 4 × 10⁵ cells/well. After 2–4 h, cells were transfected with 4 μl/well Lipofectamine-2000 and 2 μg/well DNA (either 1 μg of GFP-tagged Bα or B′δ plasmid and 1 μg of EE-tagged Aα plasmid or 1.5 μg of GFP-tagged B″ plasmid and 0.5 μg of EE-tagged Aα plasmid). After 40–48 h, cells were washed with 1× Dulbecco's PBS (DPBS) (Gibco, catalog no. 14190144) and harvested in 350 μl of immunoprecipitation (IP) lysis buffer (20 mm Tris, pH 7.5, 150 mm NaCl, 1% Triton X-100, 1 mm EDTA, 1 mm EGTA, 1 μg/ml leupeptin, 1 mm benzamidine, and 1 mm phenylmethylsulfonyl fluoride). Lysates were then centrifuged at 13,000 rpm at 4 °C for 15 min. 40 μl of supernatant was collected as “input,” and 12.5 μl of 4× sample buffer (200 mm Tris, pH 6.8, 40% glycerol, 8% SDS, 0.1% bromphenol blue, 20% β-mercaptoethanol) was added to it. The remaining supernatant was incubated with goat anti-Glu–Glu antibody–conjugated agarose beads (Bethyl Laboratories, catalog no. S190-110) and rotated for 2 h at 4 °C. After 2 h, the immunoprecipitates were centrifuged at 4000 rpm for 2 min at 4 °C. 40 μl of the supernatant was collected as the “flow-through,” and 12.5 μl of 4× sample buffer was added to it. The remaining supernatant was aspirated, and the immunoprecipitates were washed with IP lysis buffer, rotated for 5–10 min at 4 °C, and centrifuged at 4000 rpm for 2 min. The immunoprecipitates were washed three more times and extracted in 15 μl of 2× sample buffer. The cell pellet was sonicated with 40 μl of 1× sample buffer. All the samples collected were subjected to Western blotting.
Substrate dephosphorylation assessment
HEK293 stable cell lines expressing PP2A/B′δ were seeded in collagen-coated 24-well plates at a density of 2.5 × 10⁴ cells/well and treated with 1 μg/ml doxycycline for 3 days followed by serum starvation in Opti-MEM I reduced serum medium (Gibco, catalog no. 31985070) for 4–6 h. To assess substrate dephosphorylation activity, cells were pretreated with 1 μm isoproterenol for 5 min followed by a time-dependent treatment of inhibitor mixture containing 10 μm propranolol and 50 μm H89 (Tocris catalog no. 2910) for 0, 0.75, 1.5, 3, and 5 min. The plate was then immediately flash-frozen in liquid nitrogen, and the cells were lysed in 80 μl of 1× sample buffer and subjected to Western blotting.
Western blotting
Samples were heated at 95 °C, and an equal volume of proteins was loaded onto 10% acrylamide gels and separated at a constant voltage of 180 V for 45 min. The proteins were then transferred onto nitrocellulose membrane at a constant current of 1 A for 2 h. The membranes were then washed, stained with Ponceau S, and blocked in 2% BSA supplemented with 0.05% sodium azide for 30 min at 37 °C. The membranes were washed with 1× TTBS (150 mm NaCl, 10 mm Tris, pH 7.5, 0.001% Triton X-100) followed by incubation with appropriate primary antibodies overnight at 4 °C. On the 2nd day, the membranes were washed with 1× TTBS and incubated with 1:15,000-diluted fluorescent dye–conjugated species–specific secondary antibodies (LI-COR) for 1 h at room temperature. Subsequently, the membranes were washed with 1× TTBS and visualized using the LI-COR Odyssey® IR imaging system. Densitometry analysis was performed using ImageJ. All the primary antibodies were prepared at the appropriate dilution in 1× TTBS containing 1% PVP40 and 0.05% sodium azide.
Sample preparation for phosphoproteomic analyses
For phosphoproteomics, three representative clonal cell lines expressing PP2A/B′δ WT from each RE and OE model were pooled and seeded in five 100-mm plates at a density of 2–3 million cells per 100-mm plate. The cells were treated with or without 1 μg/ml doxycycline for 3 days and then washed with 1× DPBS before serum starvation in Opti-MEM I reduced serum medium (Gibco, catalog no. 31985070) for 4–6 h. The cells were then pretreated with or without 1 μm isoproterenol for 5 min and were immediately flash-frozen in liquid nitrogen. The eight combinations of ±Dox- and ±isoproterenol-treated PP2A/B′δ RE or OE cells were individually harvested in urea lysis buffer (8 m urea in 50 mm ammonium bicarbonate supplemented with 1× cOmplete, mini-EDTA–free protease inhibitor mixture (Roche Applied Science, catalog no. 11836153001) and 1× PhosSTOP phosphatase inhibitor (Roche Applied Science, catalog no. 04906845001)), sonicated, and centrifuged at 13,000 × g for 15 min at 4 °C. Lysates were reduced with 5 mm DTT, alkylated with 15 mm iodoacetamide, and then subjected to digestion with trypsin (Promega) at a 1:50 enzyme/protein ratio. The resulting peptide samples were acidified and desalted using SepPak C18 SPE cartridges (Waters, 100 mg of sorbent). Eluates were dried via vacuum centrifugation. Peptide concentration was determined using Pierce Quantitative Colorimetric Peptide Assay. 300 μg of each sample was reconstituted with 200 mm triethylammonium bicarbonate and then individually labeled with a TMT 10-plex reagent (Thermo Fisher Scientific) for 5 h at room temperature. Labeling efficiency and sample ratios were evaluated by LC-MS/MS analysis of two test mixtures. Samples were quenched with 50% hydroxylamine to a final concentration of 0.4%. Labeled peptide samples were mixed at equal ratios (eight samples total), dried via vacuum centrifugation, and then desalted using SepPak C18 SPE cartridges (Waters, 500 mg of sorbent). 100 μg of the mixed TMT sample was fractionated into six “global proteome” fractions using high pH reverse-phase spin columns (Pierce). The remaining mixed TMT sample (2.3 mg) was enriched for phosphopeptides using MagReSyn Ti-MAC beads (ReSyn Biosciences), as described previously by Esnaut et al. (44). The phosphopeptide-enriched samples were fractionated into three “phosphoproteome” fractions using high-pH reverse-phase spin columns (Pierce). The proteome and phosphoproteome fractions were dried via vacuum centrifugation and stored at −80 °C until further analysis.
LC-MS/MS analysis
The proteome and phosphoproteome fractions were analyzed by LC-MS/MS using an Easy nLC 1200 coupled to a QExactive HF mass spectrometer (Thermo Fisher Scientific). Samples were injected onto an Easy Spray PepMap C18 column (75 μm inner diameter × 25 cm, 2-μm particle size) (Thermo Fisher Scientific) and separated over a 90-min period. The gradient for separation consisted of 5–50% mobile phase B at a 250 nl/min flow rate, where mobile phase A was 0.1% formic acid in water and mobile phase B consisted of 0.1% formic acid in 80% acetonitrile. The QExactive HF was operated in a data-dependent mode where the 15 most intense precursors were selected for subsequent high-energy collisional dissociation (HCD) fragmentation. Mass tolerances were set to 4.5 and 20 ppm for precursors and fragments, respectively. Resolution for the precursor scan (m/z 350–1600) was set to 60,000 with a target value of 3 × 10⁶ ions and a maximum injection time of 100 ms. MS/MS scan resolution was set to 60,000 with a target value of 1 × 10⁵ ions and a maximum injection time of 100 ms. Fixed first mass was set to 110 m/z, and the normalized collision energy was set to 32% for HCD. Dynamic exclusion was set to 30 s; peptide match was set to preferred; and precursors with unknown charge or a charge state of 1 and ≥8 were excluded.
Proteome and phosphoproteome data analysis
For the proteome and phosphoproteome data, raw data files were processed using MaxQuant version 1.6.1.0, set to “reporter ion MS2” with “10plex TMT.” The isolation purity was set to >0.7. Peak lists were searched against a reviewed Uniprot human database (downloaded February, 2018, containing 20,245 sequences) and appended with a common contaminants database, using Andromeda within MaxQuant. All fractions were searched with up to two missed trypsin cleavage sites, fixed Cys-carbamidomethylation modification, dynamic Met-oxidation, and Ser/Thr/Tyr phospho-modifications. Peptide false-discovery rate was set to 1%. Data were further analyzed and visualized in Perseus, Microsoft Excel, and R. Only phosphopeptides identified in both TMT sets with a localization probability score of >0.7 were reported.
Motif enrichment analysis
The phosphopeptide abundance was normalized to the protein abundance, and phosphopeptides with a normalized abundance ratio (+Dox/−Dox) of less than 0.67 were analyzed. The motif enrichment analysis of the aligned 15-mer peptides with phosphosite (serine or threonine) centered was performed using the pLogo web tool (RRID:SCR_018185) (35). The phosphosite was fixed as the center residue to identify residues that are significantly enriched as indicated by the height of the residue exceeding the statistically-significant red horizontal bar. To identify the consensus motifs, the significantly-enriched residues are independently fixed, and the motif score was calculated by summing up the log-odds score of the residues.
STRING network analysis
Substrates depleted by PP2A/B′δ RE after isoproterenol stimulation were analyzed for functional protein association networks and clustering analysis using the STRING web server (18). For this analysis, we focused on the substrates with abundance ratio (+Dox/−Dox) of less than 0.67. The interaction score was set at 0.9 with the highest confidence, and the cluster analysis was based on the k-means clustering of 5.
Gene functional classification
Substrates depleted by PP2A/B′δ RE after isoproterenol stimulation were analyzed for gene functional classification using the PANTHER classification system (32, 33). For this analysis, we focused on the substrates with abundance ratio (+Dox/−Dox) less than 0.67. The percent of genes that are enriched in each category are analyzed for molecular function, biological process, cellular component, protein class, and pathway.
Kinase prediction analysis
We analyzed the phosphopeptides that are more than 1.5-fold iso-enriched or iso-depleted for kinase groups that are likely to phosphorylate these peptides. We used the PhosphoNET Kinase Predictor web tool (38), which was developed by Kinexus Bioinformatics Corp. For each phosphopeptide, we analyzed the top five kinases that are likely to phosphorylate the peptide based on the kinase predictor score. The top five predicted kinases were further classified into 10 canonical kinase groups (AGC, CMGC, CAMK, TK, TKL, STE, CK1, RGC, atypical, and others) (45).
Statistical analysis
Statistical analyses were performed using GraphPad Prism. Data are shown as means ± S.E. of 3–8 replicates as indicated in the figure legends. A Student's t test was performed to assess the significance between two groups, and one- or two-way ANOVA followed by Dunnett's, Tukey's, or Sidak's post-hoc test were performed to assess the significance among more than two groups. A p value less than 0.05 was considered as statistically significant.
Data availability
The mass spectrometry proteomics data have been deposited to the ProteomeXchange Consortium via the PRIDE partner repository with the dataset identifier PXD016809.
Author contributions
C. J. J., R. A. M., and S. S. conceptualization; C. J. J., E. M. W., L. E. H., L. M. G., and S. S. investigation; C. J. J. and S. S. writing-original draft; C. J. J. and S. S. writing-review and editing; S. S. resources; S. S. supervision; S. S. funding acquisition; S. S. project administration.
Supplementary Material
Acknowledgments
The University of North Carolina Proteomics Core Facility is supported in part by National Institutes of Health Cancer Center Core Support Grant P30 CA016086 to the Lineberger Comprehensive Cancer Center. We acknowledge support by the Genomics Division of the University of Iowa Carver College of Medicine.
This work was supported by National Institutes of Health Grants NS056244 and NS087908 (to S. S.), Jordan's Guardian Angels, the Roy J. Carver Charitable Trust, and Iowa Neuroscience Institute (to S. S.). The authors declare that they have no conflicts of interest with the contents of this article. The content is solely the responsibility of the authors and does not necessarily represent the official views of the National Institutes of Health.
This article contains Figs. S1–S3 and supporting Excel Files S1 and S2.
- PSP
- protein Ser/Thr phosphatase
- PP2A
- protein phosphatase 2A
- RE
- complexity reduction
- OE
- overexpression
- Dox
- doxycycline
- ANOVA
- analysis of variance
- ERK
- extracellular signal-regulated kinase
- PKA
- protein kinase A
- SLIM
- short-linear interaction motif
- MEK
- mitogen-activated protein kinase/extracellular signal-regulated kinase kinase
- CAMK
- Ca2+/calmodulin-dependent protein kinase
- TMT
- tandem mass tag
- HCD
- high-energy collisional dissociation.
References
- 1. Wlodarchak N., and Xing Y. (2016) PP2A as a master regulator of the cell cycle. Crit. Rev. Biochem. Mol. Biol. 51, 162–184 10.3109/10409238.2016.1143913 [DOI] [PMC free article] [PubMed] [Google Scholar]
- 2. Virshup D. M., and Shenolikar S. (2009) From promiscuity to precision: protein phosphatases get a makeover. Mol. Cell 33, 537–545 10.1016/j.molcel.2009.02.015 [DOI] [PubMed] [Google Scholar]
- 3. Verbinnen I., Ferreira M., and Bollen M. (2017) Biogenesis and activity regulation of protein phosphatase 1. Biochem. Soc. Trans. 45, 89–99 10.1042/BST20160154 [DOI] [PubMed] [Google Scholar]
- 4. Shi Y. (2009) Serine/threonine phosphatases: mechanism through structure. Cell 139, 468–484 10.1016/j.cell.2009.10.006 [DOI] [PubMed] [Google Scholar]
- 5. Silverstein A. M., Barrow C. A., Davis A. J., and Mumby M. C. (2002) Actions of PP2A on the MAP kinase pathway and apoptosis are mediated by distinct regulatory subunits. Proc. Natl. Acad. Sci. U.S.A. 99, 4221–4226 10.1073/pnas.072071699 [DOI] [PMC free article] [PubMed] [Google Scholar]
- 6. Strack S., Cribbs J. T., and Gomez L. (2004) Critical role for protein phosphatase 2A heterotrimers in mammalian cell survival. J. Biol. Chem. 279, 47732–47739 10.1074/jbc.M408015200 [DOI] [PubMed] [Google Scholar]
- 7. Grinthal A., Adamovic I., Weiner B., Karplus M., and Kleckner N. (2010) PR65, the HEAT-repeat scaffold of phosphatase PP2A, is an elastic connector that links force and catalysis. Proc. Natl. Acad. Sci. U.S.A. 107, 2467–2472 10.1073/pnas.0914073107 [DOI] [PMC free article] [PubMed] [Google Scholar]
- 8. Strack S., Ruediger R., Walter G., Dagda R. K., Barwacz C. A., and Cribbs J. T. (2002) Protein phosphatase 2A holoenzyme assembly: identification of contacts between B-family regulatory and scaffolding A subunits. J. Biol. Chem. 277, 20750–20755 10.1074/jbc.M202992200 [DOI] [PubMed] [Google Scholar]
- 9. Ruediger R., Fields K., and Walter G. (1999) Binding specificity of protein phosphatase 2A core enzyme for regulatory B subunits and T antigens. J. Virol. 73, 839–842 10.1128/JVI.73.1.839-842.1999 [DOI] [PMC free article] [PubMed] [Google Scholar]
- 10. Yu U. Y., and Ahn J. H. (2010) Phosphorylation on the PPP2R5D B regulatory subunit modulates the biochemical properties of protein phosphatase 2A. BMB Rep. 43, 263–267 10.5483/BMBRep.2010.43.4.263 [DOI] [PubMed] [Google Scholar]
- 11. Ahn J. H., McAvoy T., Rakhilin S. V., Nishi A., Greengard P., and Nairn A. C. (2007) Protein kinase A activates protein phosphatase 2A by phosphorylation of the B56δ subunit. Proc. Natl. Acad. Sci. U.S.A. 104, 2979–2984 10.1073/pnas.0611532104 [DOI] [PMC free article] [PubMed] [Google Scholar]
- 12. Letourneux C., Rocher G., and Porteu F. (2006) B56-containing PP2A dephosphorylate ERK and their activity is controlled by the early gene IEX-1 and ERK. EMBO J. 25, 727–738 10.1038/sj.emboj.7600980 [DOI] [PMC free article] [PubMed] [Google Scholar]
- 13. Hertz E. P. T., Kruse T., Davey N. E., López-Méndez B., Sigurðsson J. O., Montoya G., Olsen J. V., and Nilsson J. (2016) A conserved motif provides binding specificity to the PP2A-B56 phosphatase. Mol. Cell 63, 686–695 10.1016/j.molcel.2016.06.024 [DOI] [PubMed] [Google Scholar]
- 14. Wu C. G., Chen H., Guo F., Yadav V. K., Mcilwain S. J., Rowse M., Choudhary A., Lin Z., Li Y., Gu T., Zheng A., Xu Q., Lee W., Resch E., Johnson B., et al. (2017) PP2A-B′ holoenzyme substrate recognition, regulation and role in cytokinesis. Cell Discov. 3, 17027 10.1038/celldisc.2017.27 [DOI] [PMC free article] [PubMed] [Google Scholar]
- 15. Wang X., Bajaj R., Bollen M., Peti W., and Page R. (2016) Expanding the PP2A interactome by defining a B56-specific SLiM. Structure 24, 2174–2181 10.1016/j.str.2016.09.010 [DOI] [PMC free article] [PubMed] [Google Scholar]
- 16. Saraf A., Oberg E. A., and Strack S. (2010) Molecular determinants for PP2A substrate specificity: charged residues mediate dephosphorylation of tyrosine hydroxylase by the PP2A/B′ regulatory subunit. Biochemistry 49, 986–995 10.1021/bi902160t [DOI] [PMC free article] [PubMed] [Google Scholar]
- 17. Kumar P., Tathe P., Chaudhary N., and Maddika S. (2019) PPM1G forms a PPP-type phosphatase holoenzyme with B56δ that maintains adherens junction integrity. EMBO Rep. 20, e46965 10.15252/embr.201846965 [DOI] [PMC free article] [PubMed] [Google Scholar]
- 18. Szklarczyk D., Gable A. L., Lyon D., Junge A., Wyder S., Huerta-Cepas J., Simonovic M., Doncheva N. T., Morris J. H., Bork P., Jensen L. J., and Mering C. V. (2019) STRING v11: protein–protein association networks with increased coverage, supporting functional discovery in genome-wide experimental datasets. Nucleic Acids Res. 47, D607–D613 10.1093/nar/gky1131 [DOI] [PMC free article] [PubMed] [Google Scholar]
- 19. Kamoun M., Filali M., Murray M. V., Awasthi S., and Wadzinski B. E. (2013) Protein phosphatase 2A family members (PP2A and PP6) associate with U1 snRNP and the spliceosome during pre-mRNA splicing. Biochem. Biophys. Res. Commun. 440, 306–311 10.1016/j.bbrc.2013.09.068 [DOI] [PMC free article] [PubMed] [Google Scholar]
- 20. Shi Y., Reddy B., and Manley J. L. (2006) PP1/PP2A phosphatases are required for the second step of pre-mRNA splicing and target specific snRNP proteins. Mol. Cell 23, 819–829 10.1016/j.molcel.2006.07.022 [DOI] [PubMed] [Google Scholar]
- 21. Riedel C. G., Katis V. L., Katou Y., Mori S., Itoh T., Helmhart W., Gálová M., Petronczki M., Gregan J., Cetin B., Mudrak I., Ogris E., Mechtler K., Pelletier L., Buchholz F., et al. (2006) Protein phosphatase 2A protects centromeric sister chromatid cohesion during meiosis I. Nature 441, 53–61 10.1038/nature04664 [DOI] [PubMed] [Google Scholar]
- 22. Vallardi G., Allan L. A., Crozier L., and Saurin A. T. (2019) Division of labour between PP2A-B56 isoforms at the centromere and kinetochore. Elife 8, e42619 10.7554/eLife.42619 [DOI] [PMC free article] [PubMed] [Google Scholar]
- 23. Smith R. J., Cordeiro M. H., Davey N. E., Vallardi G., Ciliberto A., Gross F., and Saurin A. T. (2019) PP1 and PP2A use opposite phospho-dependencies to control distinct processes at the kinetochore. Cell Rep. 28, 2206–2219.e8 10.1016/j.celrep.2019.07.067 [DOI] [PMC free article] [PubMed] [Google Scholar]
- 24. Yokoyama N., and Miller W. T. (2001) Protein phosphatase 2A interacts with the Src kinase substrate p130CAS. Oncogene 20, 6057–6065 10.1038/sj.onc.1204735 [DOI] [PubMed] [Google Scholar]
- 25. Basu S. (2011) PP2A in the regulation of cell motility and invasion. Curr. Protein Pept. Sci. 12, 3–11 10.2174/138920311795659443 [DOI] [PubMed] [Google Scholar]
- 26. Schuhmacher D., Sontag J. M., and Sontag E. (2019) Protein phosphatase 2A: more than a passenger in the regulation of epithelial cell–cell junctions. Front. Cell Dev. Biol. 7, 30 10.3389/fcell.2019.00030 [DOI] [PMC free article] [PubMed] [Google Scholar]
- 27. Takahashi K., Nakajima E., and Suzuki K. (2006) Involvement of protein phosphatase 2A in the maintenance of E-cadherin-mediated cell–cell adhesion through recruitment of IQGAP1. J. Cell. Physiol. 206, 814–820 10.1002/jcp.20524 [DOI] [PubMed] [Google Scholar]
- 28. Simboeck E., Sawicka A., Zupkovitz G., Senese S., Winter S., Dequiedt F., Ogris E., Di Croce L., Chiocca S., and Seiser C. (2010) A phosphorylation switch regulates the transcriptional activation of cell cycle regulator p21 by histone deacetylase inhibitors. J. Biol. Chem. 285, 41062–41073 10.1074/jbc.M110.184481 [DOI] [PMC free article] [PubMed] [Google Scholar]
- 29. Lee H. A., Song M. J., Seok Y. M., Kang S. H., Kim S. Y., and Kim I. (2015) Histone deacetylase 3 and 4 complex stimulates the transcriptional activity of the mineralocorticoid receptor. PLoS ONE 10, e0136801 10.1371/journal.pone.0136801 [DOI] [PMC free article] [PubMed] [Google Scholar]
- 30. Martin M., Potente M., Janssens V., Vertommen D., Twizere J. C., Rider M. H., Goris J., Dimmeler S., Kettmann R., and Dequiedt F. (2008) Protein phosphatase 2A controls the activity of histone deacetylase 7 during T cell apoptosis and angiogenesis. Proc. Natl. Acad. Sci. U.S.A. 105, 4727–4732 10.1073/pnas.0708455105 [DOI] [PMC free article] [PubMed] [Google Scholar]
- 31. Ye C., Sutter B. M., Wang Y., Kuang Z., Zhao X., Yu Y., and Tu B. P. (2019) Demethylation of the protein phosphatase PP2A promotes demethylation of histones to enable their function as a methyl group sink. Mol. Cell 73, 1115–1126.e6 10.1016/j.molcel.2019.01.012 [DOI] [PMC free article] [PubMed] [Google Scholar]
- 32. Mi H., Muruganujan A., Ebert D., Huang X., and Thomas P. D. (2019) PANTHER version 14: more genomes, a new PANTHER GO-slim and improvements in enrichment analysis tools. Nucleic Acids Res. 47, D419–D426 10.1093/nar/gky1038 [DOI] [PMC free article] [PubMed] [Google Scholar]
- 33. Mi H., Muruganujan A., Huang X., Ebert D., Mills C., Guo X., and Thomas P. D. (2019) Protocol update for large-scale genome and gene function analysis with the PANTHER classification system (v.14.0). Nat. Protoc. 14, 703–721 10.1038/s41596-019-0128-8 [DOI] [PMC free article] [PubMed] [Google Scholar]
- 34. Meyuhas O. (2015) Ribosomal protein S6 phosphorylation: four decades of research. Int. Rev. Cell Mol. Biol. 320, 41–73 10.1016/bs.ircmb.2015.07.006 [DOI] [PubMed] [Google Scholar]
- 35. O'Shea J. P., Chou M. F., Quader S. A., Ryan J. K., Church G. M., and Schwartz D. (2013) pLogo: a probabilistic approach to visualizing sequence motifs. Nat. Methods 10, 1211–1212 10.1038/nmeth.2646 [DOI] [PubMed] [Google Scholar]
- 36. Kruse T., Zhang G., Larsen M. S., Lischetti T., Streicher W., Kragh Nielsen T., Bjørn S. P., and Nilsson J. (2013) Direct binding between BubR1 and B56-PP2A phosphatase complexes regulate mitotic progression. J. Cell Sci. 126, 1086–1092 10.1242/jcs.122481 [DOI] [PubMed] [Google Scholar]
- 37. McCloy R. A., Parker B. L., Rogers S., Chaudhuri R., Gayevskiy V., Hoffman N. J., Ali N., Watkins D. N., Daly R. J., James D. E., Lorca T., Castro A., and Burgess A. (2015) Global phosphoproteomic mapping of early mitotic exit in human cells identifies novel substrate dephosphorylation motifs. Mol. Cell. Proteomics 14, 2194–2212 10.1074/mcp.M114.046938 [DOI] [PMC free article] [PubMed] [Google Scholar]
- 38. Safaei J., Manuch J., Gupta A., Stacho L., and Pelech S. (2011) Prediction of 492 human protein kinase substrate specificities. Proteome Sci. 9, Suppl. 1, S6 10.1186/1477-5956-9-S1-S6 [DOI] [PMC free article] [PubMed] [Google Scholar]
- 39. Van Kanegan M. J., Adams D. G., Wadzinski B. E., and Strack S. (2005) Distinct protein phosphatase 2A heterotrimers modulate growth factor signaling to extracellular signal-regulated kinases and Akt. J. Biol. Chem. 280, 36029–36036 10.1074/jbc.M506986200 [DOI] [PubMed] [Google Scholar]
- 40. Van Kanegan M. J., and Strack S. (2009) The protein phosphatase 2A regulatory subunits B′β and B′δ mediate sustained TrkA neurotrophin receptor autophosphorylation and neuronal differentiation. Mol. Cell. Biol. 29, 662–674 10.1128/MCB.01242-08 [DOI] [PMC free article] [PubMed] [Google Scholar]
- 41. Houge G., Haesen D., Vissers L. E., Mehta S., Parker M. J., Wright M., Vogt J., McKee S., Tolmie J. L., Cordeiro N., Kleefstra T., Willemsen M. H., Reijnders M. R., Berland S., Hayman E., et al. (2015) B56δ-related protein phosphatase 2A dysfunction identified in patients with intellectual disability. J. Clin. Invest. 125, 3051–3062 10.1172/JCI79860 [DOI] [PMC free article] [PubMed] [Google Scholar]
- 42. Loveday C., Tatton-Brown K., Clarke M., Westwood I., Renwick A., Ramsay E., Nemeth A., Campbell J., Joss S., Gardner M., Zachariou A., Elliott A., Ruark E., van Montfort R., Childhood Overgrowth Collaboration, and Rahman N. (2015) Mutations in the PP2A regulatory subunit B family genes PPP2R5B, PPP2R5C and PPP2R5D cause human overgrowth. Hum. Mol. Genet. 24, 4775–4779 10.1093/hmg/ddv182 [DOI] [PMC free article] [PubMed] [Google Scholar]
- 43. Shang L., Henderson L. B., Cho M. T., Petrey D. S., Fong C. T., Haude K. M., Shur N., Lundberg J., Hauser N., Carmichael J., Innis J., Schuette J., Wu Y. W., Asaikar S., Pearson M., et al. (2016) De novo missense variants in PPP2R5D are associated with intellectual disability, macrocephaly, hypotonia, and autism. Neurogenetics 17, 43–49 10.1007/s10048-015-0466-9 [DOI] [PMC free article] [PubMed] [Google Scholar]
- 44. Esnault S., Hebert A. S., Jarjour N. N., Coon J. J., and Mosher D. F. (2018) Proteomic and phosphoproteomic changes induced by prolonged activation of human eosinophils with IL-3. J. Proteome Res. 17, 2102–2111 10.1021/acs.jproteome.8b00057 [DOI] [PMC free article] [PubMed] [Google Scholar]
- 45. Manning G., Whyte D. B., Martinez R., Hunter T., and Sudarsanam S. (2002) The protein kinase complement of the human genome. Science 298, 1912–1934 10.1126/science.1075762 [DOI] [PubMed] [Google Scholar]
Associated Data
This section collects any data citations, data availability statements, or supplementary materials included in this article.
Supplementary Materials
Data Availability Statement
The mass spectrometry proteomics data have been deposited to the ProteomeXchange Consortium via the PRIDE partner repository with the dataset identifier PXD016809.


