

Abstract
Cytochrome c oxidase (CcO) reduces O2 to water, coupled with a proton-pumping process. The structure of the O2-reduction site of CcO contains two reducing equivalents, Fea32+ and CuB1+, and suggests that a peroxide-bound state (Fea33+–O−–O−–CuB2+) rather than an O2-bound state (Fea32+–O2) is the initial catalytic intermediate. Unexpectedly, however, resonance Raman spectroscopy results have shown that the initial intermediate is Fea32+–O2, whereas Fea33+–O−–O−–CuB2+ is undetectable. Based on X-ray structures of static noncatalytic CcO forms and mutation analyses for bovine CcO, a proton-pumping mechanism has been proposed. It involves a proton-conducting pathway (the H-pathway) comprising a tandem hydrogen-bond network and a water channel located between the N- and P-side surfaces. However, a system for unidirectional proton-transport has not been experimentally identified. Here, an essentially identical X-ray structure for the two catalytic intermediates (P and F) of bovine CcO was determined at 1.8 Å resolution. A 1.70 Å Fe–O distance of the ferryl center could best be described as Fea34+ = O2−, not as Fea34+–OH−. The distance suggests an ∼800-cm−1 Raman stretching band. We found an interstitial water molecule that could trigger a rapid proton-coupled electron transfer from tyrosine-OH to the slowly forming Fea33+–O−–O−–CuB2+ state, preventing its detection, consistent with the unexpected Raman results. The H-pathway structures of both intermediates indicated that during proton-pumping from the hydrogen-bond network to the P-side, a transmembrane helix closes the water channel connecting the N-side with the hydrogen-bond network, facilitating unidirectional proton-pumping during the P-to-F transition.
Keywords: enzyme mechanism, metalloenzyme, cytochrome c oxidase (complex IV), proton pump, X-ray crystallography, mitochondrial membrane potential, bioenergetics, heme, catalytic intermediate, copper
Introduction
Bovine heart cytochrome c oxidase (CcO)6 reduces molecular oxygen (O2) in a reaction that is coupled to a proton-pumping process (1, 2). Extensive studies on this reaction, since the early days of its discovery (3), suggest a catalytic cycle, as schematically described in Fig. 1A (1, 2). O2 binds to the O2-reduction site (Fea3 and CuB) of the R-form, in which both metals are in the reduced state, to generate the O2-bound form (the A-form). The bound O2 is spontaneously reduced to two oxide ions (2 O2−) that give the P-form, including Fea34+=O2−, CuB2+–OH−, and Tyr244–O• radical (1, 2). In this paper, amino acid positions in the primary sequence are indicated according to the numbering of bovine CcO unless otherwise stated. In turn, four electron equivalents are sequentially transferred from cytochrome c to the P-form to regenerate the R-form yielding three intermediate forms: F, O, and E. Four proton equivalents for production of two water molecules are transferred from the N-side of the mitochondrial membrane through two proton-conducting pathways, designated as the D-pathway and the K-pathway, which are illustrated in Fig. 1B (1, 2). The separation of the charge translocation produces an electrochemical potential across the mitochondrial membrane. Each of the sequential four-electron transfers is coupled with one proton equivalent pumped across the membrane to provide the proton gradient (Fig. 1A) (1, 2, 4).
Figure 1.

Catalytic cycle of bovine heart CcO and X-ray structure of the active sites. A, schematic representation of the catalytic cycle of CcO; Fea3 and CuB are the iron and copper ions in the O2-reduction site; Tyr–OH and Tyr–O• denote Tyr244 located in the O2-reduction site in its protonated and neutral radical states, respectively; the A-, P-, F-, O-, E- and R-forms are the six intermediate species in the catalytic cycle, and the oxidation and ligand-binding state are described in parentheses. The reaction steps coupled with proton pumping are indicated by straight arrows marked with H+. B, X-ray structure of the active sites. The large brown spheres are iron ions; the violet spheres are copper ions; the beige sphere is magnesium ions. The magenta stick models represent porphyrins of heme a and heme a3 as labeled. Within the stick models of the amino acid residues, dark blue portions are nitrogen; red portions are oxygen; and yellow portions are carbon. The proposed pathway for passage of electrons is indicated by a beige arrow, and those for protons producing water molecules are indicated by two black arrows. The hydrogen-bond network and the water channel of the H-pathway are indicated by the red and blue portions of the leftmost curved arrow, respectively. The hydrogen-bond network is connected with the Mg/H2O cluster (blue area) via a short hydrogen-bond network (gray area). The positions of water molecules in the Mg/H2O cluster are indicated by small blue spheres, and the other water molecule positions are indicated by small beige spheres. The formyl group and one of the propionate groups of heme a are hydrogen-bonded with Arg38 and a fixed water molecule in the hydrogen-bond network of the H-pathway. The locations of the redox-active metal sites and pathways for transportation of electrons and protons within the overall CcO structure, indicated by Cα-backbone traces, are shown in the inset. This figure was prepared from the X-ray diffraction data of PDB code 5B1A.
It is well-known that a one-electron reduction of O2 is energetically unfavorable, whereas a simultaneous two-electron reduction is energetically favorable (5). This chemical property of O2 is critical for the stability of the O2-bound form of hemoglobins and myoglobins, as the second electron is not readily available to the heme site (Fe2+–O2) embedded within the globin moiety. O2 binds to the O2-reduction site of CcO, which includes two metal sites, heme a3 (Fea3) and CuB, only when both metal sites are in the reduced state, as in the R-form in Fig. 1A (6). The location of the two metal ions in the O2-reduction site of CcO strongly suggests that the initial intermediate in the O2-reduction process of CcO is a bridging peroxide, Fea33+–O−–O−–CuB2+ (5). However, extensive time-resolved resonance Raman analyses of the O2-reduction process have revealed that the initial intermediate is Fea32+–O2 and that the second intermediate includes a ferryl oxide state (Fea34+=O2−), indicating that the O–O bond is broken at this stage (7). To resolve this enigma, stable Fea32+–O2 and unstable Fea33+–O−–O−–CuB2+, it is necessary to determine X-ray structures of the active sites of these intermediate species at high resolution.
The existence of a proton-conducting pathway, which is known as the H-pathway, marked by the blue and red arrows drawn on the far-left of Fig. 1B, has been revealed by X-ray structures of bovine heart CcO in various oxidation- and inhibitor-binding states (1, 8–11). This pathway is composed of a hydrogen-bond network (red) and a water channel (blue) through which water molecules on the N-side gain access to the bottom end of the hydrogen-bond network, which extends to the P-side surface of the CcO molecule, as described in Fig. 1B, inset. Thus, the protons to be pumped are transferred from the N-side as hydronium ions via the water channel to the hydrogen-bond network. The hydrogen-bond network is attached to heme a (Fea) near its bottom end via two hydrogen bonds to the propionate group and the formyl group of the porphyrin ring of heme a, as shown in Fig. 1B (1, 8, 9). This structure suggests that electrostatic repulsions between the protons on the hydrogen-bond network and the net positive charges created upon heme a oxidation drive the process of pumping the protons to the P-side (1, 8, 11).
The hydrogen-bond network of the H-pathway is attached to a proton storage area, indicated by the blue background in Fig. 1B, via a short hydrogen-bond network, indicated by the gray area in Fig. 1B (11). The proton storage area is provided by a large water cluster for at least four proton equivalents. The protons to be pumped are stored transiently in the proton storage area before oxidation of heme a. This system is necessary for effective collection of the protons to be pumped from the N-side, because proton collection could be suppressed by the net positive charges on heme a.
The tight interaction between heme a and the hydrogen-bond network, which is required to drive the protons to the P-side, has recently been confirmed by a high-resolution X-ray structural analysis of the azide-bound CcO (10). However, electrostatic repulsion itself does not provide directionality to the movement of protons after repulsion. Rather, an effective system that blocks back-leakage of protons from the electrostatic repulsion site is required to provide efficient energy transduction.
Narrowing of the water channel by elimination of one of the largest cavities, including Met383 near the P-side end of the water channel, was identified by comparison of X-ray structures of CcO forms in various oxidation- and inhibitor-binding states (1, 8–11). The narrowing suggests that there is effective blockage of proton exchange between the hydrogen-bond network and the N-side, which could facilitate unidirectional proton transfer, if it occurs during the catalytic cycle (1, 8–11). The structures of the water channel with and without this cavity are designated as the open state and the closed state, respectively. This unidirectional mechanism is derived from X-ray structures of stable CcO forms not involved in the catalytic turnover (1, 8–11). Thus, the mechanism remains a proposal. The catalytic intermediate forms of CcO are not easily stabilized sufficiently for crystallization. A preliminary analysis of the electron density of some intermediate forms has been presented (9) but has not yet been completely refined.
We performed X-ray crystal structural analyses using crystals of a roughly equimolar mixture of two catalytic intermediate forms, the P-form and the F-form, prepared by H2O2 treatment of the crystalline bovine heart CcO. The X-ray structural results show that the water channel of both forms is in the closed state, confirming experimentally the above-proposed unidirectional mechanism during the P-to-F transition.
An interstitial water molecule hydrogen-bonded to Tyr244 was identified in the O2-reduction site of the intermediates. This water molecule can trigger a rapid proton-coupled electron transfer from Tyr244–OH to the bridging peroxide, which appears prior to the P-formation, giving a negligible level of the bridging peroxide form, consistent with the resonance Raman data reported almost 30 years ago (1, 7).
Results
Preparation of crystals of the intermediate forms of bovine heart CcO by treating crystals of the resting oxidized form with H2O2 at pH 5.7
Crystals of the P- and F-forms were prepared using a method similar to that used to prepare these forms in solution from the resting oxidized form (7, 12, 13). The bovine heart CcO as purified is in the fully-oxidized state. The fully-oxidized preparation is known as the “resting oxidized form,” because it has no proton-pumping activity, in contrast to the O-form, which is generated during catalytic turnover (Fig. 1A). It has been shown that the resting oxidized form is in a peroxide-bound fully-oxidized state (14). Treatment of the crystalline resting oxidized form at pH 5.7 with 10 mm H2O2 in the presence of 50 μm phenazine methosulfate (PMS) results in the gradual appearance of two bands at 607 and 580 nm in UV-visible spectra at 4 °C at pH 6.0, as shown in Fig. 2A. With addition of H2O2 to a concentration of 100 mm in the presence of 100 μm PMS, the 607-nm band increases in intensity for 24 min and then gradually decreases, as shown in Fig. 2B. Further details in the reaction of crystalline resting oxidized CcO with H2O2 is given in Text S1. The role of PMS in formation of the P-form and the F-form in the crystals is discussed in Text S2.
Figure 2.

Absorption of spectral changes of resting oxidized CcO crystals induced by H2O2 treatment. A and B, spectral changes at 4 °C induced by 10 mm H2O2 in the presence of 50 μm PMS and 100 mm H2O2 in the presence of 100 μm PMS, respectively. Each spectrum is a difference spectrum representing the spectral difference before and after H2O2 treatment. C, absolute absorption spectra of frozen crystals treated with 50 mm H2O2 in the presence of 50 μm PMS, before (blue) and after (red) X-ray exposure for X-ray diffraction experiments. The spectra were measured under N2 flow at 100 K. The small difference in the band position of the P-form (607 nm in A and B versus 604 in C) is due to the difference in the spectral measurement. The former is the difference spectra against the resting oxidized form, and the latter shows absolute spectra.
The position of this 607-nm band is essentially identical to the position of a similar band of the reduced heme a. In contrast, in the resting oxidized form of CcO in solution at low pH and in the presence of H2O2, the 607-nm band appears at 580 nm (12). However, the 607-nm band is unlikely to be due to heme a reduction because reduction of the resting oxidized form of CcO by H2O2 is energetically unfavorable (15, 16). Furthermore, even if H2O2 were to cause reduction of CcO, the reduced CcO would be readily oxidized by O2, produced by oxidation of H2O2. Lower H2O2 concentrations provide a higher intensity ratio of the 607/580-nm bands as shown in Fig. 2, A and B. This tendency is inconsistent with a scenario involving reduction of heme a to provide the 607-nm band in the crystals. Thus, it appears that the 607-nm band arises from generation of the P-form of CcO. Assuming that the extinction coefficients for the P-form and the F-form determined in solution (12) are the same in the frozen crystals, the P/F ratio is estimated to be about 1 in the crystals subsequently used for X-ray diffraction experiments (Fig. 2C). Formation of the 607-nm band at low pH in the crystals suggests that protonation of the O2-reduction site via the K-pathway, which is required for the spectral transition from the 607- to the 580-nm band (17), is blocked in the crystals.
The spectrum measured after X-ray diffraction experiments (Fig. 2C) indicates that there is a significant increase in intensity of the 604-nm band relative to the 580-nm band measured before the X-ray diffraction experiment. This absorbance increment must be due to reduction of heme a by hydrated electrons produced by X-ray irradiation in the X-ray diffraction experiments at SPring-8. Under frozen conditions at 100 K, the diffusion of O2 to the O2-reduction site is significantly limited, and consequently the reduced CcO species is prevented from being oxidized. Even under the frozen conditions, electron transfers within the redox-active metal sites in each CcO molecule in the crystal are not suppressed, and reduced heme a would be readily oxidized by Fea3 or CuB in the P- or F-form. Thus, the detectable increment in heme a reduction upon X-ray irradiation suggests that the other redox-active metal sites, Fea, CuA, and CuB, are also in the reduced state. No extra absorbance band other than the 604-nm band in the α-band region indicates formation of the ligand-free Fea32+. Further discussion on this conclusion is provided in Text S1.
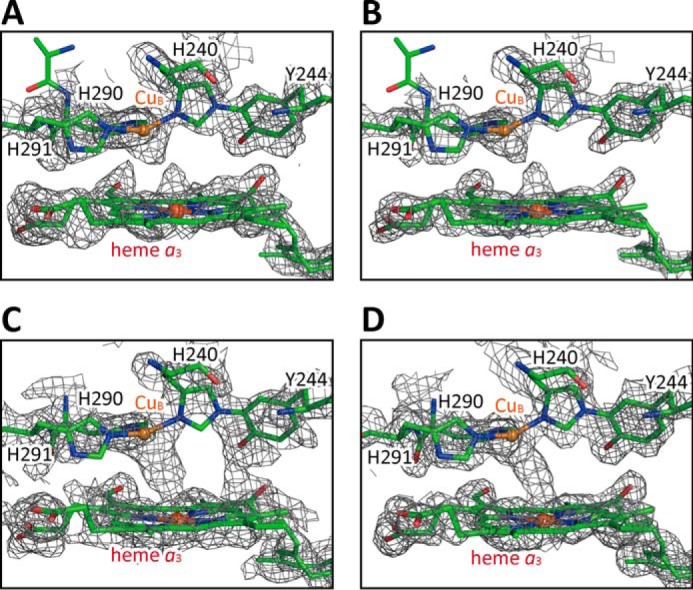
Assessment of multiple structures detectable in the present X-ray diffraction data set
The X-ray diffraction data set was obtained from crystals of the resting oxidized form treated with 50 mm H2O2 and 50 μm PMS. The structural model of the resting oxidized form of CcO (PDB code 5B1A) was found to be well-superimposed on the MR/DM map as shown in Fig. 3, A–C. The three panels display the three regions where significant structural differences are detectable between the structures of the resting oxidized form and the fully-reduced form. All three regions are involved in the H-pathway (Fig. 1B). A structural refinement converged well with the structure of the resting oxidized form.
Figure 3.

Electron density maps of the three regions, in which differences between the oxidized-type and reduced-type structures are significant, for monomer A at 1.8 Å resolution. The MR/DM maps of the regions, including residues 48–55 (A), residues 380–385 (B), and the hydroxyfarnesyl ethyl group of heme a (C) are superimposed on the atomic model of the oxidized-type structure used for calculation of an Fo − Fc map given in Fig. 5. Electron density cages were drawn at 1.50 σ.
Fig. 4A shows distribution of the B-factors of the main-chain portions (–NH–Cα–CO–) of the residues in subunit I of the H2O2-treated resting oxidized CcO. The high B-factor values (>30 Å2) in the two regions between residues 380 and 385, including Met383, and between residues 48 and 55, including Gly49, are not detectable in the corresponding regions of the resting oxidized CcO as shown in Fig. 4, B and C, respectively. Similarly, the significantly high average B-factor values of hydroxyfarnesyl ethyl group of heme a, compared with that of the rest of the heme a molecule, are not detectable in the same group of the resting oxidized CcO. Thus, these B-factor distributions suggest that existence of either an additional structure as a minor component or that high thermal motions in these three regions induce these high B-factor values.
Figure 4.

B-factors of main-chain portions of amino acid residues (–NH–Cα–CO–) in the X-ray structure of subunit I in H2O2-treated bovine heart CcO, determined at 1.8 Å in this study. A, B-factor values in Å2 are plotted against residue numbers. The positions of residues at the local peaks of the B-factor regions (>30 Å2) are marked by numbers above the plot. B, B-factor distributions near residue 383 of H2O2-treated CcO (dark blue) and resting oxidized CcO (light blue). C, B-factor distributions near residue 49 of H2O2-treated CcO (dark blue) and resting oxidized CcO (light blue).
For examination of the existence of a minor component, the Fo − Fc maps against the resting oxidized CcO model were determined. In the above three regions, the Fo − Fc maps exhibit significant differences in electron densities, as shown in Fig. 5, A, D, and G. The positive densities (blue) in these maps are assignable to the structures of the fully-reduced form, reported previously (11), as shown in Fig. 5, B, E, and H, whereas the negative densities (red), given in Fig. 5, C, F, and I, are assignable to the structures of the resting oxidized form. The electron density differences correspond to those induced by reduction of the resting oxidized form to the fully-reduced form. Thus, the Fo − Fc maps strongly suggest that the high B-factor values are induced by coexistence of the fully-reduced form as a minor component. Hereafter, the structures detectable in the resting oxidized and fully-reduced forms will be designated as the oxidized-type and reduced-type structures, respectively. The region between residues 380 and 385, including Met383 in the oxidized-type structure, provides the closed state of the water channel of the H-pathway.
Figure 5.

Fo − Fc maps of the regions are shown, including residues 48–55 (A), residues 380–385 (D), and the hydroxyfarnesyl ethyl group of heme a (G), with each giving positive (blue) and negative (red) residual densities and the oxidized-type structures. Electron density cages of the Fo − Fc maps were drawn at 3.0 σ and superimposed on the corresponding atomic models of oxidized-type structures. B, E, and H, cages of the positive residual densities detectable in A, D, and G, respectively, superimposed on the corresponding atomic models of reduced-type structures. C, F, and I, cages of the negative residual densities detectable in the A, D, and G, respectively, superimposed on the corresponding atomic models of oxidized-type structures. Representative positive density cages on the reduced-type model are indicated by blue arrows, and representative negative density cages on the oxidized-type model are indicated by red arrows.
For further improvements in the X-ray structural analysis, we determined the contents of the oxidized-type and reduced-type structures by searching the content of the minor component, the reduced-type structure, that yields an identical average B-factor for the oxidized- and reduced-type structures. This determination is practical for many multiple X-ray structures, because it is reasonable to assume that B-factors of the multiple structures are identical with each other. Fig. 6 gives the average B-factor differences (ΔB) between the oxidized-type and reduced-type structures against the content of the reduced-type structure in the three regions. The monotonous changes in ΔB indicate that the present X-ray diffraction data allow a reliable evaluation for the content of the reduced-type structure. The contents of the reduced-type structure giving ΔB = 0 are 32% for residues 48–55; 15% for residues 380–385; and 35% for the hydroxyfarnesyl ethyl group of heme a as shown in Fig. 6, for monomer A, which is one of the monomers of the dimer in the asymmetric unit as defined under “Experimental procedures.” Essentially identical results were obtained for monomer B.
Figure 6.

Effect of inclusion of the reduced-type structure on the average B-factor values of the refined structures of both the oxidized- and reduced-type structures for the monomer A. The effect is shown by the difference between the average B-factor values of the refined oxidized- and reduced-type structures (ΔB), defined as follows: ΔB = average B-factor value of the refined oxidized-type structure − average B-factor value of the refined reduced-type structure. The ΔB values, determined at various inclusions of the reduced-type structure, are plotted against the content of the reduced-type structure included for the hydroxyfarnesyl ethyl group of heme a in green and for residues 48–55 and 380–385 in blue and red plots, respectively.
For evaluation of the above quantification for the contents of the oxidized-type and reduced-type structures, structures representing the coexisting two structures, determined by the above ΔB analysis, were refined. The resultant B-factor values in regions 48–55 and 380–385 are significantly lower than those determined assuming only the oxidized-type structure and are essentially identical to those in a structure of the resting oxidized CcO (PDB code 5B1A), as shown in Fig. S1. Residual electron densities in Fo − Fc maps for the coexisting structures in the three regions (Fig. S2, B, D and F) are lower than those calculated assuming only the oxidized-type structure (Fig. S2, A, C, and E). The B-factor distributions and the Fo − Fc maps indicate that the quantification of the two components by the ΔB analysis is successful.
Ignoring these unusually-high B-factor regions as detected in this work would provide an unreal structural model that could be a weighted-average structure of the two component structures. The present B-factor analysis is applicable to X-ray structural analyses for processes of functional proteins during which multiple intermediate forms appear.
X-ray structural analyses of the O2 reduction site
In calculation of MR/DM electron density map of the O2-reduction site, shown in Fig. 7A, flattening of electron densities of solvent regions as high as 70% volume of the unit cell and a local noncrystallographic 2-fold symmetry averaging in the DM procedure reduced initial model bias highly efficiently. For confirming the high efficiency, a simulated annealing composite omit map (18) was calculated by including simulated annealing procedure for the structure without ligand atoms in the O2-reduction site. The simulated annealing composite omit map drawn at 2.5 σ (Fig. 7B) is essentially identical with the MR/DM map given in Fig. 7A. The absence of significant difference between the two maps indicates that initial model bias has been successfully removed.
Figure 7.
Comparison of the MR/DM electron density map of the O2-reduction site, obtained from H2O2-treated CcO, with that of resting oxidized bovine heart CcO in monomer A. Structures of proteins and hemes are drawn as stick models, and the Fe atoms in heme a3 and Cu atoms in CuB site are indicated by spheres. A and B, MR/DM electron density map (A) and simulated annealing composite omit map (B) of the O2-reduction site of H2O2-treated resting oxidized bovine heart CcO. The composite omit map (B) was calculated for the structure that contained no ligands in the O2-reduction site. C and D, MR/DM electron density maps of the O2-reduction site of resting oxidized bovine heart CcO determined at SPring-8 (11) and at SACLA (53), respectively. Resolutions of the MR/DM maps given in A, C, and D were 1.8, 1.8, and 1.9 Å, respectively. Electron density cages of the MR/DM maps (A, C, and D) were drawn at 1.7 σ and that of the composite omit map (B) was at 2.5 σ.
MR/DM maps of the resting oxidized CcO determined at SPring-8 (Fig. 7C) adjusted to 1.8 Å resolution and at SACLA (Fig. 7D) determined at 1.9 Å resolution are given for comparison with the present result. X-ray diffraction data obtained at SACLA are free of X-ray damage (19). The MR/DM maps of Fig. 7, A, C, and D, are drawn at 1.7 σ, enabling direct comparisons among them. Although each of the resting oxidized forms in Fig. 7, C and D, provides a continuous electron density between the two metal sites, indicating the existence of a bridging peroxide anion, both of the MR/DM and the composite omit maps of the H2O2-treated crystals, as shown in Fig. 7, A and B, show that electron density located between two oxygen atoms is clearly weaker than that in the resting fully-oxidized forms. The electron densities at both Fea3 and CuB have protrusions indicating shorter coordination bonds of metal-oxygen and longer distance between two ligand oxygen atoms (Fig. 7, A and B) than those of the two structures of resting oxidized CcO (Fig. 7, C and D).
The structure without any ligand in the O2-reduction site was refined, and the Fo − Fc map was calculated to determine the structures of the metal-liganded oxygen atoms. The positions of the ligands (Fig. 8A) are consistent with the protrusion shapes of MR/DM map for Fea3 and CuB (Fig. 7A). Two peaks separated by ∼2.51 Å were assigned to the oxygen atoms of O1 and O2 coordinated to Fea3 and CuB, respectively (Fig. 8A).
Figure 8.

X-ray structure of the O2-reduction site. A, Fo-Fc map of the O2 reduction site of the X-ray structure of H2O2-treated CcO in monomer A at 1.80 Å resolution. Refinement was performed on a structure in the absence of a ligand in the O2-reduction site and without the water molecule bridging the two propionate groups of heme a3. Based on the refined structure, the Fo-Fc map was calculated. The electron density cages were drawn at 5.0 σ. B, Fo-Fc map of the two oxygen atoms bound to Fea3 and CuB in monomer A at 1.80 Å resolution. Refinement was performed on a structure including two oxygen ligands at Fea3 and CuB under a restraint condition of 2.50 Å for the distance between two oxygen atoms and without the water molecule bridging the two propionate groups and the Fo-Fc map was calculated. The electron density cages were drawn at 2.50 σ. C, structure of the O2-reduction site shown as a stick model colored as described for Fig. 7. The distances and bond angles shown are averaged values between two monomers. Two ligand oxygen atoms are coordinated to Fea3 and CuB with distances of 1.70 and 2.11 Å, respectively. The thin stick shows the location of a peroxide ion existing partially within the O2-reduction site of each monomer, assigned for the residual density in B. A water molecule is hydrogen-bonded to Tyr244. The inset shows a schematic representation of the coordination structures of Fea3 and CuB.
To confirm the structural features of the two peaks in the Fo − Fc map, we calculated an annealing Fo − Fc map and a Polder map (20). The former was calculated by including simulated annealing procedure in the refinement before assignment of ligand atoms in the O2-reduction site and of a water oxygen atom between two propionate groups of heme a3 (Fig. S3A). The latter was calculated for the final stage of the structure refinement by excluding ligand oxygen atoms in the O2-reduction site and a water oxygen atom between two propionate groups of heme a3 (Fig. S3B). Both electron density maps are closely similar to the Fo − Fc map given in Fig. 8A. The distances between two peaks of the simulated annealing Fo − Fc map and the Polder map are 2.56 and 2.48 Å, respectively, which are consistent to 2.51 Å of the Fo − Fc map (Fig. 8A). These two maps ensure the successful determination of the Fo − Fc map given in Fig. 8A.
The stable water molecule bridging the two propionate groups of heme a3 in the Fo − Fc map provides an excellent internal reference for quantification of the electron density of the ligands of the two metals (8–11). The peak heights of the internal reference water molecule, O1 and O2 for monomer A, were 1.21, 1.07, and 0.89 e/Å3, respectively. These heights for monomer B were 1.08, 1.05, and 0.87 e/Å3, respectively. These results indicate that overall ligand occupancies averaged for O1 and O2 were 0.81 and 0.89 for monomers A and B, respectively, giving the average value of 0.85. The incomplete ligand saturation in heme a3 is consistent with the average B-factor values for the pyrrole atoms of heme a3 (26.4 Å2) and significantly higher than those of heme a (23.5 Å2).
Occupancy of the oxygen-bound form (0.85) determined as above is identical with the content of the oxidized-type structure for residues 380–385 of subunit I (85%) determined by B-factor analysis as given in Fig. 6. This strongly suggests that the oxygen-bound form has the water channel in the closed state, because residues 380–385 in the oxidized-type structure close the water channel as described above. The absorption spectrum of the oxygen-bound form, as given in Fig. 2C, indicates that the oxygen-bound form includes the P-form and F-form in a roughly 1:1 ratio. These results prove crystallographically that both the P-form and the F-form have the water channel in the closed state.
Further structure refinements were performed using the occupancies of oxygen atoms, 0.80 and 0.90, for monomers A and B, respectively. The structure with ligand oxygen atoms was refined without any restraint for the oxygen atoms. The distances between the two ligand oxygen atoms were converged to 2.34 and 2.26 Å for monomers A and B, respectively. These distances are significantly longer than the O–O distance in a typical peroxide ion and shorter than the length of a low-barrier hydrogen bond between two oxygen atoms (21). Because the O–O distances suggest coexistence of multiple structures consisting of a low-barrier hydrogen bond and another structure, the structure with ligand oxygen atoms was refined under the restraint of an O–O distance = 2.50 Å, and the Fo − Fc map was calculated. A residual electron density peak is detectable at the site corresponding to the peroxide in the resting oxidized form (Fig. 8B). The peak heights at the peroxide ion and the water molecule bridging the two propionate groups are 0.23 and 1.22 e/Å3, respectively, for monomer A. Those for monomer B are 0.37 and 1.12 e/Å3, respectively. The peaks of both monomers are assignable as those of the peroxide ions of the resting oxidized form, with occupancies of 0.09 and 0.17 for monomers A and B, respectively. In further refinements, the occupancies of the peroxide oxygen atoms were fixed to 0.10 and 0.15 for the monomers A and B, respectively, and those of ligand oxygen atoms were fixed to 0.70 and 0.75, respectively. Peroxide structures of both monomers derived from the respective structures of the previous high-resolution structure (PDB code 5B1A) were not changed during the further refinements, as their positional parameters fluctuate due to the low occupancies. Structure refinement without any restraints on the ligand oxygen atoms of O1 and O2 converged to Fea3–O1 = 1.70 Å, CuB–O2 = 2.11 Å, and O1–O2 = 2.54 Å in their averaged values of two monomers. These values of the distances were used for the restraints of respective bonds in the final stage of the structure refinement to achieve convergence.
The percentages of the reduced-type structures indicated by the regions of residues 48–55 and 380–385 of subunit I and the hydroxyfarnesyl ethyl group of heme a were readjusted to 33, 15, and 33%, respectively, for monomer A, and 33, 18, and 35%, respectively, for monomer B. A final structure refinement with multiple structures for these three regions, two metal-liganded oxygen atoms and the two oxygen atoms of the peroxide anion converged well: Rwork = 0.1565; Rfree = 0.1884; RMSD (length) = 0.020 Å; and RMSD (angle) = 1.84°. The residual electron density at the peroxide site, as shown in Fig. 8B, disappeared.
Structural characteristics of the O2 reduction site
The structure of the O2-reduction site determined in these analyses is shown in Fig. 8C, which includes a schematic representation of the coordination geometry of the Fea3–CuB site in the inset. The distances and angles given are the averaged values among the two heme a3 structures in the asymmetric unit. The Fea3–O1 distance is 1.70 Å. The bond angle of N–Fe–O of His376–Fea3–O1 is 175.0°. The CuB–O2 distance of 2.11 Å indicates Cu2+–OH− coordination. The O1–O2 distance of 2.54 Å is shorter than the O–O distance of the standard hydrogen bond, indicating formation of a low-barrier hydrogen bond (22), where a hydrogen atom is dominantly located at the CuB side. The Fea3–CuB distance of 4.61 Å is the shortest distance between these ions measured to date in bovine CcO. Other distances include 4.83 Å in the resting oxidized crystal (PDB code 5B1A) and 5.11 Å in the fully-reduced crystal (PDB code 5B1B).
The Fea3–O1 distance of 1.70 Å is consistent with the bond length of Fe4+=O2−, and not of Fe4+–OH−, for the P-form and the F-form. Meharenna et al. (23) proposed an empirical equation relating elongation of the Fe–O distance and X-ray radiation dose, Δd = 0.2543 × Y, where Δd represents the elongation in Å, and Y represents the radiation dose in MGy. According to this equation, elongation of the length from the original F–O bond length by 0.04 Å would be caused by the low radiation dose of 0.17 MGy attainable under our experimental conditions. Thus, the Fea3–O1 length, 1.70 Å, suggests that the Fea3–O1 distance is 1.66 Å prior to X-ray irradiation. The distance is consistent with both Fe–O bond lengths of Fea34+ = O2−, 1.65 Å for the P-form and 1.66 Å for the F-form, estimated from the Fe–O stretching vibrations, 804 cm−1 for the P-form and 785 cm−1 for the F-form, using Badger's rule (24). Therefore, the X-ray crystal structural measurements provide strong evidence that the P-form and the F-form, identical to those under catalytic turnover (7), are generated in the crystals. It has been shown by the absorption and resonance Raman spectral analyses (12, 13) that this is also the case for the CcO in solution.
The absence of an H2O/D2O exchange effect on the resonance Raman band positions of the P-form and the F-form (25) is consistent with the absence of detectable levels of Fe4+–OH−, Fe3+–OH−, and Fe2+–OH−. Badger's rule (24) suggests that the reported longer Fe–O bonds between 1.81 and 1.92 Å for ferryl oxide intermediates of various oxygen-activating heme enzymes other than CcO are likely to be induced by X-ray irradiation damage (26)
Because the CuB site is essentially insensitive to resonance Raman excitation by visible laser light (1), the CuB2+–OH− structure had been a proposal until the present X-ray structural study. Furthermore, the present result is clearly inconsistent with ligation of H2O to CuB2+, as proposed previously (27).
Channel structures for entry of substrate (O2) and release of product (H2O)
The product (water)-releasing channel (blue) and the substrate (O2)-collection channel (orange), as shown in Fig. 9A, were identified using the program CAVER (28) and using a probe radius of 0.7 Å starting from the O2-reduction site. The cages with a cross-section diameter of 2.4 Å indicate locations, but not accessible surfaces. The residues surrounding the substrate (O2)-collection channel are hydrophobic except for Glu242 (Fig. 9B), whereas many polarized oxygen atoms, including those of the peptide carbonyls of Leu283, Ile286, Ala308, and Thr309, the hydroxyl groups of Tyr244, Tyr304, and Thr309, and heme a3 formyl, provide the product (water)-releasing channel with a highly-hydrophilic environment (Fig. 9C).
Figure 9.
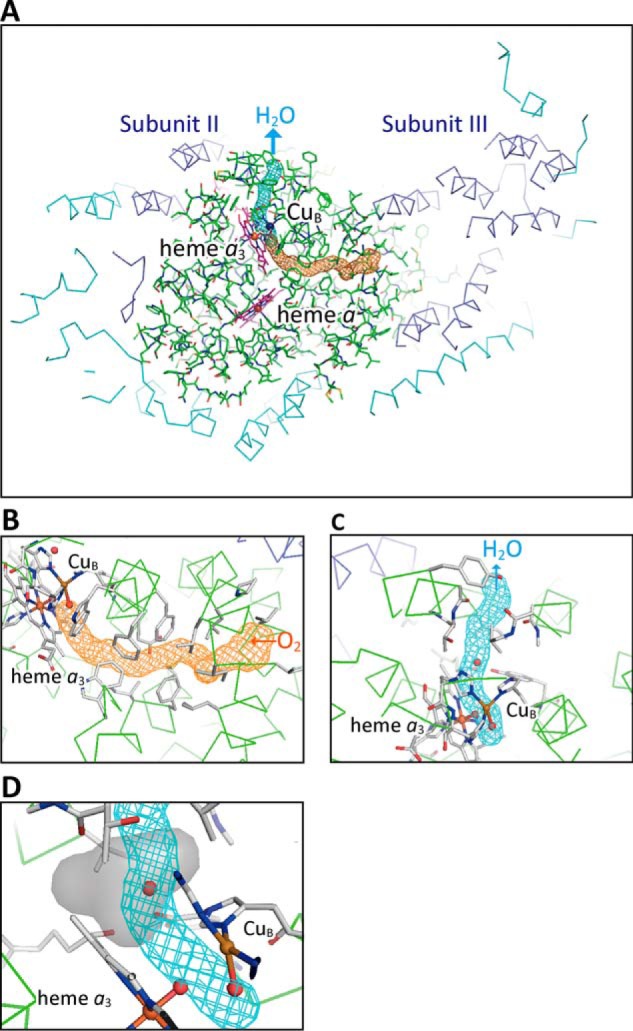
Structures of the substrate (O2) and product (H2O) channels and the accessible surface of the interstitial water molecule hydrogen-bonded to Tyr244. Both channels were identified using a probe radius of 0.7 Å, and their locations are shown as cages with a cross-section diameter of 2.4 Å, as drawn by the program CAVER. A, locations of the substrate (O2) and product (H2O) channels in bovine CcO. The subunit I structure of CcO is represented by green stick models, and the other subunit structures are shown as Cα-backbone traces. Subunits II (two transmembrane helices) and III (seven transmembrane helices) colored in cyan are located on the left and right sides of subunit I, respectively. The other subunits encoded by nuclear DNA are colored in blue. The brown spheres are iron ions; the violet sphere is copper ion. The porphyrins are colored in magenta. The orange cage shows the location of the substrate (O2) inlet channel from the O2 pool in a space in subunit III surrounded by the seven transmembrane helices. The three phospholipid molecules that are known to be present in this space are omitted to preserve clarity. The blue cage denotes the location of the product (H2O)-releasing channel from the O2-reduction site to the transmembrane surface of subunit I. B, magnified view of the substrate channel. Cα-backbone traces of the subunit I are shown in green. Heme a3 and CuB, together with their ligand residues, and residues surrounding the O2 pathway are depicted as stick models; carbon atoms are gray; nitrogen atoms are blue, and oxygen atoms are red. C, close-up view of the product channel. The structure surrounding the channel is depicted as in B. The interstitial water molecule interacting with Tyr244 via a hydrogen bond is in the channel. D, close-up view of the structure, including the water molecule hydrogen-bonded to Tyr244 in the product (H2O) channel. The gray surface structure generated with a probe radius of 1.2 Å with the program VOIDOO (30) shows the accessibility of the water molecule.
The location of the open end of the product (water)-releasing channel in the transmembrane region (Fig. 9, A and C) suggests that there is effective blockage preventing back-leakage of protons from the outside of the CcO molecule. The substrate (O2)-collection channel extends from the O2-reduction site to the open end facing the O2 pool surrounded by the seven transmembrane helices of subunit III (Fig. 9A). This is consistent with the structure reported previously (29). These channel structures suggest that O2 is transferred through the substrate (O2)-collection channel to the O2-reduction site, not through the product (water)-releasing channel, and that the water molecules produced at the O2-reduction site are released to the transmembrane surface via the product (water)-releasing channel. This proposal is consistent with the observation that blockage of the substrate (O2)-collection channel by N,N′-dicyclohexylcarbodiimide completely inhibits enzyme activity (29).
An interstitial water molecule hydrogen-bonded to Tyr244 in the O2-reduction site is detectable in the refined structure (Fig. 8C). It is located in the water-releasing channel (Fig. 9, C and D). Fig. 9D shows a close-up view of the water molecule that indicates an accessible surface when the water molecule is released from Tyr244. This model was generated with a probe radius of 1.2 Å with the program VOIDOO (30). The accessible surface indicates that the closest distances of the oxygen atoms of Fea34+=O2− (O1) and CuB2+–OH− (O2) from the surface are 2.7 and 4.3 Å, respectively.
Discussion
X-ray structures of the O2 reduction site suggest rapid degradation of the peroxide-bound intermediate prior to formation of the P-form
The existence of the peroxide-bound form as an intermediate preceding the P-form was recently proposed based on experimental and computational studies of a bacterial CcO (31). In the intermediate preceding the P-form, it is likely that the two oxygen atoms of the bridging O22− are located quite close to the two oxide ions, O1 and O2, in the X-ray structure of the P-form. The accessible surface of the interstitial water molecule described above (Fig. 9D) indicates that the interstitial water molecule is more readily accessed by O1 (the oxygen atom bound to Fea3) than by O2 (the oxygen atom bound to CuB). Thus, the structure strongly suggests that the interstitial water molecule identified in the P/F mixture triggers a facile proton transfer from Tyr244 to the peroxide–oxygen bound to Fea33+, coupled with an electron transfer from Tyr244–OH (or −O−) to the peroxide–oxygen bound to CuB2+ via His240, which is cross-linked to Tyr244. Protonation of the peroxide–oxygen bound to Fea33+, and not the peroxide–oxygen bound to CuB2+, would be critical for facile oxidation of the stable Fea33+ to yield the high-oxidation state heme iron, Fea34+. The proton-coupled electron transfers provide CuB2+–O2−, Fea34+–OH−, and Tyr244–O• radical followed by a proton exchange between two oxides through the low-barrier hydrogen bond to yield CuB2+–OH− and Fea34+=O2−, as schematically shown in Fig. 1A.
The highly-conserved cross-linkage between Tyr244 and His240 supports this proton-coupled electron transfer (1, 32). The low-barrier hydrogen bond (22) between O1 and O2 in the P-form provides a stable ligand-binding arrangement between CuB2+ and Fea33+ upon generation of the P-form from the peroxide-bound intermediate with minimal structural change. This arrangement could also contribute to the rapid and facile degradation of the bound peroxide.
The reported X-ray structure of CO-bound CcO shows that an interaction between CuB1+ and the oxygen atom of the bound CO is significantly weaker than the interaction between the carbon atom of CO and Fea32+ (1, 9). This structure indicates uneven coordination of O2 to the O2-reduction site, which would significantly lower the rate of the second electron donation to the bound O2 from CuB1+, thereby providing a slow two-electron reduction of O2 to peroxide. The first electron is transferred from Fea32+, giving Fea33+–O2−, when O2 is bound to Fea32+ (7, 33).
The existence of the interstitial water molecule detectable in the intermediate species, together with the uneven coordination of O2 between Fea32+ and CuB1+, strongly suggests that rapid degradation of the peroxide-bound form induces formation of Fea33+–O2− and Fea34+=O2− as the first and second intermediates, respectively (7). This X-ray structural finding is a crucial structural result for resolving the enigma, namely stable Fea33+–O2− and unstable Fea33+–O−–O−–CuB2+, identified by the resonance Raman analysis long before (7).
It is possible that this water molecule is introduced along with binding of O2 to Fea32+, which provides a negatively-charged ligand-bound state, Fea33+–O2−. This state is similar to CN−-bound fully-reduced CcO (9). In most oxygenated (or O2-bound) hemoproteins, Fe2+–O2 is in a resonance structure between Fe2+–O2 and Fe3+–O2−. IR results suggest that the latter is predominant (1, 33).
X-ray structural basis for the resonance Raman data obtained for the ferryl site
The P-form has two resonance Raman bands at 804 and at 350 cm−1, which are assignable to Fea34+=O2− vibrational and HisN–Fea34+=O2−-bending modes, respectively (34). Our X-ray structure indicates that HisN–Fea34+=O2− has an angle of 175.0° confirming the above spectroscopic assignment nonempirically. The absorption spectrum of the crystals in Fig. 2C indicates that this X-ray structure is a mixture of the P- and F-form. Thus, the HisN–Fea34+=O2− angle of the P-form is likely to be narrower than 175.0°, because HisN–Fea34+=O2− of the F-form is straight, as evidenced by the lack of a resonance Raman bending mode.
Although the resonance Raman stretch band shift from 804 to 785 cm−1 upon the P-to-F transition was discovered fairly long time ago (1, 7), the structural base for the spectral change has not been identified. The Fe–O bond length difference of 0.011 Å (1.647 Å versus 1.658 Å for the P- and F-form), estimated by Badgers' rule from the stretching vibrational band positions of the P- and F-forms (804 and 785 cm−1), is too small to be identified in the X-ray structures at the present resolution. However, the existence of the low-barrier hydrogen bond between Fea34+=O2− and CuB-OH− identified in this work suggests that CuB, which is coordinated with His240 cross-linked to Tyr244, controls the vibrational properties of Fea34+=O2 by coordination state change in CuB induced by hydrogenation of Tyr244–O• radical to Tyr244-OH, coupled with the P-to-F transition. The coordination state change in CuB could also eliminate the nonstraight structure of His–N–Fea34+=O2− of the P-form upon transition to the F-form via the tight hydrogen bond.
The present findings as described above suggest an O2-reduction mechanism summarized schematically in Fig. 10. When the O2-reduction site is in the fully-reduced state (Fig. 10A), O2 is collected through the O2 channel to form Fea33+–O2−. The negatively-charged O2 molecule collects the interstitial H2O molecule (Fig. 10B). The rather slow electron transfer from CuB to the bound O2 generates the peroxide-bridged form (Fig. 10C). Immediately after formation of the peroxide-bridged form, the interstitial water molecule mediates the transfer of a proton from Tyr244–OH to the oxygen bound to Fea33+, concomitant with electron transfer from Tyr244-O− to CuB2+ via His240 cross-linked to Tyr244 (Fig. 10, D and E). The two electrons from CuB1+ and Fea33+ reduce the bound O22− to break the O–O bond (Fig. 10F). Facile proton exchange through the low-barrier hydrogen bond between the two oxides yields the P-form (Fig. 10G). The P-to-F transition, coupled with elimination of the bent structure of HisN–Fea34+=O2− and the bending mode and the shift in the stretching band of Fea34+=O2−, is induced by CuB coordination state change triggered by reduction and protonation of the Tyr244 radical to form Tyr244–OH (34).
Figure 10.

Schematic representation of an O2-reduction process from the R-form to the F-form, derived from the present results. When the fully-reduced form (R-form) is attained (A), Fea32+ receives O2 to yield the Fea33+–O2− (B). The O2-bound form is in equilibrium between Fe2+–O2 and Fe3+–O2−, as described in the text. The predominant form is included here. The negatively-charged O2 at Fea3 collects H2O (B). The weak interaction between CuB and bound O2− results in a rather slow formation of the peroxide-bridged form (C). Immediately after the peroxide-bound form is attained, the interstitial H2O, hydrogen-bonded to Tyr244, takes up protons from Tyr244–OH and forms a hydronium ion that interacts with an oxygen atom of the bound peroxide (D). Water accessibility, as shown in Fig. 10D, strongly suggests the preference for proton transfer to the oxygen bound to Fea33+ versus the oxygen at CuB (D). Concomitant with the proton transfer, a facile electron transfer takes place from Tyr–O− to CuB via His240 (E). The resultant structure (E) triggers a simultaneous two-electron reduction of the bound peroxide from both Fea33+ and CuB1+, thereby breaking the O–O bond (F) to form the low-barrier hydrogen bond that induces an angled O=Fe–N structure, followed by a proton exchange between the two oxide ions, yielding the P-form (G). The F-form is produced by a proton-coupled reduction of the oxyradical of the P-form, perturbing the low-barrier hydrogen bond and yielding a straight O=Fe–N structure (H).
X-ray structures of the water channel of the P- and F-forms facilitating unidirectional proton-transport through the H-pathway
The unidirectional proton-transfer mechanism facilitated by narrowing the water channel of the H-pathway has been proposed by comparison of the X-ray structures of the resting oxidized and fully-reduced CcOs as mentioned in the Introduction. These X-ray structures indicate that the open/closed structural changes in the water channel of the H-pathway are controlled by the ligand-binding and oxidation states of the O2-reduction site. However, these two forms are not directly involved in the catalytic cycle. The ligand-binding and oxidation states of the resting oxidized form, Fea33+–O22−, are definitely different from those of the P- and F-forms, Fea34+=O2− (1, 7, 14). Furthermore, the resting oxidized CcO does not pump protons (1, 35). Therefore, the resting oxidized form is not an appropriate model for either the P- or F-forms. Thus, the present results, showing that the water channel is closed in both the P- and F-forms, are one of the critical experimental confirmations for the unidirectional proton-transfer mechanism. The closed structure of the water channel of the P- and F-forms can provide complete blockage of proton back-leakage without any extra energy cost in the proton pump during the P-to-F transition.
Resonance Raman results indicate that the Fea33+–OH− species of the O-form is in the low-spin state (34), whereas the resting oxidized form has Fea33+– O22− in the high-spin state. The results of a single-electron injection technique applied to the O-form has led to the proposal that the E-form has a low-spin Fea33+–OH− species and a CuB1+species (35). It has been shown recently that CuB is also involved in the open to closed transition of the water channel (19). Because the structures of the O2-reduction site of the O- and E-forms are significantly different from the structure of the resting oxidized form, the resting oxidized form cannot be an appropriate model also for the O- and E-forms. X-ray structural analyses for these intermediates are prerequisite for evaluation of the mechanism of the unidirectional proton transfer in steps other than the P-to-F step (F → O → E → R).
Recently, an XFEL analysis at 2.5 Å resolution for the process of O2 reduction by fully-reduced bovine heart CcO was reported, showing an intermediate species 8 s after mixing the fully-reduced CcO microcrystals with O2 (36). Both of the bond distance sets for Fea3–O/CuB–O as 1.70/1.86 Å and 1.91/2.46 Å are allowable in the observed electron density of this intermediate species (36). Although the intermediate was assigned as “Pr” (a one-electron reduced form of P) (36), the two ligand oxygen atoms were not located due to the low resolution of the X-ray diffraction data. Significant improvements in the resolution of the XFEL analysis, for which improvements in crystallization conditions appear to be most critical, are necessary for direct comparison of our static X-ray structures of the intermediate species at 1.8 Å resolution with the time-resolved results. A brief discussion on an alternative proton-pumping mechanism proposed for bacterial CcO (1, 2, 37) is given in text S3.
Experimental procedures
Preparation of H2O2-treated CcO crystals
Resting oxidized bovine heart CcO crystals were prepared as described previously (38). The final medium composition was achieved with 50 stepwise manual exchanges from the initial medium composed of 40 mm sodium phosphate buffer, pH 6.5, 0.2% decylmaltoside, 1% PEG 4000, and 2% ethylene glycol in which the crystals are stable at 4 °C. Before freezing, the crystals were treated with appropriate concentrations of H2O2 and PMS in the final medium. The absorption spectral changes were followed after treatment as previously described (14). When no further significant absorbance increase at 580 nm was detectable, the crystals were frozen at 90 K in 40 mm sodium phosphate buffer, pH 5.7, 0.2% decylmaltoside, 8% PEG 4000, and 40% ethylene glycol.
Spectra of the frozen crystals were acquired under N2 flow at 100 K in a micro-loop for X-ray diffraction experiments. A white-light microbeam was irradiated vertically onto the square board plane of the crystal. Although a minimal amount of the mother liquor of the frozen crystal induces significant curvature in the baseline of the absorbance measurement (Fig. 2C), reproducible measurements sufficient for quantitative evaluation of the relative content of the intermediate forms were achieved by controlling the angles of the measuring beam relative to the square board plane of the crystal.
To maintain integrity of the crystals, lower concentrations of H2O2 and PMS are preferable because both PMS and H2O2 could cause deterioration of the protein moiety. However, concentrations of 50 mm H2O2 and 50 μm PMS were selected to minimize contamination of X-ray diffraction data by the resting oxidized form. PMS does not produce significant interference in absorption spectral measurements between 500 and 700 nm under the present experimental conditions.
X-ray diffraction experiments
A total of 1235 images were obtained from 17 crystals. Overall averaged cell dimensions and their estimated standard deviations (e.s.d.s.), a = 177.28 Å (0.22 Å), b = 182.23 Å (0.31 Å), c = 204.76 Å (0.60 Å), are listed in Table S1 together with those of each crystal. Cell dimensions of a, b, and c range between 176.88 and 177.63 Å, 181.65 and 182.64 Å, and 203.34 and 205.45 Å, respectively, among 17 crystals. Statistics of cell dimensions suggest that these crystals are highly isomorphous with each other. Out of 1235 images, 897 images were selected to merge into a diffraction data set at 1.8 Å resolution. Averaged mosaicity and its e.s.d.s. estimated by the program SCALEPACK for 897 images were 0.189 and 0.052°, respectively. Rpim, I/Iσ(I) and CC1/2 of the highest resolution shell given in Table 1 indicate that the quality of intensity data are appropriate for structure analysis at 1.8 Å resolution.
Table 1.
Statistics of intensity data collection
| Space group | P212121 |
|---|---|
| Cell constants (Å) | a = 182.2, b = 204.7, c = 177.4 |
| No. of crystals | 17 |
| No. of images | 897 |
| Radiation dose (MGy) | 0.17 |
| Resolution (Å) | 136.1–1.8 (1.82–1.80)a |
| Observed reflections | 6,545,323 |
| Independent reflection | 606,209 (15,061) |
| Averaged redundancy | 10.8 (8.1) |
| Completeness (%) | 99.9 (99.8) |
| Rmerge | 0.101 (>1.0) |
| Rpim | 0.027 (0.409) |
| I/σ(I) | 38.5 (3.7) |
| CC1/2 | (0.877) |
a Numbers in parentheses are given for the highest-resolution shells.
The high yield of the purification method (about 1/2 g of the purified CcO from each batch of the purification (38)) and gradual (stepwise) manual soaking of the crystals with the medium containing a high concentration of the anti-freeze were found to be critical for providing crystals with high isomorphism as well as with low mosaicity.
All X-ray experiments were carried out at beamline BL44XU/SPring-8, which was equipped with an MX225HE CCD detector. Crystals with dimensions of ∼700 × 700 × 200 μm were used for diffraction experiments. For all diffraction experiments, the thin edge of a crystal was aligned parallel to the X-ray beam at a rotation angle of 0.0°. Each crystal was shot with X-rays in a helium gas stream at ∼50 K and translated by 10 μm after each shot to minimize radiation damage. Other experimental conditions used for collecting low-resolution data were as follows: X-ray beam cross-section, 25 μm (v) × 25 μm (h) at the crystal; X-ray attenuated by aluminum foil with 0.4-mm thickness; camera distance of 431 mm; exposure period of 1.0 s; and oscillation angle of 1.0°. The conditions for collecting high-resolution data were as follows: X-ray beam cross-section of 150 μm (v) × 25 μm (h) at the crystal, camera distance of 230 mm, exposure period of 1.0 s, and oscillation angle of 0.5°. The wavelength was 0.9 Å, and the photon number at the sample position was 4.0 × 10¹¹ photons/s. A total of 17 crystals were used to acquire full data sets at resolutions of 1.8 Å. The radiation dose for each diffraction experiment was estimated using the program RADDOSE (39). Data processing and scaling were carried out using HKL2000 and SCALEPACK (40). A total of 897 images were successfully processed and scaled. Structure factor amplitudes (|F|) were calculated using the CCP4 program TRUNCATE (41–44). Other statistics from the intensity data are provided in Table 1.
Structure determinations and refinements
Initial phases of the structural factors up to a resolution of 5.0 Å were calculated by the MR method (45) using a model built from a resting oxidized structure previously determined at 1.5 Å resolution (PDB code 5B1A) after removing nonprotein molecules, including water molecules, lipids, and detergents. The phases were extended to a resolution of 1.80 Å by DM (46) coupled with noncrystallographic symmetry averaging (NCS) (47, 48) using the CCP4 program DM (49).
An outline of our calculation procedure for MR/DM electron density maps is as follows: electron density distributions at the low resolution were modified by flattening those of the solvent region, idealizing electron density distribution (46), and averaging those related by NCS (47, 48). Phases of reflections slightly higher than the reflections used for the electron density calculation were estimated by Fourier transform of the modified electron densities. The phases were gradually extended to a resolution of 1.80 Å by repeating the density modification (DM) procedure, using the CCP4 program DM (49). The Fo data of the reflections ranging from 131.6 Å resolution to 1.80 Å resolution were used for MR/DM electron density calculation. The low resolution Fo data down to 131.6 Å resolution ensures high convergency of phase extension in the DM procedure. Flattening of electron densities of solvent regions as high as 70% volume of the unit cell estimated by Matthews (50) and a local 2-fold symmetry averaging in the DM procedure were performed for efficient elimination of initial model bias.
The resultant phases (αMR/DM) were used to calculate the electron density map (MR/DM map) with Fourier coefficients |Fo|exp(iαMR/DM), where |Fo| is the amplitude of the observed structure factor. A structural model of oxidized CcO previously determined at 1.5 Å resolution (11) was revised on the MR/DM map. Refinement was carried out using phenix.refine (51). The phenix refinement was performed without simulated annealing procedure unless otherwise stated. Model building was performed using COOT (52). An asymmetric unit of the unit cell contains two monomers of A and B, each consisting of 13 different protein subunits. Each monomer in the asymmetric unit, related by NCS, was assigned to a single group for TLS refinement. The anisotropic temperature factors for the zinc, copper, iron, and magnesium atoms were imposed on the calculated structure factors. Molecules of water, ethylene glycol, lipids, and detergents were located on the MR/DM map and Fo − Fc maps composed of the phases calculated using atomic parameters of protein atoms and cofactors. Refinement statistics are listed in Table 2.
Table 2.
Structure refinement statistics
| Resolution (Å) | 39.876–1.800 (1.864–1.800)a |
|---|---|
| No. of reflections in work set | 604,926 (59,794) |
| No. of reflections in test set | 30,338 (2,970) |
| Rwork (%) | 15.65 (23.95) |
| Rfree (%) | 18.84 (26.84) |
| No. of on-hydrogen atoms | |
| Total | 34,360 |
| Proteins | 29,169 |
| Lipids | 1,608 |
| Detergents | 747 |
| Water | 2,498 |
| Ethylene glycol | 320 |
| Phosphate | 10 |
| Ligands (oxygen, peroxide) | 8 |
| RMSD | |
| Bonds (Å) | 0.020 |
| Angles (°) | 1.84 |
| Ramachandran statistics | |
| Favored (%) | 96.91 |
| Allowed (%) | 2.73 |
| Outliers (%) | 0.37 |
| Clashscore | 8.79 |
| Average B-factor (Å2) | |
| Overall | 47.8 |
| Protein (monomer A) | 41.1 |
| Protein (monomer B) | 47.2 |
| Others | 68.1 |
a Numbers in parentheses are given for the highest-resolution shells.
Author contributions
A. Shimada, E. Y., K. M., T. T., and S. Y. conceptualization; A. Shimada, Y. E., R. K.-F., K. S.-I., E. Y., K. M., T. T., and S. Y. resources; A. Shimada, Y. E., R. K.-F., A. Sasaki, K. S.-I., E. Y., K. M., T. T., and S. Y. data curation; A. Shimada, T. H., E. Y., K. M., and T. T. software; A. Shimada, Y. E., R. K.-F., A. Sasaki, T. H., E. Y., K. M., T. T., and S. Y. formal analysis; A. Shimada, K. S.-I., K. M., T. T., and S. Y. supervision; A. Shimada, K. S.-I., K. M., T. T., and S. Y. funding acquisition; A. Shimada, Y. E., T. H., E. Y., K. M., T. T., and S. Y. validation; A. Shimada, Y. E., R. K.-F., A. Sasaki, K. S.-I., T. H., E. Y., K. M., T. T., and S. Y. investigation; A. Shimada, Y. E., R. K.-F., A. Sasaki, T. H., E. Y., K. M., and T. T. visualization; A. Shimada, Y. E., R. K.-F., A. Sasaki, K. S.-I., T. H., E. Y., K. M., T. T., and S. Y. methodology; A. Shimada, T. T., and S. Y. writing-original draft; A. Shimada, T. T., and S. Y. project administration; T. H., K. M., T. T., and S. Y. writing-review and editing.
Supplementary Material
Acknowledgments
We thank Minoru Kubo for careful critical reading of this article. Diffraction data were collected at BL44XU beamline in SPring-8 under proposals 2014A6500, 2014B6500, 2015A1095, 2015A6500, 2015B6500, 2016A6500, and 2016B6500.
This work was supported by Grant-in-aid for the Global Center of Excellence Program for Scientific Research (A) 2247012 (to S. Y.), the Photon and Quantum Basic Research Coordinated Development Program (to T. T., S. Y., and K. S-I.) provided by the Japanese Ministry of Education, Culture, Sports, Science and Technology; JSPS KAKENHI Grants 22370060 (to K. M.), 26291033 (to S. Y.), 15K18493 and 18K14635 (to A. S.), and 18K06092 (to T. T.); by JST, CREST, and the Targeted Proteins Research Program 12101577 (to T. T.); and by SPring-8 2015A1095 (to T. T.). The authors declare that they have no conflicts of interest with the contents of this article.
This article contains Figs. S1–S3, Table S1, Text S1–S3, and supporting Refs. 1–15.
The atomic coordinates and structure factors (code 6JUW) have been deposited in the Protein Data Bank (http://wwpdb.org/).
- CcO
- cytochrome c oxidase
- heme a and heme a3
- low- and high-spin heme a molecules of CcO, respectively
- Fea3
- iron ions of heme a and heme a3, respectively
- CuA and CuB
- low- and high-potential copper sites of CcO, respectively
- PDB
- Protein Data Bank
- MR
- molecular replacement
- DM
- density modification
- NCS
- noncrystallographic symmetry
- PMS
- phenazine methosulfate
- MGy
- megagray
- e.s.d.s.
- estimated standard deviation
- RMSD
- root mean square deviation.
References
- 1. Yoshikawa S., and Shimada A. (2015) Reaction mechanism of cytochrome c oxidase. Chem. Rev. 115, 1936–1989 10.1021/cr500266a [DOI] [PubMed] [Google Scholar]
- 2. Wikström M., Krab K., and Sharma V. (2018) Oxygen activation and energy conservation by cytochrome c oxidase. Chem. Rev. 118, 2469–2490 10.1021/acs.chemrev.7b00664 [DOI] [PMC free article] [PubMed] [Google Scholar]
- 3. Warburg O., Posener K., and Negelein E. (1924) Uber Eisen, den sauerstoffubertragenden bestandteil des qtmungsfermentes (iron and oxygen transporters of the respiratory system). Biochem. Z. 152, 479–494 [Google Scholar]
- 4. Bloch D., Belevich I., Jasaitis A., Ribacka C., Puustinen A., Verkhovsky M. I., and Wikström M. (2004) The catalytic cycle of cytochrome c oxidase is not the sum of its two halves. Proc. Natl. Acad. Sci. U.S.A. 101, 529–533 10.1073/pnas.0306036101 [DOI] [PMC free article] [PubMed] [Google Scholar]
- 5. Caughey S. W., Wallace J. W., Volpe A. J., Yoshikawa S. (1976) in The Enzymes (Boyer P. D., ed) Vol. 13, 3rd Ed, pp. 299–344, Academic Press, New York [Google Scholar]
- 6. Dodson E. D., Zhao X. J., Caughey W. S., and Elliott C. M. (1996) Redox-dependent interactions of the metal sites in carbon monoxide-bound cytochrome c oxidase monitored by infrared and UV/visible spectroelectrochemical methods. Biochemistry 35, 444–452 10.1021/bi951313n [DOI] [PubMed] [Google Scholar]
- 7. Ogura T., Takahashi S., Hirota S., Shinzawa-Itoh K., Yoshikawa S., Appelman E. H., and Kitagawa T. (1993) Time-resolved resonance Raman elucidation of the pathway for dioxygen reduction by cytochrome c oxidase. J. Am. Chem. Soc. 115, 8527–8536 10.1021/ja00072a002 [DOI] [Google Scholar]
- 8. Tsukihara T., Shimokata K., Katayama Y., Shimada H., Muramoto K., Aoyama H., Mochizuki M., Shinzawa-Itoh K., Yamashita E., Yao M., Ishimura Y., and Yoshikawa S. (2003) The low-spin heme of cytochrome c oxidase as the driving element of the proton-pumping process. Proc. Natl. Acad. Sci. U.S.A. 100, 15304–15309 10.1073/pnas.2635097100 [DOI] [PMC free article] [PubMed] [Google Scholar]
- 9. Muramoto K., Ohta K., Shinzawa-Itoh K., Kanda K., Taniguchi M., Nabekura H., Yamashita E., Tsukihara T., and Yoshikawa S. (2010) Bovine cytochrome c oxidase structures enable O2 reduction with minimization of reactive oxygens and provide a proton-pumping gate. Proc. Natl. Acad. Sci. U.S.A. 107, 7740–7745 10.1073/pnas.0910410107 [DOI] [PMC free article] [PubMed] [Google Scholar]
- 10. Shimada A., Hatano K., Tadehara H., Yano N., Shinzawa-Itoh K., Yamashita E., Muramoto K., Tsukihara T., and Yoshikawa S. (2018) X-ray structural analyses of azide-bound cytochrome c oxidases reveal that the H-pathway is critically important for the proton-pumping activity. J. Biol. Chem. 293, 14868–14879 10.1074/jbc.RA118.003123 [DOI] [PMC free article] [PubMed] [Google Scholar]
- 11. Yano N., Muramoto K., Shimada A., Takemura S., Baba J., Fujisawa H., Mochizuki M., Shinzawa-Itoh K., Yamashita E., Tsukihara T., and Yoshikawa S. (2016) The Mg2+-containing water cluster of mammalian cytochrome c oxidase collects four pumping proton equivalents in each catalytic cycle. J. Biol. Chem. 291, 23882–23894 10.1074/jbc.M115.711770 [DOI] [PMC free article] [PubMed] [Google Scholar]
- 12. Jünemann S., Heathcote P., and Rich P. R. (2000) The reactions of hydrogen peroxide with bovine cytochrome c oxidase. Biochim. Biophys. Acta 1456, 56–66 10.1016/S0005-2728(99)00105-X [DOI] [PubMed] [Google Scholar]
- 13. Proshlyakov D. A., Ogura T., Shinzawa-Itoh K., Yoshikawa S., and Kitagawa T. (1996) Microcirculating system for simultaneous determination of Raman and absorption spectra of enzymatic reaction intermediates and its application to the reaction of cytochrome c oxidase with hydrogen peroxide. Biochemistry 35, 76–82 10.1021/bi9511705 [DOI] [PubMed] [Google Scholar]
- 14. Aoyama H., Muramoto K., Shinzawa-Itoh K., Hirata K., Yamashita E., Tsukihara T., Ogura T., and Yoshikawa S. (2009) A peroxide bridge between Fe and Cu ions in the O2 reduction site of fully oxidized cytochrome c oxidase could suppress the proton pump. Proc. Natl. Acad. Sci. U.S.A. 106, 2165–2169 10.1073/pnas.0806391106 [DOI] [PMC free article] [PubMed] [Google Scholar]
- 15. Zaugg W. S. (1964) Spectroscopic characteristics and some chemical properties of N-methylphenazinium methyl sulfate (phenazine methosulfate) and pyocyanine at the semiquidnoid oxidation level. J. Biol. Chem. 239, 3964–3970 [PubMed] [Google Scholar]
- 16. Ksenzenko M. Yu, Vygodina T. V., Berka V., Ruuge E. K., and Konstantinov A. A. (1992) Cytochrome oxidase-catalyzed superoxide generation from hydrogen peroxide. FEBS Lett. 297, 63–66 10.1016/0014-5793(92)80328-E [DOI] [PubMed] [Google Scholar]
- 17. Pecoraro C., Gennis R. B., Vygodina T. V., and Konstantinov A. A. (2001) Role of the K-channel in the pH-dependence of the reaction of cytochrome c oxidase with hydrogen peroxide. Biochemistry 40, 9695–9708 10.1021/bi010115v [DOI] [PubMed] [Google Scholar]
- 18. Hodel A., Kim S. H., and Brünger A. T. (1992) Model bias in macromolecular crystal structures. Acta Crystallogr. Sect. A 48, 851–858 10.1107/S0108767392006044 [DOI] [Google Scholar]
- 19. Shimada A., Kubo M., Baba S., Yamashita K., Hirata K., Ueno G., Nomura T., Kimura T., Shinzawa-Itoh K., Baba J., Hatano K., Eto Y., Miyamoto A., Murakami H., Kumasaka T., et al. (2017) A nanosecond time-resolved XFEL analysis of structural changes associated with CO release from cytochrome c oxidase. Sci. Adv. 3, e1603042 10.1126/sciadv.1603042 [DOI] [PMC free article] [PubMed] [Google Scholar]
- 20. Liebschner D., Afonine P. V., Moriarty N. W., Poon B. K., Sobolev O. V., Terwilliger T. C., and Adams P. D. (2017) Polder maps: improving OMIT maps by excluding bulk solvent. Acta Crystallogr. D Struct. Biol. 73, 148–157 10.1107/S2059798316018210 [DOI] [PMC free article] [PubMed] [Google Scholar]
- 21. Cleland W. W., Frey P. A., and Gerlt J. A. (1998) The low-barrier hydrogen bond in enzymatic catalysis. J. Biol. Chem. 273, 25529–25532 10.1074/jbc.273.40.25529 [DOI] [PubMed] [Google Scholar]
- 22. Kumara Swamy K. C., Kumaraswamy S., and Kommana P. (2001) Very strong C-H···O, N-H···O, and O-H····O hydrogen bonds involving a cyclic phosphate. J. Am. Chem. Soc. 123, 12642–12649 10.1021/ja010713x [DOI] [PubMed] [Google Scholar]
- 23. Meharenna Y. T., Doukov T., Li H., Soltis S. M., and Poulos T. L. (2010) Crystallographic and single-crystal spectral analysis of the peroxidase ferryl intermediate. Biochemistry 49, 2984–2986 10.1021/bi100238r [DOI] [PMC free article] [PubMed] [Google Scholar]
- 24. Green M. T. (2006) Application of Badger's rule to heme and non-heme iron–oxygen bonds: an examination of ferryl protonation states. J. Am. Chem. Soc. 128, 1902–1906 10.1021/ja054074s [DOI] [PubMed] [Google Scholar]
- 25. Ogura T., Hirota S., Proshlyakov D. A., Shinzawa-itoh K., Yoshikawa S., and Kitagawa T. (1996) Time-resolved resonance Raman evidence for tight coupling between electron transfer and proton pumping of cytochrome c oxidase upon the change from the Fe V oxidation level to the Fe IV oxidation level. J. Am. Chem. Soc. 118, 5443–5449 10.1021/ja951922i [DOI] [Google Scholar]
- 26. Behan R. K., and Green M. T. (2006) On the status of ferryl protonation. J. Inorg. Biochem. 100, 448–459 10.1016/j.jinorgbio.2005.12.019 [DOI] [PubMed] [Google Scholar]
- 27. Kaila V. R., Johansson M. P., Sundholm D., Laakkonen L., and Wiström M. (2009) The chemistry of the CuB site in cytochrome c oxidase and the importance of its unique His–Tyr bond. Biochim. Biophys. Acta 1787, 221–233 10.1016/j.bbabio.2009.01.002 [DOI] [PubMed] [Google Scholar]
- 28. Pavelka A., Sebestova E., Kozlikova B., Brezovsky J., Sochor J., and Damborsky J. (2016) CAVER: algorithms for analyzing dynamics of tunnels in macromolecules. IEEE/ACM Trans. Comput. Biol. Bioinforma. 13, 505–517 10.1109/TCBB.2015.2459680 [DOI] [PubMed] [Google Scholar]
- 29. Shinzawa-Itoh K., Aoyama H., Muramoto K., Terada H., Kurauchi T., Tadehara Y., Yamasaki A., Sugimura T., Kurono S., Tsujimoto K., Mizushima T., Yamashita E., Tsukihara T., and Yoshikawa S. (2007) Structures and physiological roles of 13 integral lipids of bovine heart cytochrome c oxidase. EMBO J. 26, 1713–1725 10.1038/sj.emboj.7601618 [DOI] [PMC free article] [PubMed] [Google Scholar]
- 30. Kleywegt G. J., and Jones T. A. (1994) Detection, delineation, measurement and display of cavities in macromolecular structures. Acta Crystallogr. D Biol. Crystallogr. 50, 178–185 10.1107/S0907444993011333 [DOI] [PubMed] [Google Scholar]
- 31. Poiana F., von Ballmoos C., Gonska N., Blomberg M. R. A., Ädelroth P., and Brzezinski P. (2017) Splitting of the O–O bond at the heme-copper catalytic site of respiratory oxidases. Sci. Adv. 3, e1700279 10.1126/sciadv.1700279 [DOI] [PMC free article] [PubMed] [Google Scholar]
- 32. Yoshikawa S., Shinzawa-Itoh K., Nakashima R., Yaono R., Yamashita E., Inoue N., Yao M., Fei M. J., Libeu C. P., Mizushima T., Yamaguchi H., Tomizaki T., and Tsukihara T. (1998) Redox-coupled crystal structural changes in bovine heart cytochrome c oxidase. Science 280, 1723–1729 10.1126/science.280.5370.1723 [DOI] [PubMed] [Google Scholar]
- 33. Potter W. T., Tucker M. P., Houtchens R. A., and Caughey W. S. (1987) Oxygen infrared spectra of oxyhemoglobins and oxymyoglobins. Evidence of two major liganded O2 structures. Biochemistry 26, 4699–4707 10.1021/bi00389a016 [DOI] [PubMed] [Google Scholar]
- 34. Kitagawa T., and Ogura T. (1997) in Progress in Inorganic Chemistry (Karlin K. D., ed) 45th Ed., pp. 431–479, John Wiley & Sons, Ltd., Chichester, UK: 10.1002/9780470166468.ch6 [DOI] [Google Scholar]
- 35. Belevich I., Bloch D. A., Belevich N., Wikström M., and Verkhovsky M. I. (2007) Exploring the proton pump mechanism of cytochrome c oxidase in real time. Proc. Natl. Acad. Sci. U.S.A. 104, 2685–2690 10.1073/pnas.0608794104 [DOI] [PMC free article] [PubMed] [Google Scholar]
- 36. Ishigami I., Lewis-Ballester A., Echelmeier A., Brehm G., Zatsepin N. A., Grant T. D., Coe J. D., Lisova S., Nelson G., Zhang S., Dobson Z. F., Boutet S., Sierra R. G., Batyuk A., Fromme P., Fromme R., et al. (2019) Snapshot of an oxygen intermediate in the catalytic reaction of cytochrome c oxidase. Proc. Natl. Acad. Sci. U.S.A. 116, 3572–3577 10.1073/pnas.1814526116 [DOI] [PMC free article] [PubMed] [Google Scholar]
- 37. Lepp H., Salomonsson L., Zhu J.-P., Gennis R. B., and Brzezinski P. (2008) Impaired proton pumping in cytochrome c oxidase upon structural alteration of the D pathway. Biochim. Biophys. Acta 1777, 897–903 10.1016/j.bbabio.2008.04.013 [DOI] [PMC free article] [PubMed] [Google Scholar]
- 38. Mochizuki M., Aoyama H., Shinzawa-Itoh K., Usui T., Tsukihara T., and Yoshikawa S. (1999) Quantitative reevaluation of the redox active sites of crystalline bovine heart cytochrome c oxidase. J. Biol. Chem. 274, 33403–33411 10.1074/jbc.274.47.33403 [DOI] [PubMed] [Google Scholar]
- 39. Zeldin O. B., Gerstel M., Garman E. F., and IUCr. (2013) RADDOSE-3D: time- and space-resolved modelling of dose in macromolecular crystallography. J. Appl. Crystallogr. 46, 1225–1230 10.1107/S0021889813011461 [DOI] [Google Scholar]
- 40. Otwinowski Z., and Minor W. (1997) Processing of X-ray diffraction data collected in oscillation mode. Methods Enzymol. 276, 307–326 10.1016/S0076-6879(97)76066-X [DOI] [PubMed] [Google Scholar]
- 41. French S., and Wilson K. (1978) On the treatment of negative intensity observations. Acta Crystallogr. Sect. A 34, 517–525 10.1107/S0567739478001114 [DOI] [Google Scholar]
- 42. Weiss M. S. (2001) Global indicators of X-ray data quality. J. Appl. Crystallogr. 34, 130–135 10.1107/S0021889800018227 [DOI] [Google Scholar]
- 43. Winn M. D., Ballard C. C., Cowtan K. D., Dodson E. J., Emsley P., Evans P. R., Keegan R. M., Krissinel E. B., Leslie A. G., McCoy A., McNicholas S. J., Murshudov G. N., Pannu N. S., Potterton E. A., Powell H. R., et al. (2011) Overview of the CCP4 suite and current developments. Acta Crystallogr. D Biol. Crystallogr. 67, 235–242 10.1107/S0907444910045749 [DOI] [PMC free article] [PubMed] [Google Scholar]
- 44. Collaborative Computational Project, No. 4. (1994) The CCP4 suite: programs for protein crystallography. Acta Crystallogr. D Biol. Crystallogr. 50, 760–763 10.1107/S0907444994003112 [DOI] [PubMed] [Google Scholar]
- 45. Rossmann M. G., and Blow D. M. (1962) The detection of subunits within the crystallographic asymmetric unit. Acta Crystallogr. 15, 24–31 10.1107/S0365110X62000067 [DOI] [Google Scholar]
- 46. Wang B. C. (1985) Resolution of phase ambiguity in macromolecular crystallography. Methods Enzymol. 115, 90–112 10.1016/0076-6879(85)15009-3 [DOI] [PubMed] [Google Scholar]
- 47. Bricogne G. (1974) Geometric sources of redundancy in intensity data and their use for phase determination. Acta Crystallogr. Sect. A 30, 395–405 10.1107/S0567739474010722 [DOI] [Google Scholar]
- 48. Bricogne G. (1976) Methods and programs for direct-space exploitation of geometric redundancies. Acta Crystallogr. Sect. A 32, 832–847 10.1107/S0567739476001691 [DOI] [Google Scholar]
- 49. Cowtan K. (1994) DM: an automated procedure for phase improvement by density modification. Jt. CCP4 ESF-EACBM Newsl. Protein Crystallogr. 31, 34–38 [Google Scholar]
- 50. Matthews B. W. (1968) Solvent content of protein crystals. J. Mol. Biol. 33, 491–497 10.1016/0022-2836(68)90205-2 [DOI] [PubMed] [Google Scholar]
- 51. Afonine P. V., Grosse-Kunstleve R. W., Echols N., Headd J. J., Moriarty N. W., Mustyakimov M., Terwilliger T. C., Urzhumtsev A., Zwart P. H., and Adams P. D. (2012) Towards automated crystallographic structure refinement with phenix.refine. Acta Crystallogr. Sect. D Biol. Crystallogr. 68, 352–367 10.1107/S0907444912001308 [DOI] [PMC free article] [PubMed] [Google Scholar]
- 52. Emsley P., Lohkamp B., Scott W. G., and Cowtan K. (2010) Features and development of Coot. Acta Crystallogr. D Biol. Crystallogr. 66, 486–501 10.1107/S0907444910007493 [DOI] [PMC free article] [PubMed] [Google Scholar]
- 53. Hirata K., Shinzawa-Itoh K., Yano N., Takemura S., Kato K., Hatanaka M., Muramoto K., Kawahara T., Tsukihara T., Yamashita E., Tono K., Ueno G., Hikima T., Murakami H., Inubushi Y., et al. (2014) Determination of damage-free crystal structure of an X-ray-sensitive protein using an XFEL. Nat. Methods. 11, 734–736 10.1038/nmeth.2962 [DOI] [PubMed] [Google Scholar]
Associated Data
This section collects any data citations, data availability statements, or supplementary materials included in this article.