Abstract
Background
Abnormal methylation is associated with the survival of colon cancer. This study intended to discover a significant model based on methylation-driven genes (MDGs) and screen relative risk loci to assist with determining the prognoses of colon cancer patients.
Methods
We downloaded transcriptome expression profiles and 450K methylation data from the TCGA database. We then collected the two normalized profiles and utilized the MethylMix package to identify a significant signature showing the aberrantly methylated events highly correlated with expression levels. Also, functional enriched pathway analysis based on the ConsensusPathDB database was conducted to further explore the underlying cancer-related crosstalk among the identified MDGs. To find the significant MDGs for prognosis, we applied a univariate Cox regression model, and the hub signature was identified based on the stepwise regression method. A risk model based on MDGs was constructed from the multivariate Cox analysis, and a receiver operating characteristic (ROC) curve was drawn to assess the predictive value of the MDG signature. Additionally, the Kruskal-Wallis (K-W) test was conducted to compare differential distributions of risk scores across groups of clinical variables. Furthermore, the methylation sites relating to the hub genes were screened out and the prognostic genes were searched using the Cox regression method. Last, we carried out gene set enrichment analysis (GSEA) with the risk score levels serving as the phenotype base on the JAVA platform.
Results
A total of 514 colon cancer samples with transcriptome profiles, including 473 tumor samples and 41 matched normal samples, were downloaded. We also obtained 351 methylation profiles comprising 314 tumor samples and 37 normal samples. The 320 MDGs identified by MethylMix were enriched in the generic transcription pathway, RNA polymerase II transcription, activation of SMO, or glutathione metabolism. Furthermore, a 10-MDGs signature was selected as the hub prognostic marker, and the risk model was constructed from the multivariate Cox regression results. We also discovered multiple specific methylated sites that were highly associated with survival. Finally, the GSEA results suggested that several enriched pathways were associated with the identified risk drivers, including extracellular matrix (ECM) receptor interaction, chemokine receptor interaction, and pathways in cancer, as well as calcium signaling pathways.
Conclusions
We conducted a comprehensive investigation of the molecular mechanisms in colon cancer by discovering the risk methylation-driven signature combined with relative methylated sites and constructing a risk model to predict prognosis.
Keywords: Colon cancer, methylation, biomarker, prognosis, high-throughput data
Introduction
Colon cancer, a highly common malignant tumor with a high mortality globally (1), arises from accumulated genetic and epigenetic alterations (2). Although a great number of studies have examined the progression of colon cancer, the exact mechanism underlying its pathogenesis remains unknown. DNA methylation can lead to epigenetic changes (3,4), in the transcription and expression of some specific genes, which contribute to colon carcinogenesis. DNA methylation in specific CpG islands has been proved to contribute to tumor initiation and progression (5,6). Therefore, detecting CpG island methylation in human DNA may hold promise in relation to early diagnosis of colon cancer (7,8). However, to the best of our knowledge, few studies have been conducted about methylated differentially expressed genes (MDEGs) across the whole genome and the prognoses of colon cancer patients (3,9).
For this study, we conducted an analysis based on high-dimensional data obtained from The Cancer Genome Atlas (TCGA) to compare colon cancer patients with healthy individuals, selected different methylation subtypes, and carried out an analysis on cis- and trans-regulation of DNA methylation and gene expression. Following this, we built a novel risk score system based on MDEGs that could predict patients’ prognoses and potentially inform a tailored course of colon cancer treatment. The hub genes related to prognosis were analyzed by the Cox regression method.
Methods
Data acquisition and reprocessing
The transcriptome data of 447 tumor samples were downloaded from TCGA database (https://portal.gdc.cancer.gov/) via GDC tool. Then, the normalization of expression profiles was conducted using edgeR package. Methylation data (of 295 tumor samples and 56 corresponding normal samples) based on the Illumina Infinium HumanMethylation450 platform were obtained via the TCGA-Assembler tool. The 450K methylation profiles contained comprehensive biological information, covering over 480K human genome methylated sites (10). We collected the methylation matrix, where the β value represented the ratio of the methylation probe data versus total probe intensities. The normalization was conducted using limma package and the average DNA methylation value for all CpG sites associated with a certain gene was estimated by TCGA-Assembler. In addition, we extracted the patients’ clinical information including age, gender, pathological stage, TNM stages and prognostic data. MethylMix, an algorithm implemented in R to identify disease specific hyper and hypomethylated genes was performed: First, the correlation cutoff value was defined as correlation coefficient =−0.3 with FDR =0.05 to identify significant methylation events that led to alterations in gene expression; Then, a β mixture model was established based on colon cancer samples to identify methylation states which were then compared with the normal DNA methylation state; Finally, the Wilcoxon rank-sum test was performed to compare the differential methylation levels in colon cancer and corresponding normal samples.
Differential analysis and enriched pathways for methylation-driven genes (MDGs)
MethylMix package was utilized to find differentially expressed signature related to methylated alterations and the cluster analysis of tumor and normal samples was performed using heatmap package. The ConsensusPathDB database, a comprehensive biological database for interaction networks, was used to estimate the enrichment pathways that the methylated drivers might participate in. Humancyc, Reactome, Kegg, Smpdb, Wikipathways, Signalink and Biocarta were used for enriched analysis with P=0.05 as the cutoff value.
Construction of MDGs risk score and associations with clinical variables
Univariate Cox regression was exploited to select the significant prognostic methylation signature associated with survival outcomes and P<0.05 was set as the cutoff value. Subsequently, multivariate Cox analysis was conducted to identify the hub MDGs via stepwise regression analysis, in which the optimal model was determined when the Akaike information criterion (AIC) reached the minimum value. Accordingly, we obtained the coefficient (β) of hub MDGs signature from the multivariate Cox results. Then, the MDGs risk score was calculated using the following formula: risk score = Ʃ (βi * Expi), in which Exp represented the expression value of signature and i meant the identified number of MDGs. Hence, the 447 patients were classified as high-risk or low-risk based on the median cutoff data. The receiver operating characteristic curve (ROC) was drawn by survival package to assess the predictive value of established MDGs risk score. Last, Kaplan-Meier analysis with log-rank test was used to compare the differential survival outcomes between high-risk and low-risk groups by survival package.
To further explore the underlying associations between MDGs risk score and clinical features, the clinical data from 447 patients in TCGA cohort were obtained and the risk score was merged with other risk variables, including AJCC-TNM stage and pathological stage. Wilcoxon rank-sum test was used to compare the difference between the two groups, while Kruskal-Wallis (K-W) test was suitable for evaluating the differential distributions of risk score across three or more groups.
Screening of risk methylated loci associated with overall survival (OS)
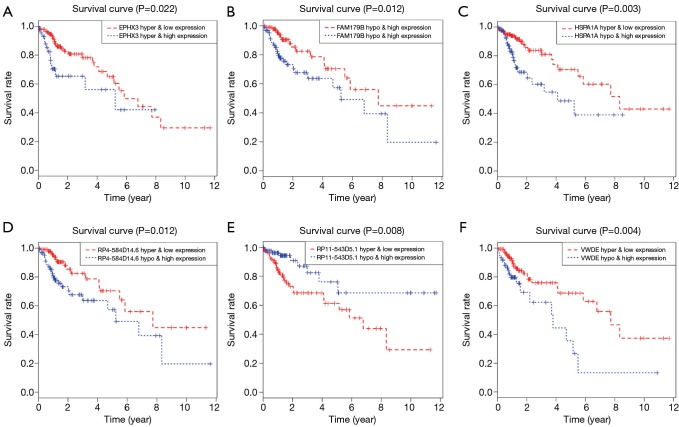
Since the hub MDGs signature has been identified, we detected the potential risk methylated sites. Using the Perl scripts, the methylation data associated with the hub MDGs signature were extracted and collected into one matrix. After integrating the survival information with the methylated value of loci, we conducted univariate Cox analysis to identify the risk loci. The survival analysis was also performed to assess the differential OS between hypo- and hypermethylation state of risk methylated sites (Figure 1). Last, we conducted a joint survival analysis combining the methylation level and corresponding expression data of one gene to determine the survival outcomes in colon cancer patients.
Figure 1.
Joint survival analysis consisted of methylation state and expression profiles for top 6 genes.
Gene set enrichment analysis (GSEA)
We downloaded the GSEA software from the GSEA home (http://software.broadinstitute.org/gsea/index.jsp) and ran it on the JAVA platform. The risk score based on MDGs was defined as the phenotype. Then, we obtained the “c2.cp.kegg.v6.2.symbols.gmt gene sets” the MSigDB (http://software.broadinstitute.org/gsea/downloads.jsp) database as the reference gene sets. Last, we set the false discovery rate (FDR) < 0.25 and |enriched score| > 0.35 as thresholds.
Statistical analysis
Cox regression model or Kaplan-Meier analysis were conducted by survival packages. Differential analysis was conducted by limma package. The Student’s t-test was chosen for continuous variables, while categorical variables were estimated by Chi-square test. Wilcoxon rank-sum test was used to compare the two groups and K-W test was probable for three or more groups. Correlation analysis was evaluated by Pearson coefficients. All statistical analyses were performed in R studio (version 3.5.2), and P<0.05 was defined as significant.
Results
Screening of methylation drivers in colon cancer
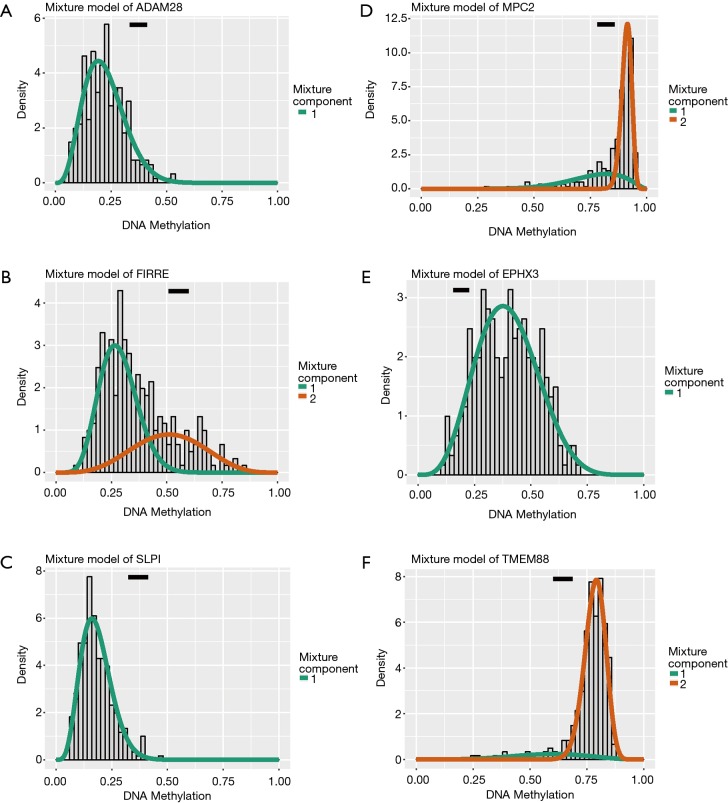
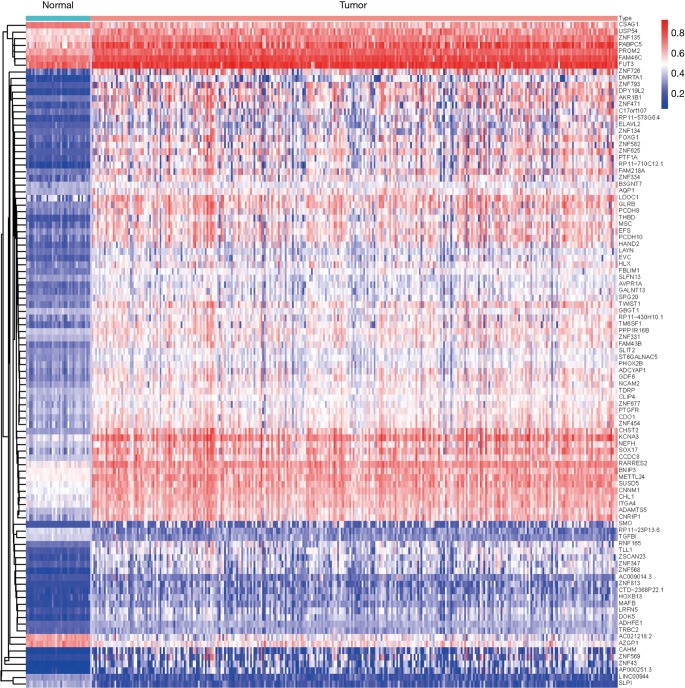
We obtained transcriptome expression profiles of 514 samples, including 473 tumor samples and 41 matched normal samples. The normalization process was then conducted, and 12,693 differentially expressed genes were identified based on the edgeR package with FDR <0.05. In addition, a total of 351 methylation profiles comprising 314 tumor samples and 37 normal samples were collected and normalized with the limma package. With the two prepared files of expression and methylation data, MethylMix was implemented to assess the correlations between methylation levels and abnormal gene expression (Figure S1). Additionally, we acquired 320 methylation drivers defined by |logFC| >0, |Cor| >0.3, and P<0.05 (http://cdn.amegroups.cn/static/application/44086414d60d8fd88778dbbb9d6c61a2/atm.2020.02.94-1.pdf). Since the mix models were established using MethlMix, we illustrate the top hyper and hypo-methylation of MDGs in Figure 2. The top 100 signatures are exhibited in Figure 3, where the heatmap reveals the differential methylated levels between tumor and normal samples. The specific clinical features of colon cancer patients are summarized in Table 1. The mean age was 67.23±13.00, and the percentage of males and females was 52.49% and 47.51, respectively.
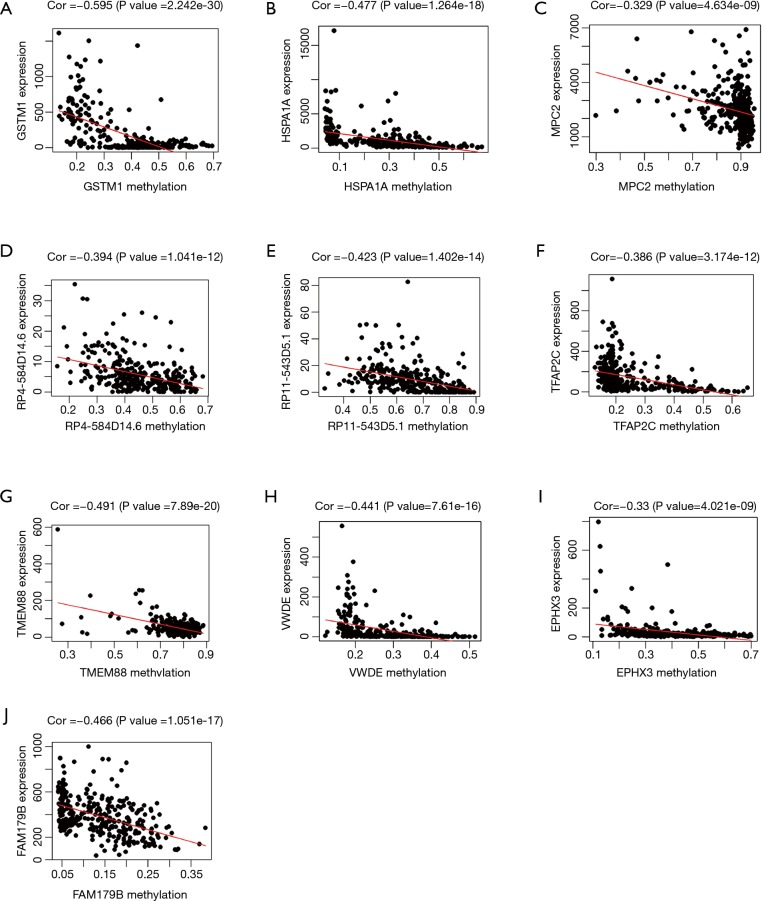
Figure S1.
Correlation between DNA methylation and gene expression in 10 hub signatures via Pearson correlation analysis.
Figure 2.
Mixture models established to search significant MDGs via MethylMix package. Methylation states of genes were exhibited in the histogram pot, where the histograms meant the tumor samples and black line represented the methylation level in normal samples. (A,B,C) Top three hypomethylated MDGs. (D,E,F) Top three hypermethylated MDGs.
Figure 3.
The top 100 MDGs were selected to reveal the differential distributions of methylated state by heatmap, in which alterations from hypomethylation to hypermethylation were illustrated by colors ranging from blue to red.
Table 1. Clinical features of all eligible 461 patients with colon cancer from TCGA included in this study.
| Variables | Count |
|---|---|
| Status | |
| Alive | 372 (80.69) |
| Dead | 89 (19.31) |
| Follow-up (y) | 1.92±1.97 |
| Age | 67.23±13.00 |
| Gender | |
| Female | 219 (47.51) |
| Male | 242 (52.49) |
| AJCC-T | |
| Tis | 1 (0.22) |
| T1 | 11 (2.39) |
| T2 | 78 (16.92) |
| T3 | 311 (67.46) |
| T4 | 57 (12.36) |
| Missing | 3 (0.65) |
| AJCC-N | |
| N0 | 273 (59.22) |
| N1 | 104 (22.56) |
| N2 | 81 (17.57) |
| Missing | 3 (0.65) |
| AJCC-M | |
| M0 | 338 (73.32) |
| Mx | 49 (10.63) |
| M1 | 64 (13.88) |
| Missing | 10 (2.17) |
| Pathologic stage | |
| I | 78 (16.92) |
| II | 180 (39.05) |
| III | 125 (27.11) |
| IV | 64 (13.88) |
| Missing | 14 (3.04) |
| Tumor grade | |
| G1/G2 | Missing |
| G3/G4 | Missing |
| Risk score | |
| Low | 224 (48.59) |
| High | 223 (48.37) |
| Missing | 14 (3.04) |
Data are shown as n (%). AJCC, American Joint Committee on Cancer; TCGA, The Cancer Genome Atlas.
Functional pathway analysis based on ConsensusPathDB database
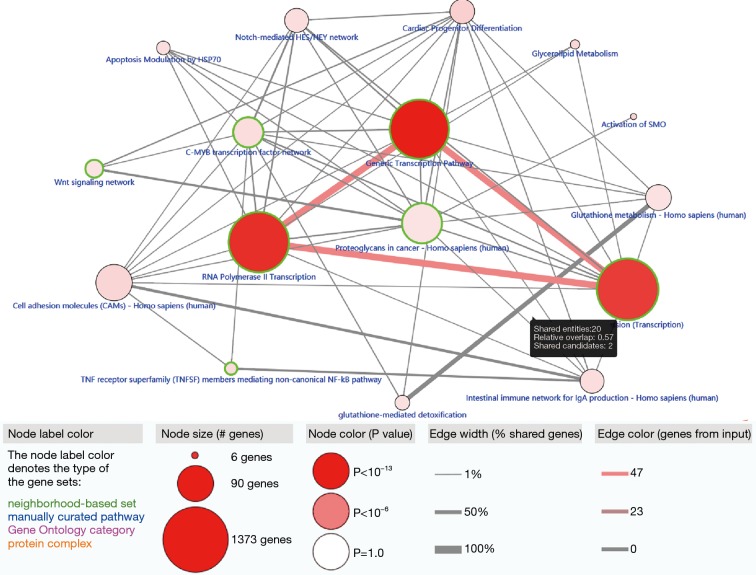
Given that 320 methylation drivers were identified by the MethylMix package, to uncover the potential pathways that these epigenetic drivers might participate in, we performed functional enrichment pathway analysis, which revealed several significant cancer-related pathways, including generic transcription pathway, RNA polymerase II transcription, activation of SMO, and glutathione metabolism. The most relative pathways are shown in Figure 4. The other crosstalk with statistical results is summarized in Table 2.
Figure 4.
Functional enrichment pathway analysis for 320 MDGs based on the ConsensusPathDB database with FDR <0.05.
Table 2. Potential crosstalk enriched for MDGs in colon cancer.
| Pathway | Source | P value |
|---|---|---|
| Generic transcription pathway | Reactome | 0.0000000 |
| RNA polymerase II transcription | Reactome | 0.0000000 |
| Gene expression (transcription) | Reactome | 0.0000000 |
| Robo4 and VEGF signaling pathways crosstalk | Wikipathways | 0.0023531 |
| NLR proteins | Wikipathways | 0.0068259 |
| Activation of SMO | Reactome | 0.0068259 |
| PTF1A related regulatory pathway | Wikipathways | 0.0082731 |
| Cell adhesion molecules (CAMs) | KEGG | 0.0100893 |
| Familial lipoprotein lipase deficiency | SMPDB | 0.0115380 |
| Glycerolipid metabolism | SMPDB | 0.0115380 |
| Glycerol kinase deficiency | SMPDB | 0.0115380 |
| Passive transport by aquaporins | Reactome | 0.0115380 |
| Platinum pathway, pharmacokinetics/pharmacodynamics | PharmGKB | 0.0115380 |
| Glycosaminoglycan biosynthesis | KEGG | 0.0133490 |
| Glycosphingolipid biosynthesis | KEGG | 0.0152746 |
| TNF receptor superfamily (TNFSF) members mediating non-canonical NF-kB pathway | Reactome | 0.0194572 |
| BDNF | NetPath | 0.0208117 |
| Intestinal immune network for IgA production | KEGG | 0.0220269 |
| Notch-mediated HES/HEY network | PID | 0.0232801 |
| C-MYB transcription factor network | PID | 0.0233913 |
| Apoptosis modulation by HSP70 | Wikipathways | 0.0240609 |
| Aquaporin-mediated transport | Reactome | 0.0245713 |
| glutathione-mediated detoxification | HumanCyc | 0.0317044 |
| Glutathione metabolism - Homo sapiens (human) | KEGG | 0.0346700 |
| tumor suppressor arf inhibits ribosomal biogenesis | BioCarta | 0.0372589 |
| Proteoglycans in cancer—Homo sapiens (human) | KEGG | 0.0442667 |
| Glycosphingolipid biosynthesis—lacto and neolacto series | KEGG | 0.0462251 |
| Basal cell carcinoma | KEGG | 0.0465928 |
| Wnt signaling network | PID | 0.0493726 |
Construction of MDGs risk score and associations with clinical variables
A univariate Cox regression model was utilized to select prognostic MDGs in colon cancer based on the survival package with P<0.05. Multivariate Cox regression analysis was then conducted to identify the hub MDGs. According to the stepwise regression model, the minimum AIC was 894.9. The 10-MDGs signature is shown with hazard ratio and 95% CI in Table 3. The risk score was calculated using the following formula: (risk score = 0.12573 × EPHX3 + 0.40776 × FAM179B + 0.08758 × GSTM1 + 0.16666 × HSPA1A − 0.26252 × MPC2 − 0.14311 × RP11 − 543D5.1 + 0.19234 × RP4 − 584D14.6 + 0.12715 × TFAP2C + 0.23671 × TMEM88 + 0.10748 × VWDE).
Table 3. Identification of 10 MDGs signature from the stepwise regression method.
| Gene | coef | exp(coef) | se(coef) | z | P |
|---|---|---|---|---|---|
| EPHX3 | 0.12573 | 1.13398 | 0.08071 | 1.558 | 0.1193 |
| FAM179B | 0.40776 | 1.50345 | 0.16150 | 2.525 | 0.0116 |
| GSTM1 | 0.08758 | 1.09153 | 0.03996 | 2.192 | 0.0284 |
| HSPA1A | 0.16666 | 1.18135 | 0.08145 | 2.046 | 0.0407 |
| MPC2 | −0.26252 | 0.76911 | 0.17011 | −1.543 | 0.1228 |
| RP11-543D5.1 | −0.14311 | 0.86666 | 0.07272 | −1.968 | 0.0491 |
| RP4-584D14.6 | 0.19234 | 1.21208 | 0.10831 | 1.776 | 0.0758 |
| TFAP2C | 0.12715 | 1.13559 | 0.05842 | 2.177 | 0.0295 |
| TMEM88 | 0.23671 | 1.26708 | 0.13439 | 1.761 | 0.0782 |
| VWDE | 0.10748 | 1.11347 | 0.04959 | 2.168 | 0.0302 |
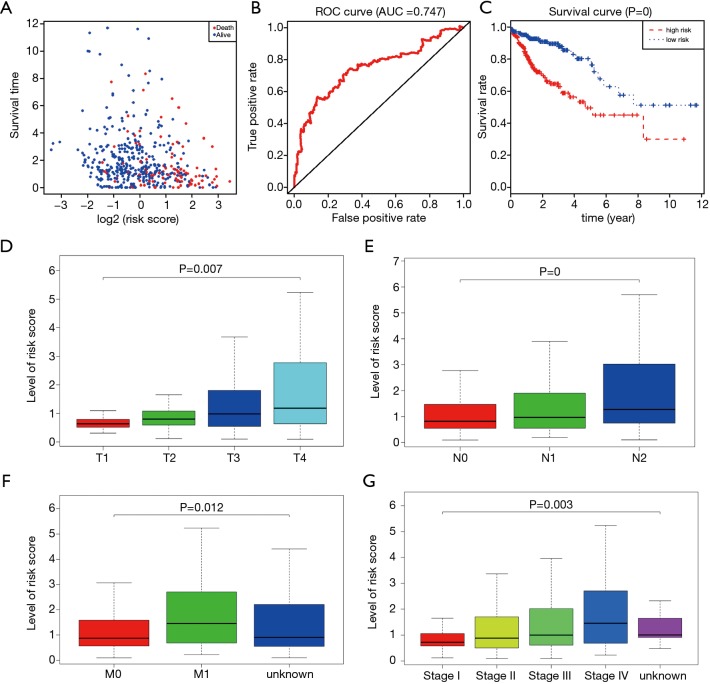
We then divided the 447 colon cancer patients into groups according to risk: high (n=223) and low (n=224) groups. We observed that the dead cases showed higher distributions in patients with higher risk scores (Figure 5A). The AUC of the ROC plot was 0.747, representing a superior power in OS prediction (Figure 5B). The patients with higher risk scores showed poor survival outcomes, with P<0.001 (Figure 5C).
Figure 5.
Construction and assessment of risk score based on the hub MDGs from the Cox regression models. (A) Distributions of vital status based on the risk scores in colon cancer. (B) The AUC of ROC curve was 0.747, representing the better predictive accuracy of risk score. (C) Kaplan-Meier analysis with log-rank test revealed that patients with high risk scores suffered poor survival outcomes. (D,E,F,G) The Kruskal-Wallis test showed that higher risk score was associated with higher T stages (P=0.007), N stages (P<0.001), metastasis (P=0.012) and advanced pathological stages (P=0.003).
The K-W test also suggested that the higher risk score based on the 10-MDGs signature was correlated with higher T stage (P=0.007), N stages (P<0.001), metastasis (P=0.012), and advanced pathological stage (P=0.003), as presented in Figure 5D,E,F,G.
Screening of risk methylation loci with survival and joint survival analysis
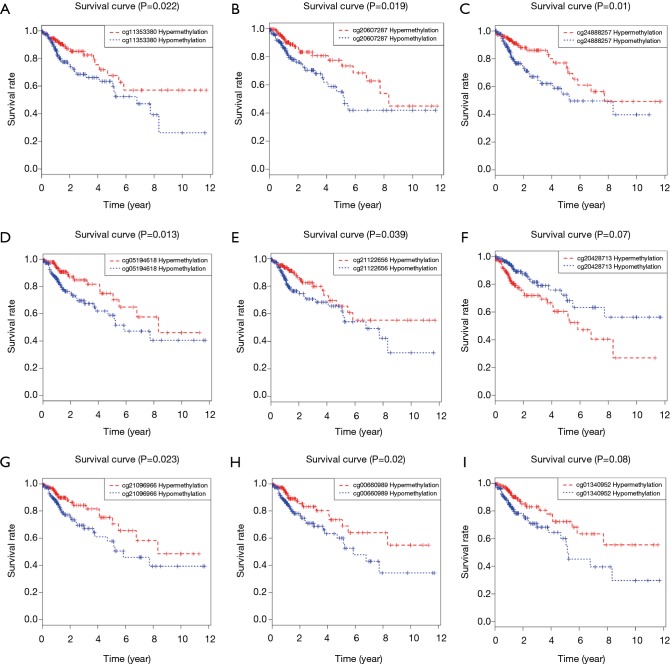
Based on the 10-MDGs signature identified in the above analysis, we further explored the specific methylated loci harboring the risk methylation genes that were highly associated with survival outcomes. We wrote the Perl scripts to extract the whole β value of methylated loci related to the 10-MDGs signature and merged them into one matrix (http://cdn.amegroups.cn/static/application/98c8308732b26aad6a03a9d12a64b031/atm.2020.02.94-2.pdf). The data of 130 methylated sites were integrated with prognostic information to conduct the univariate Cox regression model. A total of 25 methylated risk loci were found to be associated with survival outcomes with P<0.05 (Table 4). The Kaplan-Meier plots of the top methylated sites are shown in Figure 6. The joint survival analysis, combined with methylation status and levels of expression of the 10 hub MDGs signature, showed more associations with survival in 461 patients (Figure 1).
Table 4. Identification of 25 risk methylated loci for patients with colon cancer.
| Locus | Related genes | HR | z | P value |
|---|---|---|---|---|
| cg24888257 | HSPA1A | 0.1879317 | −3.2191822 | 0.0012856 |
| cg05194618 | FAM179B | 0.2549287 | −2.8763535 | 0.0040230 |
| cg21122656 | HSPA1A | 0.2461564 | −2.5833853 | 0.0097836 |
| cg12883479 | HSPA1A | 0.3793917 | −2.5194482 | 0.0117539 |
| cg01340952 | FAM179B | 0.2543431 | −2.4924641 | 0.0126860 |
| cg00660989 | FAM179B | 0.2671080 | −2.4857380 | 0.0129283 |
| cg10598353 | HSPA1A | 0.3767782 | −2.4503290 | 0.0142726 |
| cg13413286 | HSPA1A | 0.3678025 | −2.4158149 | 0.0157000 |
| cg15174834 | HSPA1A | 0.3552811 | −2.4082982 | 0.0160271 |
| cg01639032 | HSPA1A | 0.3397432 | −2.3830306 | 0.0171708 |
| cg21096966 | FAM179B | 0.2549344 | −2.3743623 | 0.0175793 |
| cg17494781 | HSPA1A | 0.3706008 | −2.3661902 | 0.0179722 |
| cg20428713 | RP11-543D5.1 | 4.7110274 | 2.3639744 | 0.0180801 |
| cg19677203 | HSPA1A | 0.3859483 | −2.3587502 | 0.0183366 |
| cg11485463 | HSPA1A | 0.2437277 | −2.3540192 | 0.0185717 |
| cg02704535 | HSPA1A | 0.3726674 | −2.3469669 | 0.0189269 |
| cg22847691 | HSPA1A | 0.3784078 | −2.3457206 | 0.0189903 |
| cg18466674 | HSPA1A | 0.2805209 | −2.3065997 | 0.0210771 |
| cg00929855 | HSPA1A | 0.3165496 | −2.2395801 | 0.0251182 |
| cg11353380 | HSPA1A | 0.0995467 | −2.2305598 | 0.0257103 |
| cg22715094 | HSPA1A | 0.3150061 | −2.0778347 | 0.0377246 |
| cg20607287 | VWDE | 0.3626509 | −2.0293871 | 0.0424189 |
| cg23285774 | FAM179B | 0.0000000 | −2.0174200 | 0.0436517 |
| cg12643366 | HSPA1A | 0.3310439 | −1.9812005 | 0.0475688 |
| cg15185479 | HSPA1A | 0.3276886 | −1.9620509 | 0.0497566 |
Figure 6.
Screening of risk methylated loci related with survival outcomes. (A,B,C,D,E,F,G,H,I) Selection of 9 risk sites to exhibited with estimated P value.
GSEA between the two groups
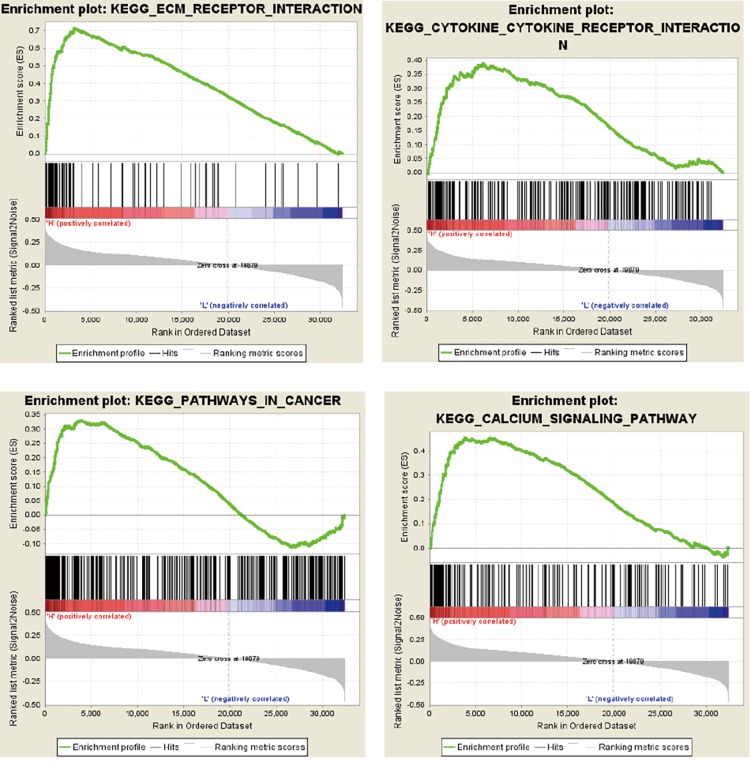
We carried out GSEA with the MDGs risk score serving as the phenotype base on the JAVA platform. Several significant pathways that were enriched, including extracellular matrix (ECM) receptor interaction, chemokine receptor interaction, and pathways in cancer, as well as calcium signaling pathways, were associated with the identified risk drivers (Figure 7).
Figure 7.
Gene set enrichment analysis for exploration of potential pathways associated with hub signature using the MDGs risk score as the phenotype.
Discussion
Epigenetics focuses on the features and modification of the genome (8), including post-translational modifications of histones, cytosine modifications of DNA, nucleosome positioning and interactions of spatial conformation between genomic regions and accessible genomic loci2 (11,12). As a crucial part of epigenetics (13,14), DNA methylation was found to be involved in malignant progression (15). In several reports, the aberrant methylation of DNA has been demonstrated to affect the cell cycles of genes involved in DNA damage (16), cell cycle (17). Besides, other studies have found methylation to bear correlation with poor prognoses in patients with early-stage gastrointestinal cancer (18,19). With this in mind, bioinformatics analysis and the prognostic value of methylation DNA can offer guidance for clinical treatments.
In our research, we carried out an analysis of DNA methylation and gene expression data about colon cancer. The top 100 MDGs were found to investigate the differential distributions of methylated state, showing that methylation was negatively correlated with gene expression. Gene enrichment revealed that certain pathways and hub genes were affected by methylation, which could offer some insight to assist with unraveling the pathogenesis of colon cancer. Analysis conducted on enrichment in the KEGG pathway database uncovered significant enrichment in pathways such as cytokine-cytokine receptor interaction, calcium signaling pathway, and ECM-receptor interaction. The risk score was based on the hub MDGs from the Cox regression models, and the ROC curve was 0.747, which translates to risk score having better predictive accuracy. Nine risk sites were displayed with P-value, discovering methylated risk loci related to survival outcomes. The combined use of methylation sites could provide more opportunities to perform more sensitive and specific tests for the prognoses of colon cancer patients. There is an increasing amount of evidence-based on bioinformatics analysis which suggests that abnormal DNA methylation is related to tumor formation and development (20,21). The survival analysis also discovered the link between methylation and the expression of key genes. For these key genes, we carried out further exploration of the relationship between the expression and methylation levels of the sites, finding that several sites had a negative association with levels of gene expression. This could be caused by variable methylation of the sites, resulting in expression dysregulation and affecting the progression of cancer and prognosis for patients (22,23). Besides, the link between aberrated methylated sites and gene expression was investigated to determine a more accurate target for related experiments and further verification (24,25). Despite this being a comprehensive study relating to epigenetic changes, experiments remain an important way of verifying specificity and sensitivity.
Supplementary
The article’s supplementary files as
Acknowledgments
Funding: None.
Ethical Statement: The authors are accountable for all aspects of the work in ensuring that questions related to the accuracy or integrity of any part of the work are appropriately investigated and resolved.
Footnotes
Conflicts of Interest: The authors have no conflicts of interest to declare.
References
- 1.Jemal A, Bray F, Center MM, et al. Global cancer statistics. CA Cancer J Clin;61:69-90. 10.3322/caac.20107 [DOI] [PubMed] [Google Scholar]
- 2.Miller KD, Nogueira L, Mariotto AB, et al. Cancer treatment and survivorship statistics, 2019. CA Cancer J Clin 2019;69:363-85. 10.3322/caac.21565 [DOI] [PubMed] [Google Scholar]
- 3.Cheng J, Wei D, Ji Y, et al. Integrative analysis of DNA methylation and gene expression reveals hepatocellular carcinoma-specific diagnostic biomarkers. Genome Med 2018;10:42. 10.1186/s13073-018-0548-z [DOI] [PMC free article] [PubMed] [Google Scholar]
- 4.Wang B, Gao W, Li J, et al. Methylation loci associated with body mass index, waist circumference, and waist-to-hip ratio in Chinese adults: an epigenome-wide analysis. Lancet 2016;388 Suppl 1:S21. 10.1016/S0140-6736(16)31948-1 [DOI] [Google Scholar]
- 5.Cancer Genome Atlas Research Network , Linehan WM, Spellman PT, et al. Comprehensive Molecular Characterization of Papillary Renal-Cell Carcinoma. N Engl J Med 2016;374:135-45. 10.1056/NEJMoa1505917 [DOI] [PMC free article] [PubMed] [Google Scholar]
- 6.Greenberg MVC, Bourc'his D. The diverse roles of DNA methylation in mammalian development and disease. Nat Rev Mol Cell Biol 2019;20:590-607. 10.1038/s41580-019-0159-6 [DOI] [PubMed] [Google Scholar]
- 7.Carethers JM, Jung BH. Genetics and Genetic Biomarkers in Sporadic Colorectal Cancer. Gastroenterology 2015;149:1177-90.e3. 10.1053/j.gastro.2015.06.047 [DOI] [PMC free article] [PubMed] [Google Scholar]
- 8.Liu Y, Sethi N, Hinoue T, et al. Comparative Molecular Analysis of Gastrointestinal Adenocarcinomas. Cancer Cell 2018;33:721-35.e8. 10.1016/j.ccell.2018.03.010 [DOI] [PMC free article] [PubMed] [Google Scholar]
- 9.Zhao QQ, Jiang C, Gao Q, et al. Gene expression and methylation profiles identified CXCL3 and CXCL8 as key genes for diagnosis and prognosis of colon adenocarcinoma. J Cell Physiol 2020;235:4902-12. 10.1002/jcp.29368 [DOI] [PubMed] [Google Scholar]
- 10.Christoph B. Analysing and interpreting DNA methylation data. Nat Rev Genet 2012;13:705-19. 10.1038/nrg3273 [DOI] [PubMed] [Google Scholar]
- 11.Yu H, Jiang W, Chen G, et al. Impact of Colon-Specific DNA Methylation-Regulated Gene Modules on Colorectal Cancer Patient Survival. Med Sci Monit 2019;25:3549-57. 10.12659/MSM.916181 [DOI] [PMC free article] [PubMed] [Google Scholar]
- 12.Michalak EM, Burr ML, Bannister AJ, et al. The roles of DNA, RNA and histone methylation in ageing and cancer. Nat Rev Mol Cell Biol 2019;20:573-89. 10.1038/s41580-019-0143-1 [DOI] [PubMed] [Google Scholar]
- 13.Ibrahim J, Op de Beeck K, Fransen E, et al. Methylation analysis of Gasdermin E shows great promise as a biomarker for colorectal cancer. Cancer Med 2019;8:2133-45. 10.1002/cam4.2103 [DOI] [PMC free article] [PubMed] [Google Scholar]
- 14.Gupta K, Garg R. Method for Bisulfite Sequencing Data Analysis for Whole-Genome Level DNA Methylation Detection in Legumes. Methods Mol Biol 2020;2107:127-45. 10.1007/978-1-0716-0235-5_6 [DOI] [PubMed] [Google Scholar]
- 15.Moss J, Magenheim J, Neiman D, et al. Comprehensive human cell-type methylation atlas reveals origins of circulating cell-free DNA in health and disease. Nat Commun 2018;9:5068. 10.1038/s41467-018-07466-6 [DOI] [PMC free article] [PubMed] [Google Scholar]
- 16.Guccione E, Richard S. The regulation, functions and clinical relevance of arginine methylation. Nat Rev Mol Cell Biol 2019;20:642-57. 10.1038/s41580-019-0155-x [DOI] [PubMed] [Google Scholar]
- 17.Perovanovic J, Dell'Orso S, Gnochi VF, et al. Laminopathies disrupt epigenomic developmental programs and cell fate. Sci Transl Med 2016;8:335ra58. 10.1126/scitranslmed.aad4991 [DOI] [PMC free article] [PubMed] [Google Scholar]
- 18.Yao Z, Di Poto C, Mavodza G, et al. DNA Methylation Activates TP73 Expression in Hepatocellular Carcinoma and Gastrointestinal Cancer. Sci Rep 2019;9:19367. 10.1038/s41598-019-55945-7 [DOI] [PMC free article] [PubMed] [Google Scholar]
- 19.Okugawa Y, Grady WM, Goel A. Epigenetic Alterations in Colorectal Cancer: Emerging Biomarkers. Gastroenterology 2015;149:1204-25.e12. 10.1053/j.gastro.2015.07.011 [DOI] [PMC free article] [PubMed] [Google Scholar]
- 20.Ho B, Johann PD, Grabovska Y, et al. Molecular subgrouping of Atypical Teratoid / Rhabdoid Tumors (ATRT) - a reinvestigation and current consensus. Neuro Oncol 2019. [Epub ahead of print]. 10.1093/neuonc/noz235 [DOI] [PMC free article] [PubMed] [Google Scholar]
- 21.Zhang Z, Chen P, Xie H, et al. Using circulating tumor DNA as a novel biomarker to screen and diagnose hepatocellular carcinoma: A systematic review and meta-analysis. Cancer Med 2020;9:1349-64. 10.1002/cam4.2799 [DOI] [PMC free article] [PubMed] [Google Scholar]
- 22.Yang C, Zhang Y, Xu X, et al. Molecular subtypes based on DNA methylation predict prognosis in colon adenocarcinoma patients. Aging (Albany NY) 2019;11:11880-92. 10.18632/aging.102492 [DOI] [PMC free article] [PubMed] [Google Scholar]
- 23.Neumeyer S, Popanda O, Butterbach K, et al. DNA methylation profiling to explore colorectal tumor differences according to menopausal hormone therapy use in women. Epigenomics 2019;11:1765-78. 10.2217/epi-2019-0051 [DOI] [PubMed] [Google Scholar]
- 24.Qin Y, Roberts JD, Grimm SA, et al. An obesity-associated gut microbiome reprograms the intestinal epigenome and leads to altered colonic gene expression. Genome Biol 2018;19:7. 10.1186/s13059-018-1389-1 [DOI] [PMC free article] [PubMed] [Google Scholar]
- 25.Mima K, Nishihara R, Qian ZR, et al. Fusobacterium nucleatum in colorectal carcinoma tissue and patient prognosis. Gut 2016;65:1973-80. 10.1136/gutjnl-2015-310101 [DOI] [PMC free article] [PubMed] [Google Scholar]
Associated Data
This section collects any data citations, data availability statements, or supplementary materials included in this article.
Supplementary Materials
The article’s supplementary files as


