Abstract
Background
Renal cell carcinoma (RCC) has gradually become a severe type of kidney malignant tumor, which warrants an urgent need for highly efficacious therapeutic agents. Morusin, a typical prenylated flavonoid, has been revealed to possess anticarcinogenic effects against several cancers by inhibiting cell proliferation and tumorigenesis.
Methods
Cells proliferation was examined by CCK-8. Migration assays were performed using a 24-well transwell chamber. Apoptotic cells were detected using the Annexin V PE/7-AAD apoptosis detection kit. Cell cycle analysis was carried out by flow cytometry. Western blotting and quantitative real time (qRT) PCR were used to exam the change of target gene in mRNA and protein level. Nude mouse xenograft experiments were performed to identify vivo function of morusin.
Results
Here, we evaluated the effect of morusin against RCC. We treated three RCC cell lines, 769-P, 786-O, and OSRC-2, with morusin to study its effects on cell growth, migration, apoptosis, cell cycle and cancer-related pathways. Additionally, we assessed the effects of morusin on tumor growth using a nude mouse model. Morusin could inhibit cell growth and migration, induce cell apoptosis and downregulate apoptosis-related proteins, and disturb the cell cycle arrest in the G1 phase. Additionally, morusin could suppress RCC tumorigenesis in vivo. Moreover, mitogen-activated protein kinase (MAPK) signal pathways were found to be involved in morusin-induced anti-cancer activity. P-p38 and P-JNK levels were up-regulated by morusin, while the ERK phosphorylation level was down-regulated.
Conclusions
Our results show that morusin could inhibit the growth of RCC cells in vitro and in vivo through MAPK signal pathways. Thus, morusin could be a potential anti-cancer agent for RCC.
Keywords: Morusin, anti-cancer activity, renal cell carcinoma (RCC), mitogen-activated protein kinase (MAPK)
Introduction
Renal cell carcinoma (RCC) is a primary and typical malignant kidney tumor, mainly derived from renal tubular epithelial cells and distributed in each part of the uriniferous tubule (1). RCC incidence has gradually increased over the past few decades globally, and its morbidity rate stands the third among cancers of the urinary system, accounting for about 5% of all new cancer diagnoses, just below prostatic cancer and bladder cancer (2). Almost half of the patients with RCC have experienced cancer metastasis to other tissues. Strangely, there were huge variations in the morbidity rates due to RCC among different regions, North America and Europe showed higher incidence than Africa and Asia maybe due to heredity or environment (3). Enormous progress has been made towards treating RCC, in terms of surgery, radiotherapy, and chemotherapy. Unfortunately, the overall clinical outcome remains unoptimistic, with a five-year survival rate of patients with RCC being under 10%. In the past decades, with remarkable advances in the knowledge regarding molecular biology and cytogenetics of RCC, multiple targeting drugs have been developed to improve the patient survival time and therapeutic effect, including that of sorafenib, sunitinib, axitinib, and apatinib. Nonetheless, high-cost, stiff-price, and drug resistance limited their usage. Overall, research efforts need to be directed towards seeking for efficient natural small molecule drugs in order to achieve an optimal patient benefit and a sustainable system for treating RCC.
Flavonoid, a group of naturally occurring polyphenols that is widespread in the vegetable kingdom, has drawn increasing attention owing to its physiological, antioxidant, pharmaceutical, antiviral, and especially anticancer activity (4-6). It is composed of several subclasses, such as flavonols, flavanones, flavones, anthocyanins, and isoflavones, which have been studied for their anti-cancer activities. For example, most flavanone derivatives have been verified to regulate the expression of cell cycle regulatory proteins, block G1 cell cycle progression, and repress the clonogenicity of HCT116 cells (7). Wogonin, derived from natural flavones, is an inhibitor of cyclin-dependent kinase and blocks RNA synthesis by suppressing the phosphorylation of carboxy-terminal domain of RNA polymerase II, inducing cancer cell apoptosis (8). Formononetin, an isoflavone from Astragalus membranaceus, increased the expression of caspase 3/9 proteins and the ratio of Bax/Bcl-2, and decreased the expression of MMP-2/9 proteins and the phosphorylation level of ERK so as to inhibits the proliferation and metastasis of ovarian cancer cells (9). Morusin, a typical prenylated flavonoid that was isolated from the branch bark of cultivated mulberry, has been studied for its anti-cancer activity against several tumor cell lines, such as, glioblastoma cell, prostate cancer cell, gastric cancer cell, and breast cancer cell, via the inhibition of cell proliferation, induction of autophagy and apoptosis, which suggested several potential pathways induced by morusin (10-14). And it’s worth noting that autophagy and apoptosis might play an antagonistic role induced by morusin (14). These findings present morusin as a significant plant secondary product that could be explored as a therapeutic option against cancer.
Therefore, here, we evaluated the effect of morusin against RCC by treating three RCC cell lines, 769-P, 786-O, and OSRC-2, with morusin to study the effects of morusin on cell growth, migration, apoptosis, cell cycle, and cancer-related pathways. Additionally, we assessed the effect of morusin on tumor growth using a nude mouse model.
Methods
Cell culture and morusin preparation
Three RCC cell lines, 769-P, 786-O, and OSRC-2, obtained from the American Type Culture Collection (ATCC, Rockville, MD, USA), were kept in our laboratory. They were cultured in 1640 medium (Gibco, USA), supplemented with 10% fetal bovine serum (FBS) (Gibco) and 1% penicillin/streptomycin (Gibco). Cell lines were maintained at 37 °C within 5% CO2. Morusin was commercially purchased from MedChemExpress (MCE, USA), and it was dissolved in DMSO (Sigma, USA) to obtain a 20 mg/mL stock-solution. In this study, DMSO was used as a negative control.
Cell viability assays
Cytotoxicity of morusin against RCC cells was tested using CCK-8 kit (Beyotime, China), according to the manufacturer’s instructions. Briefly, 769-P, 786-O, and OSRC-2 cells were seeded in a 96-well plate (2×10³ cells/well) with 100 µL medium. After cells adherence, different concentrations (0, 2, 4, 6 µg/mL) of morusin was added into each well for 1, 2, 3, 4, 5, and 6 days. Subsequently, 10 µL WST-8 was added in each well and incubated for 2 h. Cell viability was directly proportional to the production of formazan, and the absorbance was measured at 450 nm using a microplate reader. Finally, cell viability of different groups was presented as the percentage compared to the control. All data were obtained from triplicate experiments.
Cell migration assays
Migration assays were performed using a 24-well transwell chamber (Corning Costar, USA) with an 8 µM pores. Around 2×10⁵ cells, suspended in 200 µL medium with 2% FBS were placed in the upper chamber, and normal culture medium was placed in the lower chamber. After incubation for about 24–48 h at 37 °C, the chamber was taken out and washed with PBS (three washed at 5 minutes interval each), cells were, then, fixed with 4% paraformaldehyde. Lastly, the cells passed through the pore were stained by crystal violet.
Cell apoptosis assays
Apoptotic cells were detected using the Annexin V PE/7-AAD apoptosis detection kit (Solarbio Science & Technology, China) according to the manufacturer’s instructions. Cells were collected after 48 h treatment with different concentrations of morusin (0, 2, 4 µg/mL). After three PBS washed, 100 µL of the cell suspension was stained with 5 µL Annexin V/PE and 10 µL 7-AAD at 25 °C for about 15 minutes in dark. Thereafter, apoptotic cells were detected by flow cytometry.
Cell cycle assays
Cell cycle analysis was carried out by flow cytometry. First, 2–5×10⁶ cells (from different cell lines) were collected after treatment with 0, 2, or 4 µg/mL morusin for 48 h, and then fixed in 70% precooled ethanol for 90 minutes after washing thrice with PBS. Subsequently, cells were incubated with RNase A and propidium iodide (PI) at 37 °C for 30 minutes. Lastly, cells were passed through 70-µm Falcon Filters for single cell suspension, and cell cycle was analyzed by utilizing flow cytometry.
Western blotting assays
Cells treated with morusin were lysated by RIPA (Beyotime) lysis buffer supplemented with a protease inhibitor PMSF (Beyotime) for 30 minutes on ice. Then, the mixtures were centrifuged (12,000 ×g) for 10 minutes at 4 °C for separating the cell debris. Protein concentration was measured by BCA assay (Beyotime). Equal protein contents were boiled for about 5 minutes with loading buffer and separated by SDS-polyacrylamide gels electrophoresis (10% gel), followed by transfer to PVDF membranes (Roche, USA). The PVDF membrane was soaked in blocking buffer for 20 minutes and incubated with the primary antibody at 25 °C for 1–2 h. After three washes with PBS, the membrane was incubated with horseradish peroxidase (HRP)-labeled goat anti-rabbit/mouse IgG secondary antibody (Beyotime). Lastly, the membrane was visualized by enhanced chemiluminescence chromogenic substrate. Mouse monoclonal antibody (anti-caspase3, anti-phospho-p38, anti-p38) and rabbit monoclonal antibody (anti-phospho-ERK, anti-ERK, anti-phosphor-JNK, anti-JNK, anti-Bax, anti-Bcl-2, anti-tubulin, anti-cyclin D1, anti-CDK4, anti-CDK6) were purchased from Beyotime.
Quantitative real time (qRT) PCR assays
Total RNA of cells and tissues was extracted using the TRIzol reagent (Takara, Japan). One microgram of total RNA was used for first strand cDNA synthesis using the PrimeScriptTM RT reagent Kit (Takara, Japan), according to the manufacturer’s instructions. qRT-PCR was performed on the Stepone Plus real-time PCR system (Applied Biosystems, USA). The mRNA expression was finally determined by comparing it to GAPDH expression. Every sample was tested in triplicate and three independent experiments were performed. All primers used in the experiment were presented in Table 1.
Table 1. Nucleotide sequences of primers used for RT-PCR reactions.
| Gene | Forward (5'-3') | Reverse (5'-3') |
|---|---|---|
| BCL2 | TTGGGGACAAGGGCTCTAAA | AGAATGTTGGCGTCTTGTTTGA |
| BAX | CACAGCCAGGGATATGGAGT | GGCAGGCCTGAATAATGAAA |
| Caspase3 | TGGAATTGATGCGTGATGTT | GGCAGGCCTGAATAATGAAA |
| Cyclin D1 | GCTGTGCATCTACACCGACA | TTGAGCTTGTTCACCAGGAG |
| CDK4 | GTGCAGTCGGTGGTACCTG | AGGCAGAGATTCGCTTGTGT |
| CDK6 | TGATCAACTAGGAAAAATCTTGGAC | GGCAACATCTCTAGGCCAGT |
Tumor formation assays in vivo
All animal experiments were carried out following the guidelines by the Xinqiao Hospital and the Animal Care and Use Committee of the Third Military Medical University. Around 1×10⁶ OSRC-2 cells mixed in matrix gel (1:1 volume) were resuspended in 200 µL PBS and subcutaneously inoculated into the dorsal side of 4-week-old female nude mice (6 in each group). Thirty µL 20 mg/Kg morusin was injected by intraperitoneal injection every 3 days for one mouse. We measured the tumor size every 3 days with a caliper, and the volume was calculated as V = length × (width2)/2. The nude mice were sacrificed 3 weeks after implanted OSRC-2 cells, and the tumor weight was measured.
Immunohistochemical staining
Tumors from the nude mice were excised, fixed in 4% paraformaldehyde, embedded in paraffin, and cut into 4 µM sections. After incubation with hydrogen peroxide and an enzyme reagent, further incubation was then carried out overnight at 4 °C with primary antibody against Ki-67 or P27. This was followed by treatment with a secondary antibody for 30 minutes followed by development with a developer for 10 minutes. Five fields of view were randomly selected under high power (40×) for quantitative analysis.
Statistical analysis
All statistical analyses were performed using the SPSS 19.0 software. All data were expressed as mean ± standard deviation. Repeated measured analysis of variance was used for subcutaneous transplantation growth curves and CCK-8 experimental statistics. Two-tailed unpaired t-test was used to compare between the two groups, while One-way analysis of variance (ANOVA) was used to compare between three or more groups.
Results
Morusin inhibits RCC cell proliferation and migration
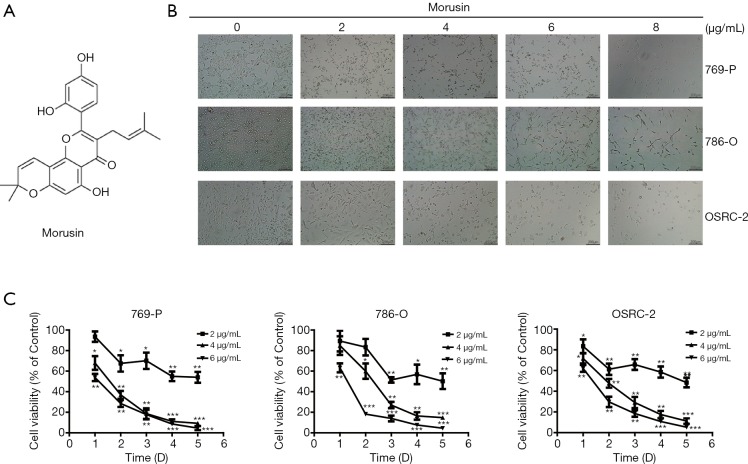
The structure of morusin is shown in Figure 1A. At first, to detect the impact of morusin on RCC cell proliferation inhibition, we treated 769-P, 786-O, and OSRC-2, three typical RCC cell lines, with different doses of morusin for 48 h. Direct observation showed that morusin could dramatically inhibit cell proliferation in a dose-dependent manner in all three RCC cell lines (Figure 1B). The CCK-8 assay statistically proved the cytotoxicity of morusin in dose- and time-dependent manner. In the 24 h treatment groups, low concentration (2 µg/mL) of morusin did not induce significant cell proliferation inhibition. In the 48-h treatment group, all concentrations of morusin resulted in obvious inhibition of cell proliferation. Morusin treatment for 72 h or more, at 4 and 6 µg/mL, could inhibit cell viability below 30% compared to negative control (Figure 1C).
Figure 1.
Cytotoxicity of morusin on RCC cell lines. (A) The chemical structures of morusin. (B) 769-P, 786-O, and OSRC-2 cells were treated with morusin (0, 2, 4, 6, 8 µg/mL) for 24 h for morphologic observation. (C) Morusin treated RCC cells with increasing incubation time from day 1 to day 6, and the cell viability was analyzed by the CCK-8 assay. Bars show the value as the mean ± SD from three independent experiments. *, P<0.05, **, P<0.01, and ***, P<0.001 compared to negative control. RCC, renal cell carcinoma; CCK-8, cell counting kit-8; mean ± SD, mean ± standard deviation.
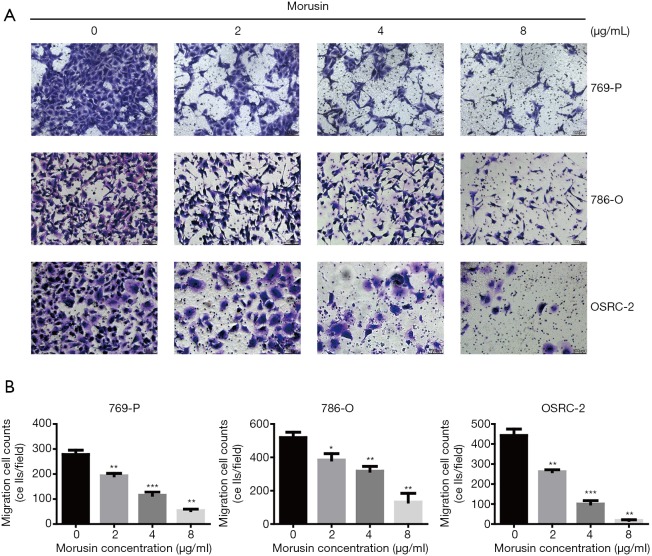
Migration capability was a significant index in cancer cells (15). In order to verify whether morusin could influence RCC cell motility, a transwell assay was executed (Figure 2A). After incubation for 48 h, RCC cells penetrating the transwell membrane were prominently reduced compared to the negative control, by crystal violet staining, which exhibited that morusin was able to repress migration cell counts, especially in OSRC-2 (Figure 2B). These results demonstrated that morusin inhibits cell proliferation and migration in RCC cells.
Figure 2.
Morusin inhibits cell migration of RCC cell lines. (A) 769-P, 786-O, and OSRC-2 cells were incubated with morusin (0, 2, 4, 8 µg/mL). Migration ability was detected by transwell assay, and cells were stained with crystal violet. (B) The cells that passed through the transwell membrane were calculated. Data indicating migration ability are shown as a histogram. *, P<0.05, **, P<0.01, and ***, P<0.001 compared to negative control.
Morusin induces RCC cell apoptosis
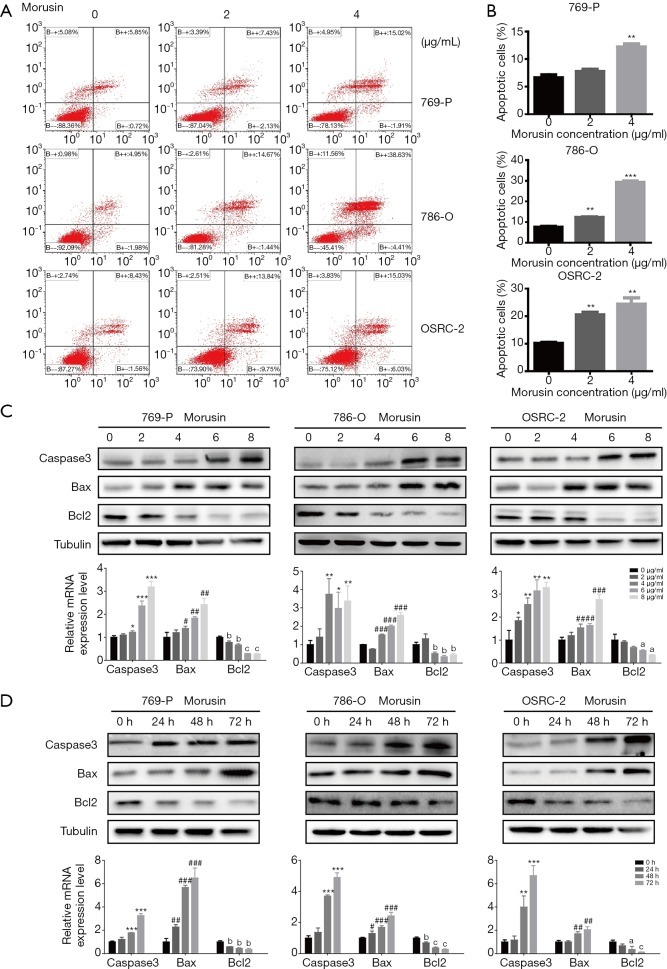
As a significant mode of programmed cell death, apoptosis regulates the response of cancer cells to treatment with cytostatic drugs (16,17). To identify whether morusin can induce RCC cell apoptosis, flow cytometry analyses by Annexin-V-FITC and PI double staining assay were performed (Figure 3A). Compared to the untreated cells, apoptosis cell rates of 769-P, 786-O, and OSRC-2 were 7.73%, 12.25%, and 20.42% with 2 µg/mL morusin, and 12.18%, 29.16%, and 24.41% with 4 µg/mL morusin, respectively (Figure 3B). OSRC-2 and 786-O were more sensitive than 769-P.
Figure 3.
Morusin activates cell apoptosis and perturbs apoptosis-related protein expression. (A) Annexin V PE/7-AAD stained apoptotic cells induced by morusin in RCC cells. (B) Apoptosis ratios were shown in the diagram. (C,D) Apoptosis-related protein expression was detected by western blotting and qPCR in a time and concentration gradient. (#, *, a) P<0.05, (##, **, b) P<0.01, and (###, ***, c) P<0.001 compared to negative control. RCC, renal cell carcinoma; qPCR, real-time quantitative PCR detecting system.
Subsequently, to identify the underlying pro-apoptotic mechanisms, we detected the expression levels of apoptosis-related proteins in RCC cells. As shown in Figure 3C,D, morusin treatment resulted in up-regulation of Bax and cleaved-caspase3, down-regulation of Bcl-2 by western blotting and qPCR, in a time- and dose-dependent manner. These findings suggested that Morusin was able to induce cell apoptosis in RCC cells.
Morusin perturbs cell cycle arrest at G1 phase
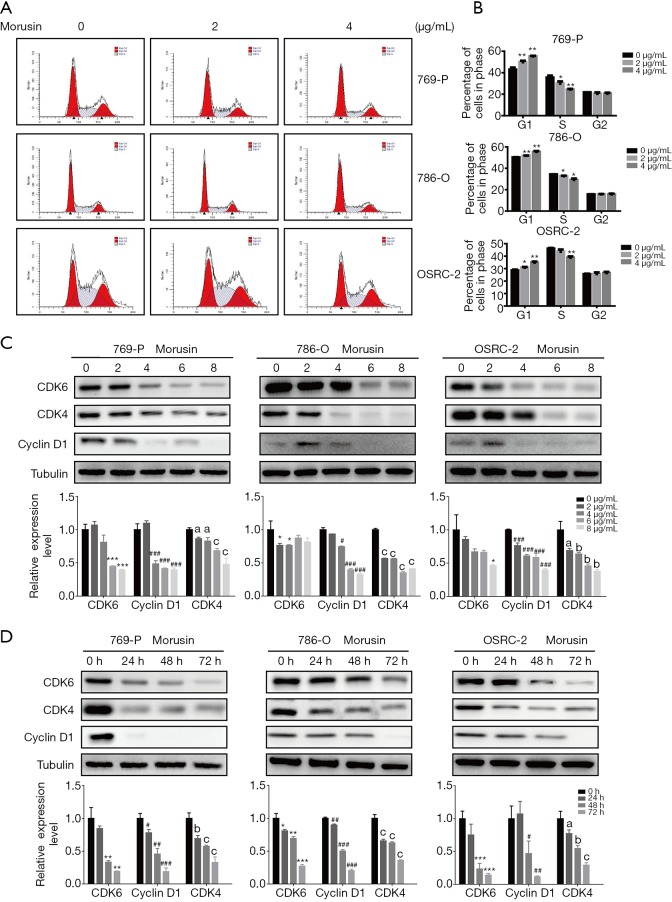
A stable cell cycle is important for cell growth and proliferation (18,19). The above-mentioned study indicated that morusin could induce RCC cell death. For gaining further gaining insight into the anti-cancer mechanisms of morusin, we performed cell cycle analysis by flow cytometry (Figure 4A). In all RCC cell lines tested, morusin treatment altered cell ratio in different cycle phases, and the increased cell ratios in G1 phase were 6.94%, 1.62%, and 2.33% in 769-P, 786-O, and OSRC-2 with 2 µg/mL morusin, respectively, while they were 12.38% 5.22%, and 6.29% with 4 µg/mL morusin, respectively. Accordingly, decreased cells ratios in S phase were 5.59%, 1.66%, and 2.48% with 2 µg/mL morusin, while they were 11.08%, 5.20%, and 7.22% with 4 µg/mL morusin, respectively, in 769-P, 786-O, and OSRC-2 (Figure 4B). Cell ratios in the G2 phase showed little fluctuation.
Figure 4.
Morusin perturbs cell cycle arrest in the G1 phase. (A) Cell cycle analysis of 769-P, 786-O, and OSRC-2 cells treated with morusin (0, 2, 4 µg/mL) through flow cytometry. (B) The histogram cell proportions in different cell-cycle stages. (C,D) The expression of cell cycle-related proteins was measured by western blotting and qPCR. (#, *, a) P<0.05, (##, **, b) P<0.01, and (###, ***, c) P<0.001 compared to negative control. qPCR, real-time quantitative PCR Detecting System.
Next, the expression level of proteins related to the cell cycle was detected by western blotting and qPCR (Figure 4C,D). Cyclins and CDKs, the two central cell cycle-related protein families (20), were assessed to identify if they could be disturbed by morusin. When the morusin concentration was more than 2 µg/mL, CDK4, CDK6, and cyclin D1 were acutely inhibited, and their levels decreased in a time-dependent manner, especially that of cyclin D1, which was almost vanished after 24 h treatment. These results demonstrate that morusin treatment perturbs cell cycle arrest at the G1 phase in a time- and dose-dependent manner and inhibits expression of cell cycle-related proteins.
Morusin activated MAPK signaling pathways with implications in RCC
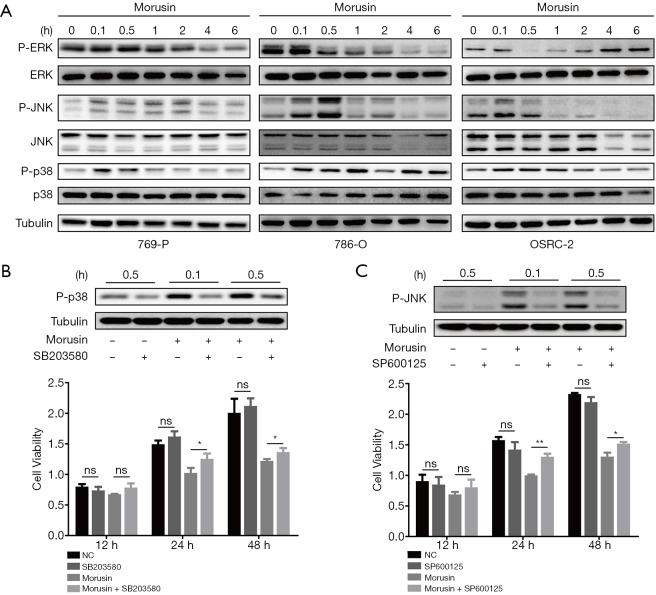
Mitogen-activated protein kinase (MAPK) signal pathway plays crucial roles in delivering extracellular stimulus into the cell to induce cellular response, which could influence cell proliferation, differentiation, apoptosis, inflammation, and autophagy (21,22). MAPK is a signaling pathway, that is conversed evolutionarily almost in all eukaryotes and contains three main groups, extracellular signal-regulated protein kinase (ERK), c-Jun amino (N)-terminal kinases 1/2/3 (JNK1/2/3), and p38 MAPK (p38) (23). It is noteworthy that perturbations in MAPK signaling are typical in 20% of all human cancers (24). To elucidate MAPK signal function in morusin anti-cancer mechanisms, western blotting assays were performed to demonstrate whether MAPK signals could be induced by morusin or not. For observing the change of phosphorylation level of ERK, JNK, and p38, we harvested the cells and extracted proteins from them at 0, 0.1, 0.5, 1, 2, 4, and 6 h after 4 µg/mL morusin treatment in the three cell lines. Phosphorylation level of the three kinases were fluctuated. In 769-P cells, the phosphorylated-ERK level was sharply decreased upon treatment for 4 and 6 h, the P-JNK level was detectably augmented from 0.1 to 2 h and subsequently returned to normal. The P-p38 level was similar to that of P-JNK. In 786-O cells, the P-ERK signal continued declining and was not detected to recover within 6 h, while the levels of P-JNK was similar to that in 796-P cells, and P-p38 continued to increase. In OSRC-2 cells, P-ERK was sharply decreased upon treatment for 0.5 and 1 h, while it gradually recovered after 2 h, and P-p38 levels were similar to that in 786-O cells, while P-JNK level was remarkably decreased after 0.5 h (Figure 5A). These results demonstrated that morusin could significantly induce MAPK signaling in a time-dependent manner.
Figure 5.
Morusin affects mitogen-activated protein kinase (MAPK) signaling pathways in RCC cell lines. (A) Cells treated with morusin for different incubation times were collected and detected by western blotting using p38, JNK, and ERK antibodies and phosphorylated antibodies. (B) SB203580 pretreatment inhibited the morusin-induced p38 phosphorylation detected by western blotting and cell proliferation by CCK-8 assays. (C) SP600125 pretreatment inhibited the morusin-induced p-JNK phosphorylation detected by western blotting and cell proliferation by CCK-8 assays. *, P<0.05, **, P<0.01 compared to negative control. RCC, renal cell carcinoma; JNK, Jun N-terminal kinase; ERK, extracellular signal-regulated protein kinase; CCK-8, cell counting kit-8.
To further confirm that morusin inhibited RCC cells proliferation through the activation of MAPK signaling pathways, SB203580, a selective and ATP-competitive p38 phosphorylation inhibitor, and SP600125, a reversible JNK phosphorylation inhibitor, were used for pretreatment in 769-P cells for 0.1 h and 0.5 h before morusin incubation (25,26). Western blotting was performed to detect the P-p38 and P-JNK level after morusin incubation for 0.1 and 0.5 h. It was obviously revealed that treatment with morusin and SB203580 or SP600125 significantly downregulated p38 and JNK phosphorylation compared to treatment with morusin alone (Figure 5B,C). And CCK-8 assays showed that SB203580 and SP600125 were able to rescue the inhibition effect of morusin on RCC cells proliferation in some degree.
Morusin inhibits RCC tumor growth in vivo
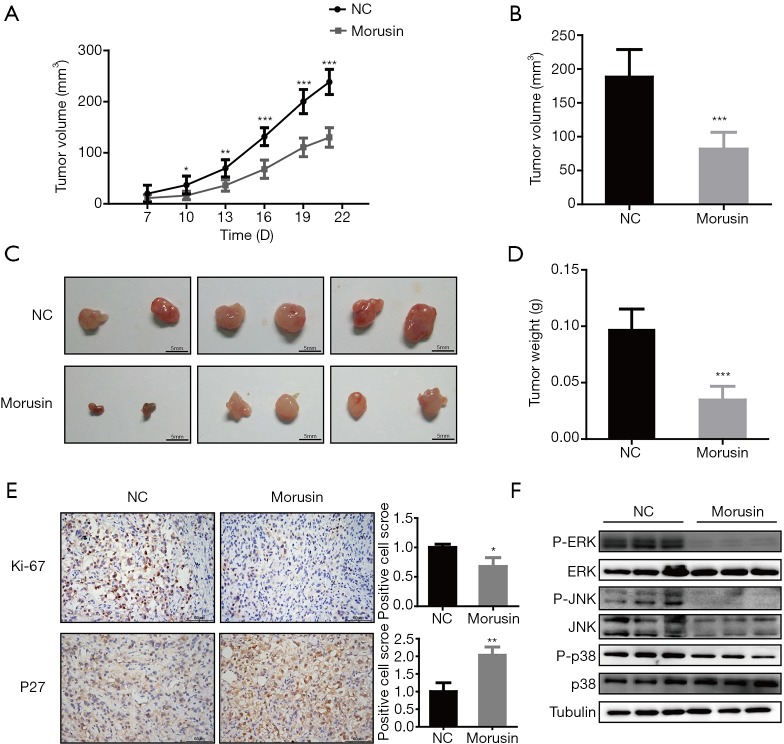
To identify the anti-cancer effects of morusin in vivo, we investigated whether morusin could inhibit RCC growth by conducting nude mouse xenograft experiments. Around 1×10⁶ OSRC-2 cells were injected subcutaneously in nude mice. Continuous photo collection diebus quaternis demonstrated that morusin could repress xenograft tumor volume (Figure 6A), the volume decreased to 56.66% until 21 days treatment (Figure 6B). Upon treatment for a longer duration, tumors were significantly diminished by about 63.92% (Figure 6C,D). The results in the morusin group were significantly smaller than those in the NC group. Two biomarkers were chosen to be detected after morusin addition by tumor immunohistochemical analysis. The expression of Ki-67, a cell proliferation marker, was decreased after injection of morusin. Meanwhile, the expression of P27, postulated as a biomarker for RCC, was significantly increased (Figure 6E). And we also analyzed the MAPK signal pathways mice tumor treated by morusin. In treatment group, P-ERK, P-JNK, and P-p38 levels all expressed significant reduction compared to control group (Figure 6F). These results suggested that morusin can inhibit RCC growth in vivo.
Figure 6.
Morusin inhibits human renal cell carcinoma growth in vivo. (A) Xenograft tumor volume growth during the treatment period. (B) Volume difference in negative control and treatment group. (C) Tumor morphology in the treatment group (down) and negative control (up). (D) Tumor weight increased after 21 days of treatment. (E) Tumor immunohistochemical analysis for Ki-67 and P27. *, P<0.05, **, P<0.01, and ***, P<0.001 compared to negative control. (F) P38, JNK, and ERK induced by morusin in mice tumor. Every group has three repetition.
Discussion
As a rising global threat for human health, RCC has caused severe fatalities, over 140,000 deaths worldwide each year, necessitating the identification of novel and efficient drugs for its treatment. Traditional RCC iatrotechnics were expensive and owned associated side effects (27). In recent years, anticancer drugs extracted from natural and organic herbs have attracted increasing attention. Morusin is a butenylated flavonoid isolated from the root bark of Moraceae (28,29). As an anticarcinogenic flavonoid, morusin has been reported in many studies to possess strong anticancer biological activity against some cancer cells. In this study, we assessed morusin cytotoxicity and anti-cancer properties in RCC cells. We found that (I) morusin has a cytotoxic effect against RCC cells, which inhibited RCC cell proliferation and migration; (II) morusin induced cell apoptosis and perturbed cell cycle arrest on G1 phase; (III) MAPK signaling pathways were involved in morusin-induced cell toxicity and the phosphorylation inhibitors of p38 and JNK obviously rescued the morusin-induced MAPK signals activation; (IV) Morusin disturbed the expression of cancer biomarkers and inhibited RCC tumor growth in vivo (Figure 7).
Figure 7.
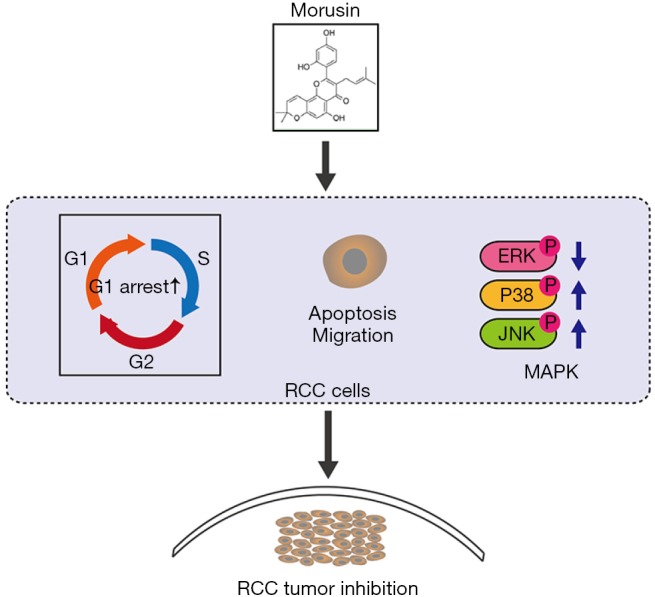
Schematic representation of the anti-cancer effect of morusin in RCC cells. RCC, renal cell carcinoma.
Treating RCC cells with morusin led to a time- and dose-dependent inhibition of their proliferation and migration, similarly to morusin cytotoxicity in glioblastoma cell, prostate cancer cell, gastric cancer cell, and breast cancer cells (10-13). Further assays demonstrated that morusin could induce apoptosis and cell cycle arrest in the G1 phase by activating the expression of Bax, and cleaved-caspase3 and inhibiting expression of Bcl-2 and several cell cycle-related proteins, such as CDK4, CDK6, and Cyclin D1. These results suggested the potential of morusin as an effective therapeutic agent for RCC.
Moreover, morusin exerted cytotoxicity by modulating MAPK signal pathways. It enhanced the P-p38 and P-JNK levels and decreased the P-ERK level in 769-P, 786-O, and OSRC-2 cell lines. A considerable number of studies have demonstrated that MAPK, as part of survival signal pathways, could promote cell proliferation, differentiation, and growth in various cancers (30-32). JNK and p38 have been proposed to function in apoptosis upon stimulation (31,33). Even in RCC cells, it has been shown that MAPK signal pathways are involved in growth and angiogenesis in vivo and that inhibition of MAPK can disrupt the vasculature (34), suggesting that MAPK signal pathways might become a potential therapeutic target for RCC. For further confirming the roles of MAPK signal pathways in morusin-induced RCC cells proliferation, SB203580 and SP600125, the phosphorylation inhibitors of p38 and JNK were pretreated before morusin incubation. Western blotting and CCK-8 assays showed that inhibitors were able to rescue the morusin-induced MAPK signal activation and cell toxicity, which demonstrated the anti-cancer activity of morusin was induced by disturbing MAPK signaling pathways.
Moreover, nude mouse xenograft experiments further confirmed that morusin could inhibit RCC tumor growth in vivo. And coincidentally, during preparation of our manuscript, Hsieh et al. reported that fisetin, a naturally occurring flavonoid, could inhibit RCC cells proliferation and metastasis by downregulating CTSS and ADAM9 through the ERK signaling pathway (35), which also proved that flavonoid has huge potency to treat RCC. In summary, our results highlight that morusin could be a potential alternative neoadjuvant chemotherapeutic agent for RCC. And for further application, the target and mechanism of morusin in RCC need to be explored in future.
Conclusions
To conclude, this study shows that morusin could inhibit the proliferation and migration of RCC cells, arrest cell cycle at G1 phase, and activate cell apoptosis. MAPK signal pathways are confirmed to be involved, in which the phosphorylation levels of p38, JNK and ERK change with morusin exposure. Furthermore, nude mouse xenograft experiments confirm that morusin could inhibit RCC tumor growth in vivo.
Acknowledgments
Funding: This work was supported by the National Natural Science Foundation of China (No. 81930017). We thank the Experimental Animal Room of Xinqiao Hospital for nude mouse xenograft experiments.
Ethical Statement: The authors are accountable for all aspects of the work in ensuring that questions related to the accuracy or integrity of any part of the work are appropriately investigated and resolved. All animal experiments were carried out following the guidelines by the Xinqiao Hospital and the Animal Care and Use Committee of the Third Military Medical University (No. SYXK20070002).
Footnotes
Conflicts of Interest: The authors have no conflicts of interest to declare.
References
- 1.Motzer RJ, Bander NH, Nanus DM. Renal-cell carcinoma. N Engl J Med 1996;335:865-75. 10.1056/NEJM199609193351207 [DOI] [PubMed] [Google Scholar]
- 2.Sánchez-Gastaldo A, Kempf E, González Del Alba A, et al. Systemic treatment of renal cell cancer: A comprehensive review. Cancer Treat Rev 2017;60:77-89. 10.1016/j.ctrv.2017.08.010 [DOI] [PubMed] [Google Scholar]
- 3.Ferlay J, Soerjomataram I, Dikshit R, et al. Cancer incidence and mortality worldwide: Sources, methods and major patterns in GLOBOCAN 2012. Int J Cancer 2015;136:E359-86. 10.1002/ijc.29210 [DOI] [PubMed] [Google Scholar]
- 4.Le ML. Cancer preventive effects of flavonoids - a review. Biomed Pharmacother 2002;56:296-301. 10.1016/S0753-3322(02)00186-5 [DOI] [PubMed] [Google Scholar]
- 5.García-Lafuente A, Guillamón E, Villares A, et al. Flavonoids as anti-inflammatory agents: implications in cancer and cardiovascular disease. Inflamm Res 2009;58:537-52. 10.1007/s00011-009-0037-3 [DOI] [PubMed] [Google Scholar]
- 6.Middleton E, Kandaswami C, Theoharides TC. The Effects of Plant Flavonoids on Mammalian Cells:Implications for Inflammation, Heart Disease, and Cancer. Pharmacol Rev 2000;52:673-751. [PubMed] [Google Scholar]
- 7.Woo Y, Shin SY, Hyun J, et al. Flavanones inhibit the clonogenicity of HCT116 cololectal cancer cells. Int J Mol Med 2012;29:403-8. [DOI] [PubMed] [Google Scholar]
- 8.Polier G, Ding J, Konkimalla BV, et al. Wogonin and related natural flavones are inhibitors of CDK9 that induce apoptosis in cancer cells by transcriptional suppression of Mcl-1. Cell Death Dis 2011;2:e182. 10.1038/cddis.2011.66 [DOI] [PMC free article] [PubMed] [Google Scholar]
- 9.Zhang J, Liu L, Wang J, et al. Formononetin, an isoflavone from Astragalus membranaceus inhibits proliferation and metastasis of ovarian cancer cells. J Ethnopharmacol 2018;221:91-9. [DOI] [PubMed] [Google Scholar]
- 10.Park D, Ha IJ, Park SY, et al. Morusin Induces TRAIL Sensitization by Regulating EGFR and DR5 in Human Glioblastoma Cells. J Nat Prod 2016;79:317-23. 10.1021/acs.jnatprod.5b00919 [DOI] [PubMed] [Google Scholar]
- 11.Li H, Wang Q, Dong L, et al. Morusin suppresses breast cancer cell growth in vitro and in vivo through C/EBPβ and PPARγ mediated lipoapoptosis. J Exp Clin Cancer Res 2015;34:137. 10.1186/s13046-015-0252-4 [DOI] [PMC free article] [PubMed] [Google Scholar]
- 12.Zhang L, Jiao M, Li L, et al. Tumorspheres derived from prostate cancer cells possess chemoresistant and cancer stem cell properties. J Cancer Res Clin Oncol 2012;138:675-86. 10.1007/s00432-011-1146-2 [DOI] [PMC free article] [PubMed] [Google Scholar]
- 13.Wang F, Zhang D, Mao J, et al. Morusin inhibits cell proliferation and tumor growth by down-regulating c-Myc in human gastric cancer. Oncotarget. 2017;8:57187-200. [DOI] [PMC free article] [PubMed] [Google Scholar]
- 14.Cho SW, Na W, Choi M, et al. Autophagy inhibits cell death induced by the anti-cancer drug morusin. Am J Cancer Res 2017;7:518-30. [PMC free article] [PubMed] [Google Scholar]
- 15.Mitchell TJ, Turajlic S, Rowan A, et al. Timing the Landmark Events in the Evolution of Clear Cell Renal Cell Cancer: TRACERx Renal. Cell 2018;173:611-23. 10.1016/j.cell.2018.02.020 [DOI] [PMC free article] [PubMed] [Google Scholar]
- 16.Smets LA. Programmed cell death (apoptosis) and response to anti-cancer drugs. Anticancer Drugs 1994;5:3-9. 10.1097/00001813-199402000-00001 [DOI] [PubMed] [Google Scholar]
- 17.Kerr JF, Winterford CM, Harmon BV. Apoptosis. Its significance in cancer and cancer therapy. Cancer 1994;73:2013-26. [DOI] [PubMed] [Google Scholar]
- 18.Malumbres M, Barbacid M. Cell cycle, CDKs and cancer: a changing paradigm. Nat Rev Cancer 2009;9:153-66. 10.1038/nrc2602 [DOI] [PubMed] [Google Scholar]
- 19.Massagué J. G1 cell-cycle control and cancer. Nature 2004;432:298. 10.1038/nature03094 [DOI] [PubMed] [Google Scholar]
- 20.Graña X, Reddy EP. Cell cycle control in mammalian cells: role of cyclins, cyclin dependent kinases (CDKs), growth suppressor genes and cyclin-dependent kinase inhibitors (CKIs). Oncogene 1995;11:211-9. [PubMed] [Google Scholar]
- 21.Chang L, Karin M. Mammalian MAP kinase signalling cascades. Nature 2001;410:37-40. 10.1038/35065000 [DOI] [PubMed] [Google Scholar]
- 22.Johnson GL, Razvan L. Mitogen-activated protein kinase pathways mediated by ERK, JNK, and p38 protein kinases. Science 2002;298:1911-2. 10.1126/science.1072682 [DOI] [PubMed] [Google Scholar]
- 23.Low HB, Zhang Y. Regulatory Roles of MAPK Phosphatases in Cancer. Immune Netw 2016;16:85-98. 10.4110/in.2016.16.2.85 [DOI] [PMC free article] [PubMed] [Google Scholar]
- 24.Dunn KL, Espino PS, Bojan D, et al. The Ras-MAPK signal transduction pathway, cancer and chromatin remodeling. Biochem Cell Biol 2005;83:1-14. 10.1139/o04-121 [DOI] [PubMed] [Google Scholar]
- 25.Davies SP, Reddy H, Caivano M, et al. Specificity and mechanism of action of some commonly used protein kinase inhibitors. Biochem J 2000;351:95-105. 10.1042/bj3510095 [DOI] [PMC free article] [PubMed] [Google Scholar]
- 26.Bennett BL, Sasaki DT, Murray BW, et al. SP600125, an anthrapyrazolone inhibitor of Jun N-terminal kinase. Proc Natl Acad Sci USA 2001;98:13681-6. 10.1073/pnas.251194298 [DOI] [PMC free article] [PubMed] [Google Scholar]
- 27.Heng DY. The next 10 years: Challenges for the future and overcoming resistance to targeted therapies for renal cell carcinoma. Can Urol Assoc J 2016;10:S256-8. 10.5489/cuaj.4294 [DOI] [PMC free article] [PubMed] [Google Scholar]
- 28.Zong YY, Ip SP, Dong TX, et al. Determination of morusin in Cortex Mori. Zhongguo Zhong Yao Za Zhi 2007;32:1038-40. [PubMed] [Google Scholar]
- 29.Fawzy GA, Al-Taweel AM, Perveen S. Anticancer activity of flavane gallates isolated from Plicosepalus curviflorus. Pharmacogn Mag 2014;10:S519-23. 10.4103/0973-1296.139787 [DOI] [PMC free article] [PubMed] [Google Scholar]
- 30.Weng MS, Ho YS, Lin JK. Chrysin induces G1 phase cell cycle arrest in C6 glioma cells through inducing p21Waf1/Cip1 expression: Involvement of p38 mitogen-activated protein kinase. Biochem Pharmacol 2005;69:1815-27. 10.1016/j.bcp.2005.03.011 [DOI] [PubMed] [Google Scholar]
- 31.Davis RJ. Signal transduction by the JNK group of MAP kinases. Cell 2000;103:239-52. 10.1016/S0092-8674(00)00116-1 [DOI] [PubMed] [Google Scholar]
- 32.Lenczowski JM, Dominguez L, Eder AM, et al. Lack of a role for Jun kinase and AP-1 in Fas-induced apoptosis. Mol Cell Biol 1997;17:170-81. 10.1128/MCB.17.1.170 [DOI] [PMC free article] [PubMed] [Google Scholar]
- 33.Nebreda AR, Porras A. p38 MAP kinases: beyond the stress response. Trends in Biochemical Sciences 2000;25:257-60. 10.1016/S0968-0004(00)01595-4 [DOI] [PubMed] [Google Scholar]
- 34.Dan H, Yan D, Wang-Mei L, et al. Inhibition of MAPK kinase signaling pathways suppressed renal cell carcinoma growth and angiogenesis in vivo. Cancer Res 2008;68:81-8. 10.1158/0008-5472.CAN-07-5311 [DOI] [PubMed] [Google Scholar]
- 35.Hsieh MH, Tsai JP, Yang SF, et al. Fisetin Suppresses the Proliferation and Metastasis of Renal Cell Carcinoma through Upregulation of MEK/ERK-Targeting CTSS and ADAM9. Cells 2019. doi: . 10.3390/cells8090948 [DOI] [PMC free article] [PubMed] [Google Scholar]


