We are moving into the precision medicine era, one core concept of which is providing patients with evidence-based and individualized care. Traditional clinical research can evaluate the effectiveness of one medicine or therapy rigorously. Their conclusions, however, are usually valid only for a selected group of patients. The patient-specific disease risk, surgical mortality, or long-term complication always require validated predictive models to assess (1).
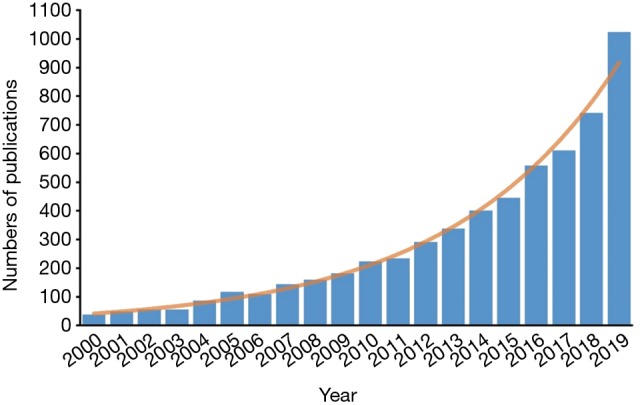
During the past two decades, the number of publications with “predictive model” or “risk score” in their titles has been increased exponentially (Figure 1). These models were mostly developed by clinicians, without the help from professional statisticians. Although these models usually geared toward the most clinically relevant topics, they were also more likely to be associated with methodological flaws. To address these challenges, in 2015, the transparent reporting of a multivariable prediction model for individual prognosis or diagnosis (TRIPOD) statement was published, with the aim of helping clinicians develop methodologically sound predictive models (2). Although it provides a standard framework of reporting prediction model, in the real practice, mining clinical data and developing methodologically sound models still require intensive clinical and statistical expertise.
Figure 1.

The number of publications with “predictive model” or “risk score” in their titles.
In this issue, Zhou et al. presented an excellent summary about building and validating a predictive model using R language (3). This article is of great value in two ways: first, it serves as a step-by-step guidebook that walks clinical readers through how to build a predictive model; second, the authors provided considerable R sample codes, enabling readers to get started quickly.
Zhou et al. summarized the entire process of building a prediction model into five steps: (I) capitalization of the initial letter conceptualization. In this phase, an investigator shall clearly define the research question, consider whether the necessary conditions to conduct a clinical prediction model are met, and select an appropriate model type—a classifier or regressor. (II) Data preprocessing, in which an investigator identifies outliers and interpolates missing values. There is a principle of this part—no best, only better. (III) Variable selection in multivariate regression analysis is the third part, where important variables are selected from thousands of candidates. (IV) Model selection. In this article, the authors mainly discussed logistic regression, Cox proportional-hazards regression, competitive risk model, Ridge regression, and Lasso regression. Each model has its own scenario where it shines. (V) Model evaluation and implementation. First of all, validation methods can be divided into two forms: internal and external, the differences of which are based on the origin of validation data sets. Various types of measures can be used for evaluating the model performance, such as c-statistics for logistic regression, c-index for Cox regression, and the area under the receiver operating characteristic curve (AUROC). The Net Reclassification Index (NRI) and the Integrated Discrimination Index (IDI) can be used to compare the prediction performance of different models. Besides, nomogram, calibration plot, decision curve analysis, and clinical impact curve can make it much easier for readers to visualize the results and use the models in the clinical settings.
Although the authors did a great job in describing and summarizing various methodologies in prediction model construction, several important issues were missing. For example, sample size estimation is usually a necessary preliminary step before conducting a clinical study. If we plan to develop a clinically useful predictive model, we shall better calculate how many patients are needed before the data collection. However, in this article, the sample size calculation has been little discussed. Nowadays, the PASS Sample Size Software has already provided useful solutions for sample size estimation of regression models. Moreover, the authors did not consider more complex clinical cases or extend their discussion in machine learning algorithms, which has been demonstrated to have excellent predictive performance (4-6). Linear models only reflect the linear relation between two variables x and y. For example, a regression model that predicts height may tell us that for every 1 cm increase in father’s height, 0.7 cm increase in a child’s future height. Similarly, logistic regression reflects the linear relationship between x and ln[p/(1-p)], while Cox regression assumes that there is a linear correlation between predictor variables and the logarithm of proportional hazard. But in the real-world practice, it isn’t very easy to use one model to explain the complex associations between different types of clinical variables. For example, cardiac output (CO) after resuscitation of a patient with septic shock is associated with mortality (7). If CO is too high, it suggests a severe inflammatory response, while a low-than-normal CO indicates insufficient blood supply to tissues. Therefore, the actual association between mortality and CO can be plotted as a U-shaped curve. If researchers use linear models without careful thinking, the results would be biased.
For this case, first of all, we need to incorporate our clinical knowledge into the analysis. We can also make scatter plots to avoid potentially misleading intuitions. Besides, there are two commonly used methods to analyze the nonlinear relationship between variables—the nonlinear transformation of variables and the use of nonlinear models, such as piecewise linear regression and polynomial regression. For instance, we can consider a quadratic equation to fit the relationship between CO and mortality. Nonetheless, it usually takes a lot of energy to find a correct functional form to explain the variables’ nonlinear relationships. And faced with hundreds of variables and millions of data in the age of big data, these traditional methods may be even beyond the reach of human effort. Hence, we would like to comment on the potential usage of machine learning in building the prediction models.
With the development of big data technology and artificial intelligence, machine learning methods such as K-Nearest Neighbor (KNN), Support Vector Machine (SVM), Gradient Boosting Decision Tree (GBDT), Random Forest, Deep Learning and Reinforcement Learning, yield unusually brilliant results in the medical field (4-6). Here we summarize the basic concepts of several common machine learning methods: KNN predicts a patient’s future based on other people who shared similar characteristics with him- or herself (8); SVM tries to find the best cut-off line (hyperplane in data space) to distinguish between negative and positive patients (9); GBDT (10) and Random Forest (11) are based on decision tree, and using them in build risk prediction model would require hundreds of decision trees; Deep learning is a series of new and rapidly growing algorithms (12,13): Convolutional Neural Networks (CNN) dominates the field of image analysis, while Recurrent Neural Networks (RNN) is considered suitable for processing time-series data; Reinforcement learning, inspired by behaviorist psychology, tries to simulate the learning mechanism of reward and punishment (5).
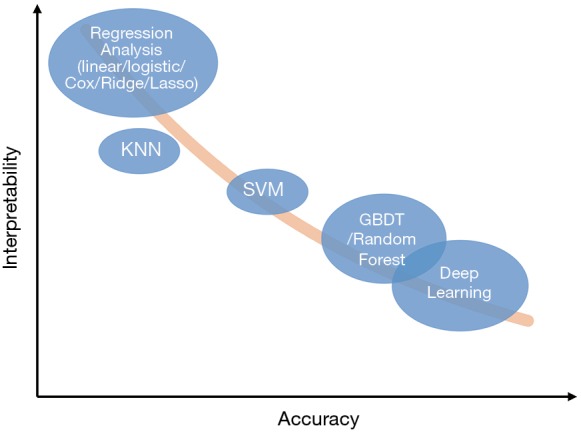
These methods have many advantages compared with linear regression. First, the latest algorithms in the field of machine learning are much more complicated than linear regression so that they can capture complex and high-order relationships between variables and usually can achieve higher accuracy (12). Second, compared with a previous once-for-all risk score, cutting-edge machine learning models can “learn” from the errors and keep optimizing themselves. Third, these models can be used for solving more complex problems, such as “learning” optimal treatment strategies like a clinician (5), or completing auxiliary tasks while making risk prediction. For example, Tomasev et al. constructed their model which was asked to predict the maximum observed values of some variables in the future, while making future acute kidney injury predictions (6). Meanwhile, the complexity of these methods also becomes a barrier for clinicians to understand and trust them, and that’s the reason they have been considered as “a black box” (13-15). Though difficult, many methods try to “open” these black boxes, such as Partial Dependence Plot (PDP), Local Interpretable Model-agnostic Explanations (LIME), SHapley Additive exPlanations (SHAP), Deep Learning Important FeaTures (DeepLIFT) (15). Figure 2 shows the accuracy and interpretability of various machine learning methods. It’s worth noting that this is a general schematic diagram rather than an accurate quantification. Besides, when data size is small, say we only have dozens of samples, the model performance in the validation set could be very disappointing, as the result of “over-fitting” (16).
Figure 2.

Diagram of accuracy and interpretability of different models. KNN, K-Nearest Neighbor; SVM, Support Vector Machine; GBDT, Gradient Boosting Decision Tree.
It’s of considerable significance to have accurate predictive models that can be beneficial to the clinical practice and serve as a foundation for precision medicine. Although we have built regression models using traditional methods for many years, there is still much room for improvement. Zhou et al. provide a detailed instruction and roadmap on how to construct a robust prediction model with R (3), which is a useful reference. On the other hand, considering the disadvantages of the traditional methods, rapidly evolving machine learning methods may give us a new perspective and help to overcome the existing difficulties.
Acknowledgments
Funding: None.
Ethical Statement: The authors are accountable for all aspects of the work in ensuring that questions related to the accuracy or integrity of any part of the work are appropriately investigated and resolved.
Provenance and Peer Review: This article was commissioned by the Editorial Office, Annals of Translational Medicine. The article did not undergo external peer review.
Conflicts of Interest: GWT serves as an unpaid editorial board member of Annals of Translational Medicine from Oct 2019 - Sep 2020. The other authors have no conflicts of interest to declare.
References
- 1.Hunter DJ. Uncertainty in the Era of Precision Medicine. The New England Journal of Medicine 2016;375:711-3. 10.1056/NEJMp1608282 [DOI] [PubMed] [Google Scholar]
- 2.Collins GS, Reitsma JB, Altman DG, et al. Transparent reporting of a multivariable prediction model for individual prognosis or diagnosis (TRIPOD): the TRIPOD statement. BMJ 2015;350:g7594. 10.1136/bmj.g7594 [DOI] [PubMed] [Google Scholar]
- 3.Zhou ZR, Wang WW, Li Y, et al. In-depth mining of clinical data: the construction of clinical prediction model with R. Ann Transl Med 2019;7:796. 10.21037/atm.2019.08.63 [DOI] [PMC free article] [PubMed] [Google Scholar]
- 4.Schinkel M, Paranjape K, Nannan Panday RS, Skyttberg N, Nanayakkara PWB. Clinical applications of artificial intelligence in sepsis: A narrative review. Comput Biol Med 2019;115:103488. 10.1016/j.compbiomed.2019.103488 [DOI] [PubMed] [Google Scholar]
- 5.Komorowski M, Celi LA, Badawi O, et al. The Artificial Intelligence Clinician learns optimal treatment strategies for sepsis in intensive care. Nat Med 2018;24:1716-20. 10.1038/s41591-018-0213-5 [DOI] [PubMed] [Google Scholar]
- 6.Tomasev N, Glorot X, Rae JW, et al. A clinically applicable approach to continuous prediction of future acute kidney injury. Nature 2019;572:116-9. 10.1038/s41586-019-1390-1 [DOI] [PMC free article] [PubMed] [Google Scholar]
- 7.Luo JC, Qiu XH, Pan C, et al. Increased cardiac index attenuates septic acute kidney injury: a prospective observational study. BMC Anesthesiol 2015;15:22. 10.1186/s12871-015-0005-0 [DOI] [PMC free article] [PubMed] [Google Scholar]
- 8.Cover TM, Hart PE. Nearest neighbor pattern classification. IEEE Transactions on Information Theory 1967;13:21-7. 10.1109/TIT.1967.1053964 [DOI] [Google Scholar]
- 9.Cristianini N, Shawe-Taylor J. An introduction to support vector machines and other kernel-based learning methods. Cambridge University Press; 2000. [Google Scholar]
- 10.Friedman JH. Greedy function approximation: A gradient boosting machine. Ann Stat 2001;29:1189-232. 10.1214/aos/1013203451 [DOI] [Google Scholar]
- 11.Breiman L. Random forests. Mach Learn 2001;45:5-32. 10.1023/A:1010933404324 [DOI] [Google Scholar]
- 12.LeCun Y, Bengio Y, Hinton G. Deep learning. Nature 2015;521:436. 10.1038/nature14539 [DOI] [PubMed] [Google Scholar]
- 13.Wang F, Casalino LP, Khullar D. Deep learning in medicine—promise, progress, and challenges. JAMA Intern Med 2019;179:293-4. 10.1001/jamainternmed.2018.7117 [DOI] [PubMed] [Google Scholar]
- 14.Olah C, Satyanarayan A, Johnson I, et al. The building blocks of interpretability. Distill 2018;3:e10. 10.23915/distill.00010 [DOI] [Google Scholar]
- 15.Molnar C. Interpretable machine learning. Available online: https://christophm.github.io/interpretable-ml-book/
- 16.Goodfellow I, Bengio Y, Courville A. Deep learning. MIT press; 2016. [Google Scholar]


