Abstract
Background
Patients with hepatocellular carcinoma (HCC) suffer from a high fatality rate, likely due to increased incidence of tumor relapse and metastasis. Understanding the molecular mechanisms that contribute to HCC development and progression is vital for the discovery of new treatment targets. This study aims to explore the expression profiles and functions of immunoglobulin superfamily member 3 (IGSF3) in HCC.
Methods
We evaluated IGSF3 levels in HCC and normal tissues using bioinformatics, western blot, quantitative real-time PCR (qRT-PCR), and immunohistochemistry. We also conducted proliferation assays, colony formation assays, flow cytometry, cell migration assay, cell invasion assay, qRT-PCR, and western blotting in HCC cell lines. Immunofluorescence and western blotting further used to study the IGSF3 pathway. A mouse xenograft model was utilized to examine the influence of IGSF3 on HCC growth in vivo.
Results
IGSF3 levels were higher in HCC tissues and cell lines. Silencing of IGSF3 via lentiviral vector system (LV) inhibited migration, invasion, and growth of HCC cell lines in vitro as well as tumor growth in vivo. Overexpression of IGSF3 promoted result in vitro. Importantly, we found that IGSF3 activates the NF-κB pathway to promote tumorigenic features in HCC cell lines.
Conclusions
We found that IGSF3 can be used as a novel biomarker for HCC detection. Moreover, IGSF3 elicits HCC progression by activating the NF-κB pathway. As such, our data provides potential options for therapeutic targets in patients with HCC.
Keywords: Immunoglobulin superfamily member 3 (IGSF3), hepatocellular carcinoma (HCC), NF-κB, cancer treatment
Introduction
Hepatocellular carcinoma (HCC) is attributed as third largest cause of cancer-related deaths worldwide, and thus, is a common malignant tumor (1). Clinical characteristics of HCC include invasiveness and poor prognosis. Unfortunately, there are limited therapeutic options for treatment of this disease and despite advances in the clinical mechanisms of HCC, the 5-year survival rate remains low (2). Currently, surgery is the most commonly administered treatment for patients with HCC, but most patients with multifocal development and distant metastases are ineligible for curative surgical treatment (3,4). Therefore, a deeper knowledge of the molecular mechanisms that cause HCC development is extremely important.
Immunoglobulin superfamily member 3 (IGSF3), situated on chromosome 1p13.1 (chr1: 116,574,397–116,667,754), is part of the immunoglobulin (Ig) superfamily. We characterized a novel IGSF3 complement DNA (cDNA) containing a 3648-bp open reading frame that codes for an Ig like membrane protein composed of eight Ig domains. IGSF3 is highly similar in sequence and structure to V7, a surface protein on human leukocytes. IGSF3 mRNA is highly expressed in a range of human tissue, but has particularly high expression in the placenta, kidney, and lungs (5). Previous studies suggest that IGSF3 can be used as a potential biomarker for the eventual development of gemcitabine sensitivity and is a putative target to overcome resistance to gemcitabine in non-small cell lung cancer (NSCLC) patients (6). However, whether IGSF3 has a function during HCC progression is not yet known.
Aberrant stimulation of the NF-κB pathway has been detected across various cancer types (7-9). NF-κB signaling plays a vital role across numerous biological processes, including immune response, differentiation, cell survival, proliferation, and migration. The NF-κB pathway is composed of multiple proteins including an inhibitor of κB (IκB) proteins, IκB kinase (IKK) complex, and NF-κB dimers. In its ‘‘resting’’ state, NF-κB, in association with IκB proteins, remains inactivated in the cytoplasm. Stimulation of the IKK complex leads to phosphorylation, ubiquitination (Ub), and breakdown of IκB proteins. Subsequently, NF-κB complex moves into the nucleus where it activates target genes (8).
In order to identify IGSF3-regulation of HCC, we used human HCC tissues and cell lines as well as a mouse xenograft model, which revealed that IGSF3 overexpression enhances NF-κB signaling.
Methods
Cell lines and clinical tissues
We obtained 49 pairs of HCC and adjacent liver tissues from individuals that had undergone liver tumor resection at the First Affiliated Hospital of Harbin Medical University from January 2016 to January 2018. All participants were asked to sign an informed consent form. The research ethics committee of the hospital approved the study. There were 5 cell lines utilized in this study, including a normal liver cell line (L02) and four HCC cell lines (SK-Hep-1, Huh7, HCCLM3 and HepG2) that were bought from Shanghai Cell Bank of Chinese Academy of Sciences. All human HCC cell lines were grown in DMEM complete medium culture plus 10% fetal bovine serum (FBS) and 1% penicillin/streptomycin and incubated at 37 °C with 5% CO2.
Lentivirus and plasmid transfection
The lentiviral system (LV), short hairpin RNAs (LV-shRNA) and empty control vectors, the overexpression of plasmid and empty control vectors were bought from Genechem, China. Transfection was carried out as per previously established protocols. The sequences of the Lv-shRNAs and ectopic overexpression design (Tables S1,S2).
Table S1. The sequences of the Lv-shRNAs and control design.
| shRNA | Target sequence |
|---|---|
| IGSF3-RNAi(73454-1) | cgCCTTTGAATACGGTACTTA |
| IGSF3-RNAi(73455-1) | cgCAGCAATATCATGTGGCTA |
| IGSF3-RNAi(73456-1) | CaGCACTGATAAGCAATACTT |
| sh CON | TTCTCCGAACGTGTCACGT |
Table S2. The ectopic overexpression design.
| ID | seq |
|---|---|
| IGSF3(58024-2)-p1 | ACGGGCCCTCTAGACTCGAGCGCCACCATGAAGTGCTTTTTCCCGGTGCTGAGC |
| IGSF3(58024-2)-p2 | TTAAACTTAAGCTTGGTACCTTAGTCTATGGCCCCTGGATGGATACTG |
Quantitative real-time polymerase chain reaction analysis (qRT-PCR)
RNA extraction from HCC cell lines and tissues were conducted with Trizol solution, and cDNA was generated using the First Strand cDNA Synthesis kit ReverTra Ace (Toyobo, Japan) after RNA quantification. Power SYBR Green PCR Master Mix (Life Technologies, Carlsbad, CA, USA) was used to do the qRT-PCR. IGSF3 levels were normalized to that of GADPH. The primer sequences of IGSF3 and GADPH was designed by GeneGray (Shanghai, China). The sequence of primers for qRT-PCR (Table S3).
Table S3. The sequence of primers for qRT-PCR.
| Gene | Forward primer (5’-3’) | Reverse primer (5’-3’) |
|---|---|---|
| IGSF3 | GTCTCCAGCCGAACAGTGAAT | GTGGTATGCTATGACCCGAAAG |
| GAPDH | AACTTTGGGATTGTGGAAGG | ACACA TTGGGGGTAGGAACA |
qRT-PCR, quantitative real-time polymerase chain reaction.
Western blotting analysis and immunohistochemistry
Radioimmunoprecipitation assay (RIPA) buffer composed of 1% protease and 10% phosphatase inhibitors was used to prepare total protein extracts. The samples were electrophoresed using a 10% SDS-PAGE gel, and then transferred onto nitrocellulose membranes (Invitrogen, Carlsbad, CA, USA). The membranes were then placed in a solution containing antibodies specific to IGSF3, proliferating cell nuclear antigen (PCNA), cyclin A, cyclin E, cyclin-dependent kinase 1 (CDK1), cyclin-dependent kinase 2 (CDK2), NF-κB, p-NF-κB, IKBα, p-IKBα, and laminB overnight (the different dilutions of the antibodies are 1:400, 1:250, 1:250, 1:400, 1:400, 1:400, 1:400, 1:400, 1:400, 1:400 and 1:1,000 respectively). Next, the membranes were washed and placed in a solution containing secondary antibodies for 1 hr at room temperature. Western blot signals were imaged using ECL kit (Haigene, China). Primary antibodies with indicated concentration for WB, IHC, IF (Table S4).
Table S4. Primary antibodies with indicated concentration for WB, IHC, IF.
| Antibody | Dilution | Company | Cat No. | ||
|---|---|---|---|---|---|
| WB | IHC | IF | |||
| IGSF3 | 1:400 | 1:400 | 1:50 | Bioss | Bs-9196R |
| PCNA | 1:250 | BOSTR | BM0104 | ||
| cyclin A | 1:250 | BOSTER | A00700 | ||
| cyclin E | 1:400 | BOSTER | A00543-1 | ||
| CDK1 | 1:400 | BOSTER | BM0027 | ||
| CDK2 | 1:400 | BOSTER | PB0562 | ||
| p-IKBα | 1:400 | Wanleibio | WL03120 | ||
| IKBα | 1:400 | Wanleibio | WL02495 | ||
| IKBα | 1:200 | Beyotime | AF1282 | ||
| p-NF-κB | 1:400 | Wanleibio | WL02169 | ||
| NF-κB | 1:400 | Wanleibio | WL01273b | ||
| NF-κB | 1:200 | Beyotime | AF1234 | ||
| GAPDH | 1:800 | BOSTER | BM3876 | ||
| Ki-67 | 1:200 | BOSTER | PB0065 | ||
| Lamin B | 1:1,000 | Bioss | bs-1840R | ||
| β-action | 1:800 | Bioss | bsm-33036M | ||
Cell proliferation, migration, and Matrigel invasion assay
We used the Costar 24 well insert system (Life Technologies, corning, USA) to perform cell migration assay. Approximately 2–4×10⁵ cells in 100 µL serum-free culture medium were seeded in the upper chambers, and 15% FBS was added in the lower chamber. For invasion assay, 40 µL of Matrigel (BD Biosciences, San Jose, CA, USA) was applied to pre-filter 4H for filtering. The follow-up procedure was the same as that of the migration test. After incubation for 24–48 hours at 37 °C and 5% CO2, the cells that did not migrate were still on the upper chamber of the filter. Through the use of an optical microscope, we were about to count the cells penetrating the membrane after being fixed in methanol and stained with crystal violet.
Cell cycle and DNA analysis
The cell cycle and apoptosis analysis kit (Beyotime, China) was used to count the percentage of cells that were in the G0/G1, S and G2/M phase, as determined by flow cytometry and established protocol.
Immunofluorescence (IF) assay
Cells were counted and placed onto polylysine-coated coverslips, after which they were cultured for 24 h, fixed with 4% paraformaldehyde, and permeabilized with 0.5% Triton-X-100. Subsequently, cells were incubated with primary antibodies, secondary antibodies and DAPI, respectively. The images were taken using a microscopic camera.
Xenograft nude mouse model
All experiments comprising animals were granted approval by the Animal Ethics Committee of Harbin Medical University, China. BALB/c nude mice that were 4 weeks of age were bought from the Beijing Vital River Laboratory Animal Technology (Beijing, China). Xenografts developed following subcutaneous injection of 1×10⁶ cells in 100 uL PBS into the flank. Four weeks later, the tumors were resected and their volume and weights were documented.
Statistical analyses
Experiments were carried out three times each. Statistical analyses were performed through the use of Prism version 6.0 (GraphPad Software, LaJolla, CA, USA) software. Results were represented as mean ± standard deviation (SD) and analyzed using either student’s t-test or the one-way analysis of variance (ANOVA). Correlations were determined using Pearson’s correlation analysis. P<0.05 represents the threshold for statistical significance.
Results
Profiles of IGSF3 in HCC
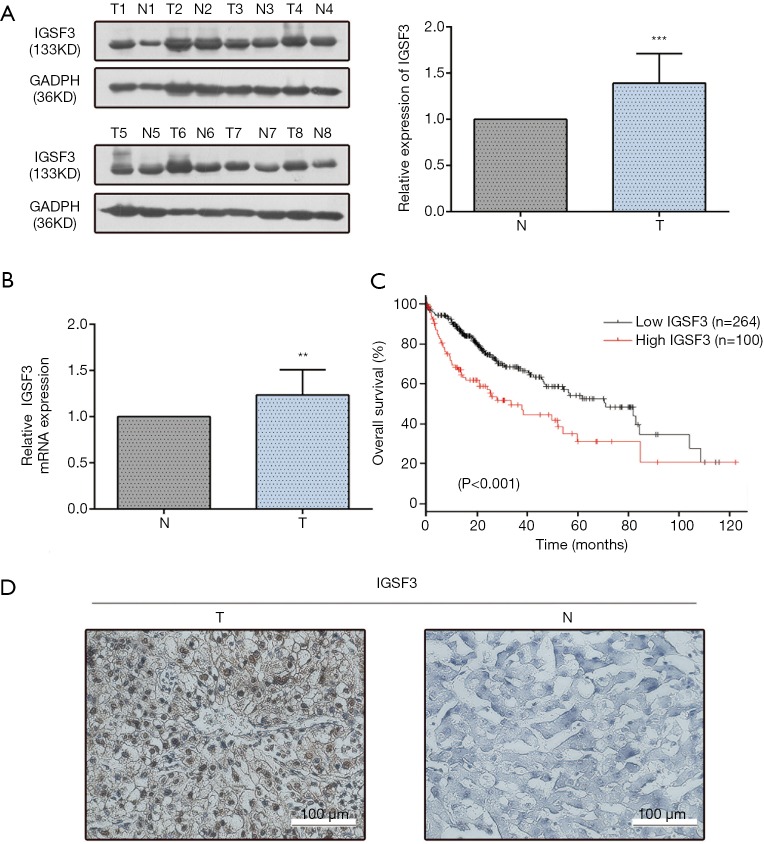
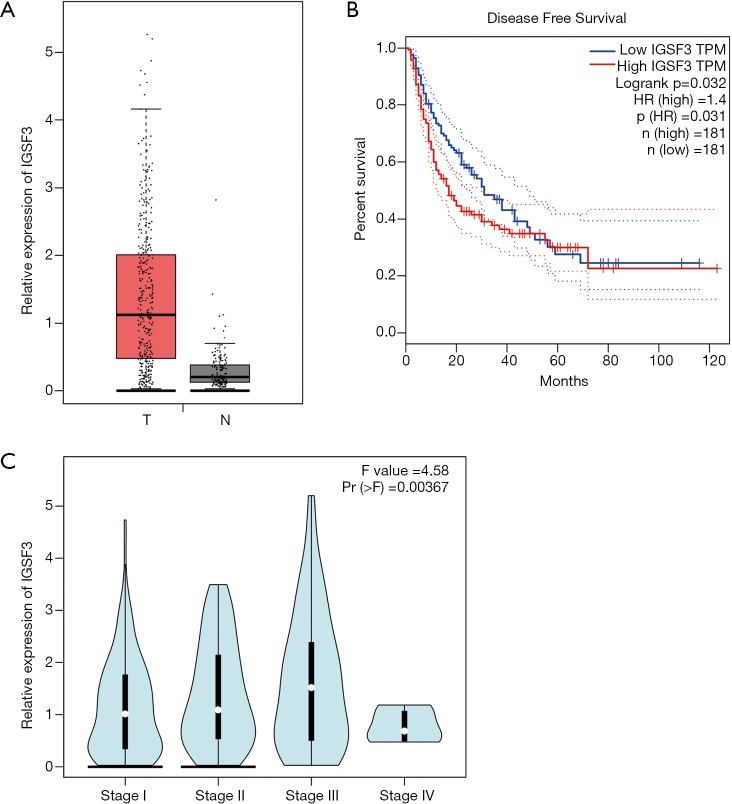
IGSF3 were detected in 369 HCC and 160 non-tumor liver tissues in GEPIA (gepia.cancer-pku.cn). Using a false discovery rate of less than 0.05 and |log2 fold-change| greater than 1 as the cut-off criteria, we evaluated IGSF3 expression in HCC and non-tumor liver tissues, as shown in Box Plot (Figure S1A). In order to validate the clinical relevance of IGSF3 in patients with HCC, we conducted IHC staining, western blotting and qRT-PCR on HCC samples from 49 patients (Figure 1). IHC and western blotting results indicate that protein levels of IGSF3 are significantly higher in HCC tumor tissues versus adjacent non-tumor tissues (Figure 1A,D), which was further validated upon analysis of IGSF3 mRNA expression in HCC and adjacent normal liver tissues (Figure 1B). Moreover, clinical and pathological analysis indicated than increased IGSF3 levels are positively correlated with tumor mass (P=0.0001), TNM stage (P=0.0002), and lymph node metastasis (P=0.0045) (Table S5). Intriguingly, overall survival (OS) in patients with high IGSF3 expression was considerably worse in comparison to patients with lower IGSF3 expression (P=0.00022) (Figure 1C), as determined through liver cancer RNA-seq data from the Kaplan Meier Plotter (kmplot.com). The disease-free survival (RFS) of patients with high IGSF3 according to data from GEPIA is shown (Figure S1B) by selecting a median Group Cutoff. Furthermore, IGSF3 was found to have a significant effect on HCC pathological stage (P=0.00367) (Figure S1C). Overall, this data indicates that IGSF3 is highly expressed in patients with HCC and can be a predictive marker for HCC survival.
Figure 1.
IGSF3 expression profiles in HCC and paired non-tumorous samples. (A) A representative western blotting image of IGSF3 in HCC and adjacent non-pathogenic liver tissues. T: tumor; N: adjacent normal liver tissues; (B) relative mRNA expression of IGSF3 in HCC and normal tissue pairs as measured by qRT-PCR; (C) Kaplan-Meier plot of OS of HCC patients with high or low IGSF3; (D) IHC image of IGSF3 expression levels in representative HCC and adjacent normal liver tissues. All experiments were conducted three times. Data is represented as mean ± SD (*, P<0.05; **, P<0.01; ***, P<0.001).
Table S5. Relationship between IGSF3 expression and clinicopathologic features (n=49).
| Features | Relative IGSF3 expression | P value | |
|---|---|---|---|
| Low (n=23) | High (n=26) | ||
| Age | 0.2092 | ||
| ≤50 | 4 | 9 | |
| >50 | 19 | 17 | |
| Sex | 0.1944 | ||
| Male | 22 | 21 | |
| Female | 1 | 5 | |
| AFP (μg/L) | 0.5276 | ||
| ≤400 | 15 | 20 | |
| >400 | 8 | 6 | |
| HBV | 0.7471 | ||
| Positive | 7 | 6 | |
| Negative | 16 | 20 | |
| Tumor diameter (cm) | 0.0001 | ||
| ≤5 | 19 | 7 | |
| >5 | 4 | 19 | |
| TNM stage | 0.0002 | ||
| I–II | 18 | 6 | |
| III–IV | 5 | 20 | |
| Vascular invasion | 0.1250 | ||
| Yes | 17 | 24 | |
| No | 6 | 2 | |
| Lymph node metastasis | 0.0045 | ||
| Yes | 0 | 8 | |
| No | 23 | 18 | |
Significance figures are P values for Fisher’s exact test.
IGSF3 enhanced HCC cell proliferation in vitro
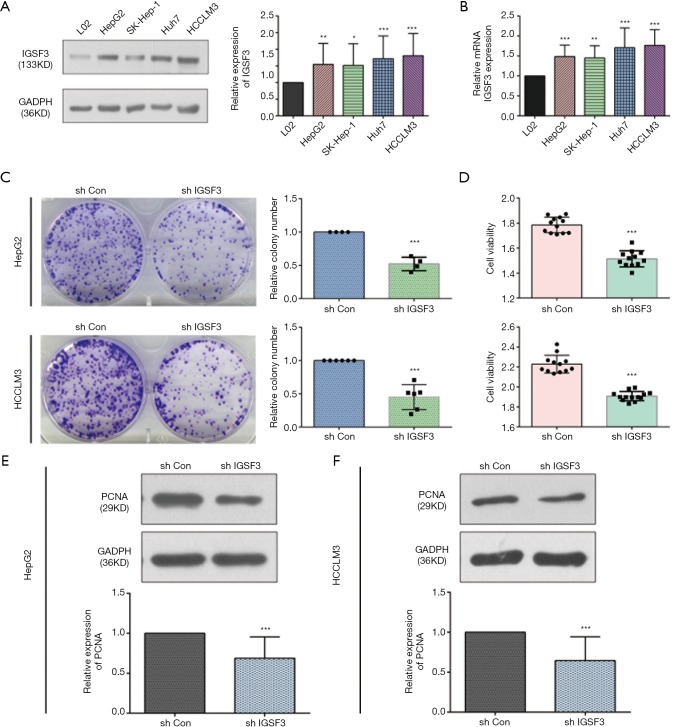
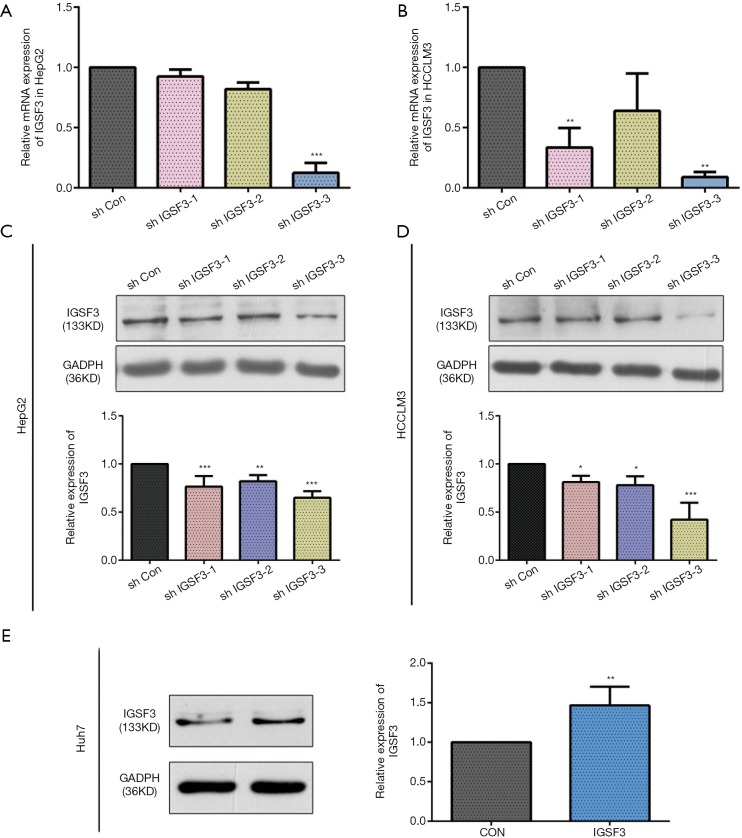
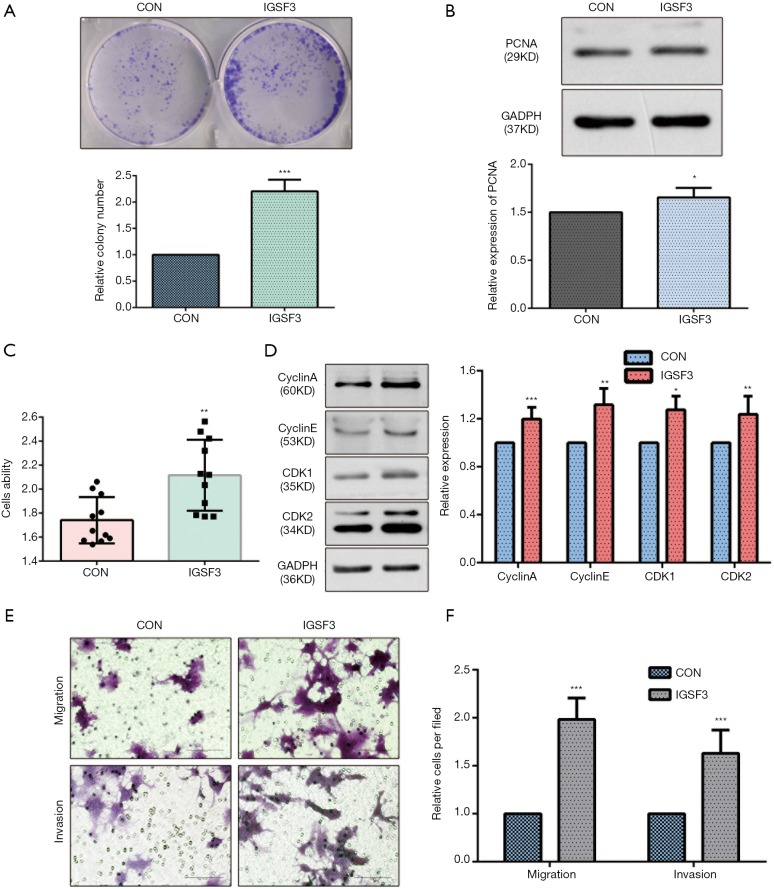
Before conducting functional analysis, we evaluated expression of IGSF3 mRNA and protein in HCC cell lines with diverse potential for metastasis. In comparison to a non-pathogenic liver cell line (L02), IGSF3 was found at much higher levels in HCC cell lines (SK-Hep-1, Huh7, HCCLM3 and HepG2), particularly in the highly metastatic HCCLM3 cell line (Figure 2A,B). Next, we conducted loss-of-function experiments by knocking down IGSF3 expression in HepG2 and HCCLM3 cells by lentiviral (Lv) transfection and overexpression IGSF3 in Huh7 cell line by plasmid. We validated Lv-shRNA-3 as the optimal candidate for reducing IGSF3 expression by western blotting and qRT-PCR (Figure S2A,B,C,D), and validated the expression of overexpression IGSF3 by western blotting (Figure S2E). Colony formation assays exhibited that knock down of IGSF3 impaired the foci formation capacity (Figure 2C) of HCCLM3 and HepG2 cells. Additionally, the WST-1 assay showed that IGSF3 knock down reduced HCCLM3 and HepG2 cell proliferation (Figure 2D). Notably, PCNA levels in these cells were initially elevated but eventually attenuated after knockdown of IGSF3 (Figure 2E,F).After then, we used the colony formation, WST-1,western bolt of the expression of PCNA to test the function of overexpression IGSF3 in Huh7 cell line (Figure S3A,B,C). Taken together, those results suggest that IGSF3 functions to promote tumor progression and growth of HCC cells in vitro.
Figure 2.
IGSF3 promotes HCC cell proliferation in vitro. (A) Western blot analysis of IGSF3 in L02 and HCC cells (left panel); statistical analysis of relative expression IGSF3 level (right panel); (B) relative mRNA expression of IGSF3 in multiple HCC cell lines; (C) a characteristic image of colony formation assay (left panel) and statistical analysis of relative colony number (right panel); (D) cell proliferation ability of HCLLM3 and HepG2 cells transfected with shIGSF3 or shCON as evaluated by WST-1 assay; (E,F) PCNA protein expression in HCLLM3 and HepG2 cells with either shIGSF3 or shCON stable expression (upper panel) and the statistical analysis of relative expression of PCNA (lower panel). All experiments were conducted three times. Data is represented as mean ± SD (*, P<0.05; **, P<0.01; ***, P<0.001).
IGSF3 promotes HCC cell cycle
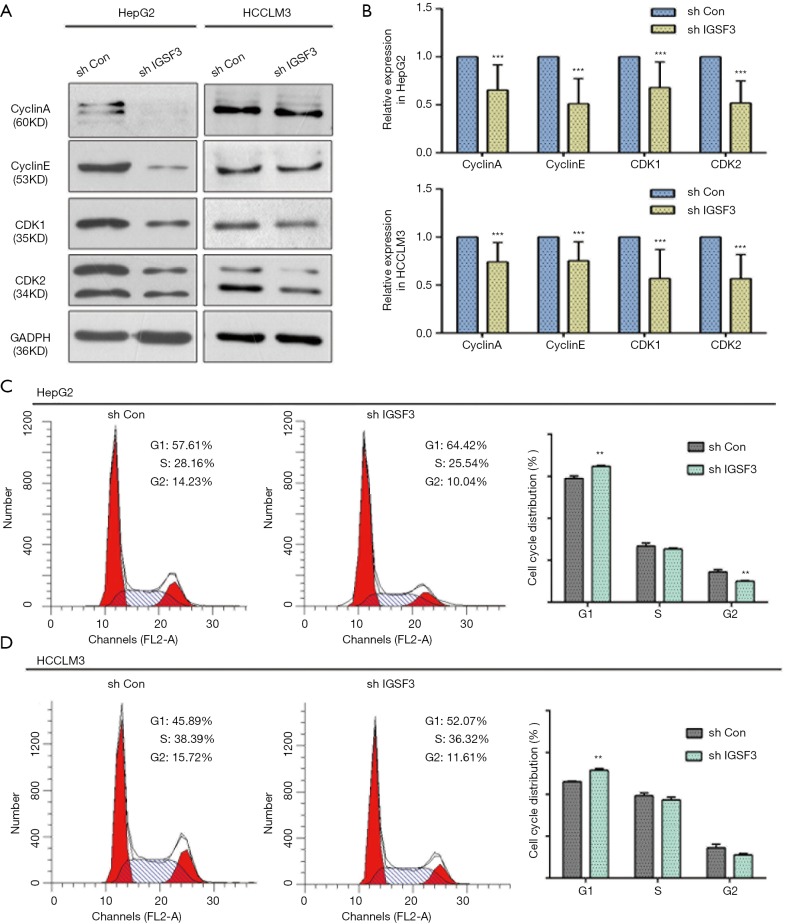
Next, we investigated whether IGSF3 affects HCC cell cycle progression using western blotting and flow cytometry. IGSF3 was found to strongly influence the protein levels of the cell cycle mediators cyclin A and cyclin E as well as the cyclin-dependent kinases (CDKs) 1 and 2 (Figures 3A,B,S3D). Furthermore, knockdown of IGSF3 led to a significantly higher proportion of HCCLM3 and HepG2 cells in G1 phase (Figure 3C,D).
Figure 3.
IGSF3 affects HCC cell proliferation in vitro. (A,B) Western blot analyses of cyclin A, cyclin E, CDK1, and CDK2 levels in HCLLM3 and hepG2 cells. Bar graph shows cyclin A, cyclin D, CDK1, and CDK2 levels in HCLLM3 and hepG2 cells transfected with either shCON or shIGSF3; (C,D) FACS analysis results showing proportion of cells in each phase of the cell cycle. Bar graph shows the results of the number of cells in each phase of the cell cycle. All experiments were conducted three times. Results were indicated as mean ± SD (*, P<0.05; **, P<0.01; ***, P<0.001).
IGSF3 promotes cell migration of invasion of HCC cell in vitro
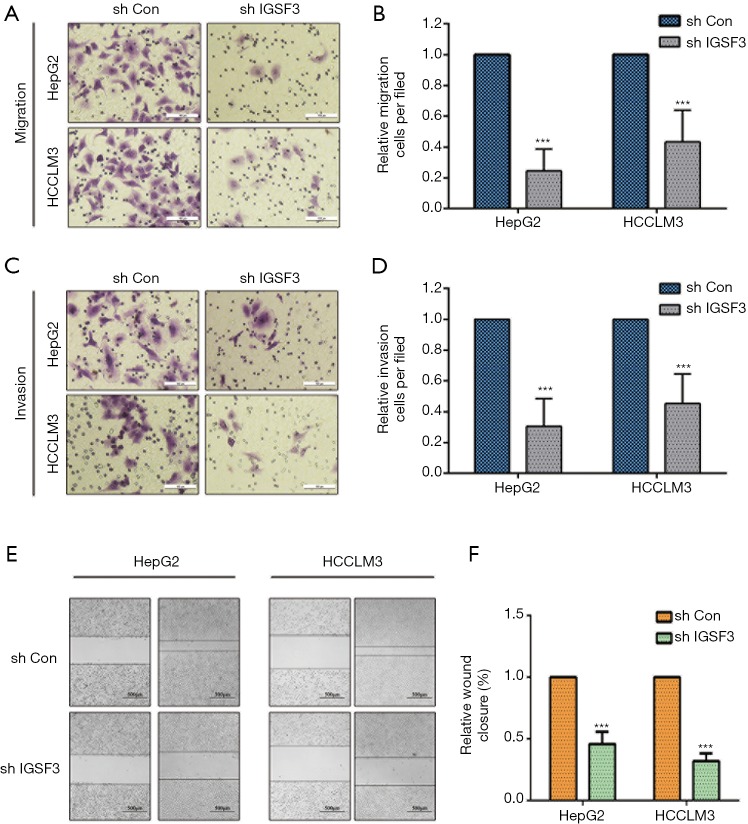
We evaluated whether HCC cell motility and invasion could be affected by IGSF3 expression. Knockdown of IGSF3 in HepG2 and HCCLM3 decreased their motility and invasive behavior (Figure 4A,B,C,D), on the contrary, overexpression of IGSF3 in Huh7 increased motility and invasive behavior (Figure S3E,F). Wound-healing tests exhibited that when IGSF3 was silenced in HepG2 and HCCLM3 cells, cell migration was abrogated (Figure 4E,F).
Figure 4.
IGSF3 enhances HCC cell migration and invasion in vitro. (A,B) Cell migration capability of HCLLM3 and hepG2 cells transfected with either shIGSF3 or shCON as assessed by transwell migration (left panel). Bar graph shows data representing relative number of migration cells in each field; (C,D) cell invasion capability of cells with shIGSF3 or shCON as assessed by transwell migration (left panel). Bar graph shows data representing relative number of migration cells in each field; (E,F) wound healing assays of HCLLM3 and hepG2 with IGSF3 knockdown. All experiments were performed three times. Results were represented as mean ± SD (*, P<0.05; **, P<0.01; ***, P<0.001).
IGSF3 exercises function by activation of the NF-κB signaling pathway
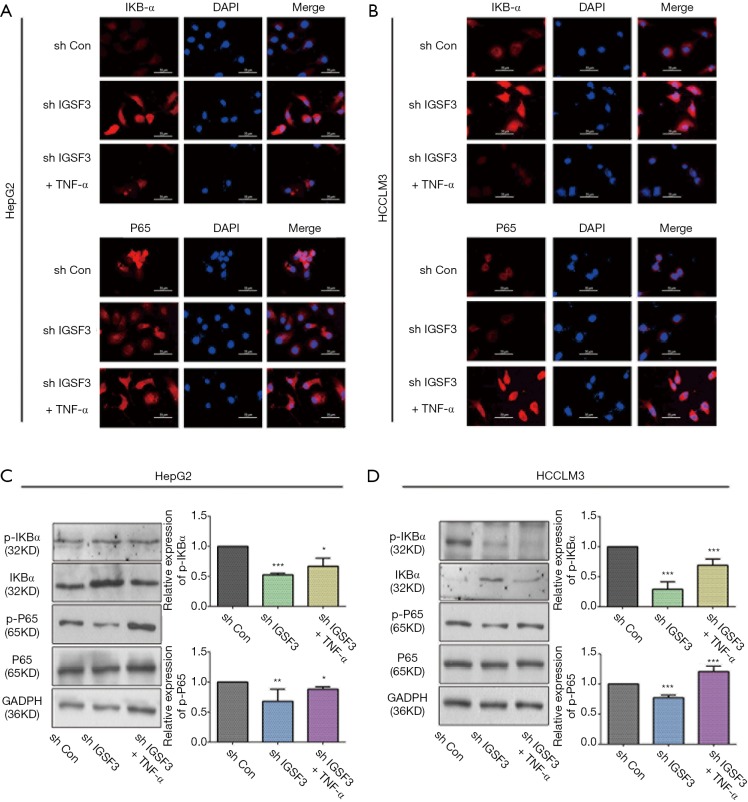
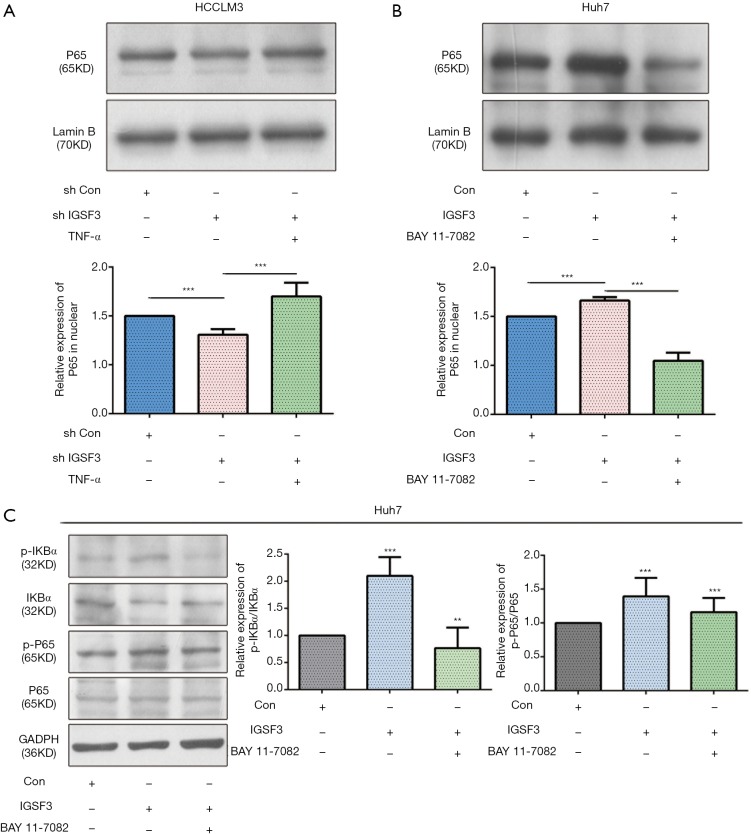
Due to significant effect of IGSF3 on cell growth and metastasis potential of HCC cell lines, we evaluated the connection between IGSF3 and signaling pathways that control tumor growth and metastasis, such as the NF-κB and IKBα pathways. Nuclear translocation of p65 and down-regulation of IKBα was observed in HepG2 and HCCLM3 cells compared to the interference of IGSF3; meanwhile addition of TNF-α reversed the effect as demonstrated by immunofluorescence analyses in the interference of IGSF3 (Figure 5A,B). Western blot analyses of NF-κB, p-NF-κB, IKBα and p-IKBα showed that IGSF3 silencing in HepG2 and HCCLM3 led to a downregulation in p-IKBα/IKBα and p-NF-κB/NF-κB. After addition of TNF-α, levels of p-IKBα/IKBα and p-NF-κB/NF-κB was reversed (Figure 5C,D). Then, Western blot analyses of NF-κB, p-NF-κB, IKBα and p-IKBα showed that overexpression of IGSF3 in Huh7 led to a upregulation in p-IKBα/IKBα and p-NF-κB/NF-κB. After addition of BAY, levels of p-IKBα/IKBα and p-NF-κB/NF-κB was reversed (Figure S4A).
Figure 5.
IGSF3 actives the NF-B signaling pathways. (A,B) Characteristic IF images of NF-κB and IKBα in cell transfected with shCON, shIGSF3 and shIGSF3+TNF-α in representative HCC cell lines; (C,D) Western blot analyses of NF-κB, p-NF-κB, IKBα and p-IKBα expression in the experimental and control group in HCLLM3 and hepG2 cells. Bar graph shows the results of quantification of p-IKBα/IKBα and p-NF-κB/NF-κB. All experiments were performed three times. Results were represented as mean ± SD (*, P<0.05; **, P<0.01; ***, P<0.001).
What’s more, we used western blot to detect the expression of Active NF-κB protein in the nuclear of HCC cell lines (HCCLM3 and Huh7). The results show that the relative expression of active NF-κB in interference IGSF3 group is lower than negative control (shCON) groups in nuclear of HCCLM3 cell, and it can be rescued by added the TNF-α. On the contrary, the relative expression of active NF-κB in IGSF3 up-regulation group is higher than CON groups in nuclear of Huh7 cell, and it can be rescued by added the BAY 11-77082 (Figure S4B,C).
IGSF3 promotes HCC tumor growth in vivo
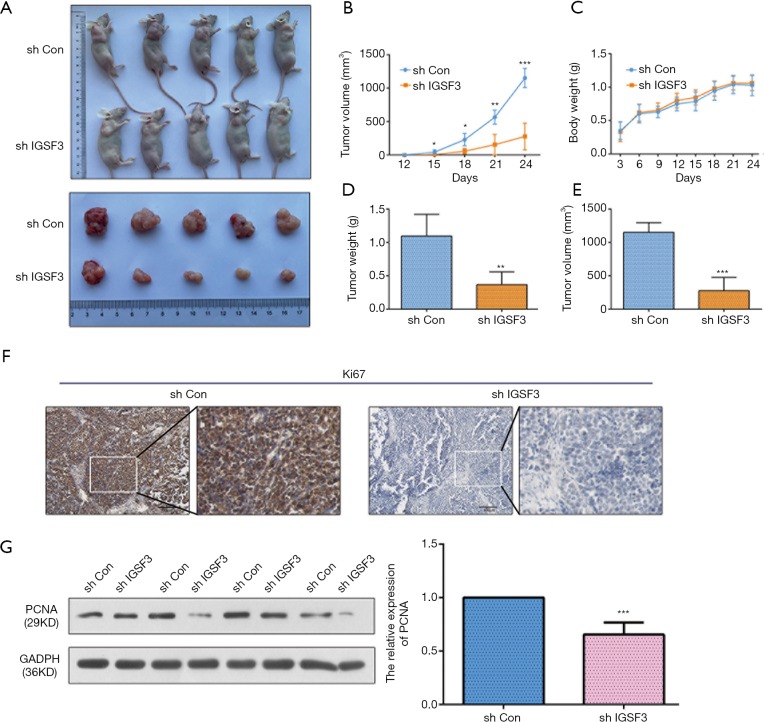
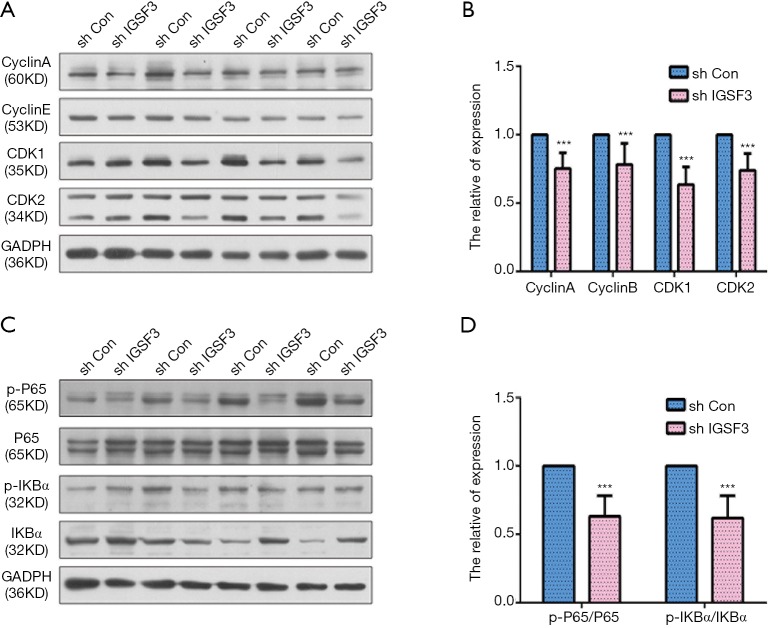
To examine the function of IGSF3 in HCC tumorigenesis, stable transfected cells (HCCLM3-shIGSF3 and controls) were injected subcutaneously into BALB/c nude mice and monitored for 4 weeks to create subcutaneous nude mouse model (Figure 6A). Following 24 days of observation, the mice that were injected with stable HCCLM3-shIGSF3 cells exhibited markedly decreased tumor volumes and weights compared to those injected with control cells, however, there was not different in body weight (Figure 6B,C,D,E), suggesting that IGSF3 promotes HCC cell growth in vivo. Moreover, IGSF3 knockdown significantly reduced the expression of the Ki-67 (Figure 6F). Furthermore, we examined the protein expression of PCNA, the expression of it is down-regulated in HCCLM3-shIGSF3 compared to the control groups (Figure 6G). This data further supports a role for IGSF3 in HCC tumorigenesis and development. Simultaneously, we examined the protein expression of cell cycle regulators cyclin A, cyclin E, CDK1, and CDK2 in the tumor tissues of mice injected with HCCLM3-shIGSF3 and HCCLM3-shCON. Expression of all four proteins were considerably lower in the HCCLM3-shIGSF3 group versus the control group (Figure 7A,B). NF-κB, p-NF-κB, IKBα and p-IKBα expression were also evaluated in HCCLM3-shIGSF3 and HCCLM3-shCON groups, which showed that, similar to in vitro results, p-IKBα/IKBα levels and p-NF-κB/NF-κB were decreased in the HCCLM3-shIGSF3 group (Figure 7C,D). ALL this data indicates that IGSF3 functions in promoting HCC growth in vivo.
Figure 6.
IGSF3 promotes HCC cell proliferation in vivo. (A) Characteristic images of the BALB/c nude mice bearing HCC tumor; (B) the tumor masses were assessed every 3 days; (C) the body weight of xenograft nude mice; (D) the relative weights of tumors; (E) the relative volume of tumors; (F) IHC of ki67 expression in subcutaneous xenograft tumors; (G) Western blot analyses of PCNA in subcutaneous tumor, Bar graph indicates data of PCNA. All experiments were performed three times. Results were represented as mean ± SD (*, P<0.05; **, P<0.01; ***, P<0.001).
Figure 7.
IGSF3 promotes HCC cell cycle and NF-B signaling pathways in vivo. (A) Western blot analyses of cyclin A, cyclin E, CDK1, and CDK2 in liver tissue from tumor xenografts; (B) bar graph indicates data from cyclin A, cyclin D, CDK1, and CDK2 expression; (C) Western blot analyses NF-κB, p-NF-κB, IKBα and p-IKBα in liver tissue from tumor xenografts; (D) bar graph show the results of p-IKBα/IKBα and p-NF-κB/NF-κB expression. All experiments were performed three times. Results were represented as mean ± SD (*, P<0.05; **, P<0.01; ***, P<0.001).
Discussion
Our study demonstrates that IGSF3 functions as a tumor promoter and induces HCC cancer cell growth and invasion by acting through the NF-κB signaling pathways, suggesting that IGSF3 is a possible predictive biomarker and target for HCC treatment. This is supported by our findings that: (I) IGSF3 is significantly higher in HCC tissues and cell lines (SK-Hep-1, Huh7, HCCLM3 and HepG2), (II) a xenograft tumor model demonstrated that IGSF3 promotes the growth of HCC in vivo, (III) IGSF3 enhances cell cycle progression, cell growth, migration, and invasion of HCC cell lines, (IV) reduction in expression of IGSF3 through knockdown significantly reduces the levels of p-NF-κB/NF-κB and p-IKBα/IKBα, and overexpression of IGSF3 has the opposite result, (V) addition of TNF-α reverses the NF-κB signaling pathway in the interference of IGSF3, and addition of BAY 11-7082 reverses the NF-κB signaling pathway in the overexpression of IGSF3. Our study has identified a previously unrecognized role for IGSF3 in promoting HCC.
EWI-3 (IGSF3) is part of the EWI-2 and is associated with CD9 and CD81. Due to its widespread distribution, EWI-2 likely helps participate in the varied functions of CD9 and/or CD81 including fertilization of oocyte, metastasis of tumor, nervous system development, cell proliferation and growth, myogenesis, and viral pathogenesis (10,11). The aforementioned results suggest that IGSF3 has an important function in cancer progression. To our knowledge, this the first study to investigate the function of IGSF3 in promoting the progression of HCC.
IGSF3 is upregulated in HCC cells and tissues. Significantly, knockdown of IGSF3 in a murine xenograft model significantly reduced the growth of HCC. Here, we provide evidence that expression of IGSF3 promotes cell growth and cell cycle progression during the G1/S phase. Cyclins A and E regulate cell cycle by encouraging S phase entry and advancement. We found that cyclin A and cyclin E expression were changed after IGSF3 knockdown. Tumor-associated defects in the cell cycle pathway are regulated by alterations in CDK activity (12,13). Thus, we evaluated expression of CDK1 and CDK2. Our results indicate that CDK1 and CDK2 are downregulated after knockdown of IGSF3 in HCC cell lines and in vivo. These genes regulate cell division, mitotic nuclear division, sister chromatid cohesion, chromosome segregation, DNA repair, replication initiation, DNA replication, regulation of transcription in the G1/S transition of the mitotic cell cycle, and G1/S transition.
Prior studies have demonstrated that IGSF3 plays an imperative role in oncogenesis and metastasis (14). Our data also shows that knockdown of IGSF3 inhibited HCC cell migration and invasion, which are important determinants of tumor metastasis.
Previous studies through principal component analysis (PCA) and Ingenuity Pathway Analysis (IPA) have suggested that IGSF3 may be involved in proteolysis of NFKB Inhibitor Alpha (NFKBIA) (15). NFKBIA, also called IKB-α, belongs to inhibitors of the NF-κB family. Within the structure of IKB-α, there are two serine residues (P), which allow faster Ub and breakdown of proteins when phosphorylated (7). The most common NF-κB signaling pathway involves the use of a receptor and receptor proximal signaling adaptor protein, IκB kinase complex, IκB protein and NF-κB dimer (16). Once cells are stimulated by numerous intracellular and extracellular stimuli, IκB kinase becomes activate, leading to phosphorylation and ubiquitination of the IκB protein. Then IκB protein is broken down and NF-κB dimer is freed. Then, the NF-κB dimer is stimulated to undergo activation by many different post-translational modifications and localizes to the nucleus. Once there, the NF-κB dimer binds to target genes to promote their transcription (17). Due to this, researchers evaluated p-IKBα and IKBα levels in experimental and control group. These results show that knock down of IGSF3 can suppress the expression of p-IKBα/IKBα, and inhibit the NFκB signal pathway, overexpression of IGSF3 can opposite the result. Then, we went one step further and explored expression of NF-κB and p-NF-κB. We found that IGSF3 activates the p-NF-κB/NF-κB pathway by quantifying the protein levels. Additionally, IF results show that IGSF3 reduced IKBα levels and promotes NF-κB localization to the nucleus.
The TNF involves several intermediary proteins and processes, including protein-protein dimerization, phosphorylation of serine, threonine or tyrosine residues, and modifications of polyubiquitination (16,18). Upon ligand binding, the TNF receptors family members stimulate NF-κB pathway activation. Therefore, inhibition of receptor engagement helps prevent signal transduction (9,18). Hence, we added TNF into the IGSF3 knockdown group to investigate whether it can reverse the effect on NF-κB signaling pathway. As expected, western blot analyses showed that TNF promoted expression of p-IKBα/IKBα and p-NF-κB/NF-κB expression. Additionally, IF results also show us that addition of TNF can downregulate IKBα and upregulate NF-κB expression in the nucleus. BAY 11-7082 is a common NF-κB inhibitor. It can inhibit the phosphorylation of IKBα, thus inhibiting the degradation of IKBα and subsequent nuclear transport of NF-κB, and ultimately inhibit the transcription of NF-κB (19-21). Importantly, inhibiting NF-κB signaling, by BAY 11-7082 treatment, rescued overexpression IGSF3 plasmid-induced active NF-κB up-regulation. Overall results indicate that knocking down IGSF3 effectively hinders the NF-κB signaling pathway.
Strategies to suppress NF-κB and cell cycle progression have previously been clinically tested using small-molecule CDK inhibitors, proteasome blockers and IKK inhibitors (9,13,22,23). Our study shows that IGSF3 can promote the phosphorylation of the IKB-α, resulting in promotion of NFKBIA proteolysis and subsequent phosphorylation of the NF-κB. Furthermore, IGSF3 can stimulate cell cycle, migration, and invasion of HCC. Altogether, IGSF3 is a possible biomarker and target for diagnosis and treatment of HCC.
Conclusions
Our analysis of IGSF3 expression showed that it was significantly higher expressed in HCC tissues and closely related to cancer progression. We found that IGSF3 may acting through activation of NF-κB signaling pathway, thereby promoting HCC progression. Therefore, IGSF3 can be used as a predictive biomarker as well as a possible therapeutic target for patients with HCC.
Figure S1.
IGSF3 expression profiles in HCC and paired non-tumorous samples by bioinformatics tool. (A) IGSF3 expression between the HCC and normal liver tissues according to GEPIA. (T: tumor, N: non-tumor); (B) the disease-free survival (RFS) of IGSF3 according to GEPIA (P=0.031); (C) IGSF3 in the HCC pathological stage plot (P=0.00367). All experiments were performed three times. Results were represented as mean ± SD (*, P<0.05; **, P<0.01; ***, P<0.001).
Figure S2.
The efficiency of lentivirus (Lv) transfection and Plasmid transfection. (A,B) Verified lentivirus (Lv) transfection for silencing IGSF3 expression by qRT-PCR; (C,D) verified lentivirus (Lv) transfection for silencing IGSF3 expression by western blotting; (E) plasmid transfection for overexpression IGSF3 expression by western blotting. All experiments were performed three times and data are represented as mean ± SD (*, P<0.05; **, P<0.01; ***, P<0.001).
Figure S3.
Overexpression of IGSF3 promotes the cells proliferation and migration in vitro. (A) A characteristic image of colony formation assay (upper panel) and statistical analysis of relative colony number (lower panel); (B) PCNA protein expression in Huh7 cell with overexpression of IGSF3 or CON stable expression (upper panel) and the statistical analysis of relative expression of PCNA (lower panel); (C) cell proliferation ability of Huh7 cell transfected with overexpression IGSF3 or CON as evaluated by WST-1 assay; (D) Western blot analyses of cyclin A, cyclin E, CDK1, and CDK2 levels in Huh7 cell line. Bar graph shows cyclin A, cyclin D, CDK1, and CDK2 levels in HCLLM3 and hepG2 cells transfected with either shCON or shIGSF3; (E) cell migration capability and cell invasion capability of Huh7 cell transfected with either overexpression IGSF3 or CON as assessed by transwell migration (left panel); (F) bar graph shows data relative number of migration and invasion cells in each field.
Figure S4.
IGSF3 can promote the NF-κB signaling pathways. (A,B) The relative expression of active NF-kB protein in nuclear of HCC cell lines (HCCLM3 and Huh7) by western blot; (C) Western blot analyses of NF-κB, p-NF-κB, IKBα and p-IKBα expression in the experimental and control group in Huh7 cell line. Bar graph shows the results of quantification of p-IKBα/IKBα and p-NF-κB/NF-κB. All experiments were performed three times. Results were represented as mean ± SD (*, P<0.05; **, P<0.01; ***, P<0.001).
Acknowledgments
Funding: This work was supported by Demonstration and Application of Collaborative Network Construction for Clinical Medical Research of Digestive System Diseases (contract grant number: 2015BAI13B00).
Ethical Statement: The authors are accountable for all aspects of the work in ensuring that questions related to the accuracy or integrity of any part of the work are appropriately investigated and resolved. The collection of human specimens was approved by the Biomedical Ethics Committee of The First Affiliated Hospital of Harbin Medical University and the written informed consent were obtained from each patient.
Footnotes
Conflicts of Interest: The authors have no conflicts of interest to declare.
References
- 1.GBD 2015 Mortality and Causes of Death Collaborators. Global, regional, and national life expectancy, all-cause mortality, and cause-specific mortality for 249 causes of death, 1980-2015: a systematic analysis for the Global Burden of Disease Study 2015. Lancet 2016;388:1459-544. 10.1016/S0140-6736(16)31012-1 [DOI] [PMC free article] [PubMed] [Google Scholar]
- 2.Li Y, Tang Y, Ye L, et al. Establishment of a hepatocellular carcinoma cell line with unique metastatic characteristics through in vivo selection and screening for metastasis-related genes through cDNA microarray. J Cancer Res Clin Oncol 2003;129:43-51. 10.1007/s00432-002-0396-4 [DOI] [PMC free article] [PubMed] [Google Scholar]
- 3.Madkhali AA, Fadel ZT, Aljiffry MM et al. Surgical treatment for hepatocellular carcinoma. Saudi journal of gastroenterology: official journal of the Saudi Gastroenterology Association 2015;21:11-17. [DOI] [PMC free article] [PubMed]
- 4.Kessler SM, Hosseini K, Hussein UK, et al. Hepatocellular Carcinoma and Nuclear Paraspeckles: Induction in Chemoresistance and Prediction for Poor Survival. Cell Physiol Biochem 2019;52:787-801. 10.33594/000000055 [DOI] [PubMed] [Google Scholar]
- 5.Saupe S, Roizès G, Peter M, et al. Molecular Cloning of a Human cDNA IGSF3 Encoding an Immunoglobulin-like Membrane Protein: Expression and Mapping to Chromosome Band 1p13. Genomics 1998;52:305-11. 10.1006/geno.1998.5439 [DOI] [PubMed] [Google Scholar]
- 6.Zhang HH, Zhang ZY, Che CL, et al. Array analysis for potential biomarker of gemcitabine identification in non-small cell lung cancer cell lines. Int J Clin Exp Pathol 2013;6:1734-46. [PMC free article] [PubMed] [Google Scholar]
- 7.Zhang Q, Lenardo MJ, Baltimore D. 30 Years of NF-κB: A Blossoming of Relevance to Human Pathobiology. Cell 2017;168:37-57. 10.1016/j.cell.2016.12.012 [DOI] [PMC free article] [PubMed] [Google Scholar]
- 8.Xie C, Zhang LZ, Chen ZL, et al. A hMTR4-PDIA3P1-miR-125/124-TRAF6 Regulatory Axis and Its Function in NF kappa B Signaling and Chemoresistance. Hepatology 2019. [Epub ahead of print]. 10.1002/hep.30931 [DOI] [PMC free article] [PubMed] [Google Scholar]
- 9.Durand JK, Baldwin AS. Targeting IKK and NF-κB for Therapy. Adv Protein Chem Struct Biol 2017;107:77-115. 10.1016/bs.apcsb.2016.11.006 [DOI] [PubMed] [Google Scholar]
- 10.Clark KL, Zeng Z, Langford AL, et al. PGRL is a major CD81-associated protein on lymphocytes and distinguishes a new family of cell surface proteins. J Immunol 2001;167:5115-21. 10.4049/jimmunol.167.9.5115 [DOI] [PubMed] [Google Scholar]
- 11.Stipp CS, Kolesnikova TV, Hemler ME. EWI-2 is a major CD9 and CD81 partner and member of a novel Ig protein subfamily. J Biol Chem 2001;276:40545-54. 10.1074/jbc.M107338200 [DOI] [PubMed] [Google Scholar]
- 12.Malumbres M, Barbacid M. Cell cycle, CDKs and cancer: a changing paradigm. Nat Rev Cancer 2009;9:153-66. 10.1038/nrc2602 [DOI] [PubMed] [Google Scholar]
- 13.Vijayaraghavan S, Moulder S, Keyomarsi K, et al. Inhibiting CDK in Cancer Therapy: Current Evidence and Future Directions. Target Oncol 2018;13:21-38. 10.1007/s11523-017-0541-2 [DOI] [PubMed] [Google Scholar]
- 14.Xie L, Yao Z, Zhang Y, et al. Deep RNA sequencing reveals the dynamic regulation of miRNA, lncRNAs, and mRNAs in osteosarcoma tumorigenesis and pulmonary metastasis. Cell Death Dis 2018;9:772. 10.1038/s41419-018-0813-5 [DOI] [PMC free article] [PubMed] [Google Scholar]
- 15.Watanabe T, Miura T, Degawa Y, et al. Comparison of lung cancer cell lines representing four histopathological subtypes with gene expression profiling using quantitative real-time PCR. Cancer Cell Int 2010;10:2. 10.1186/1475-2867-10-2 [DOI] [PMC free article] [PubMed] [Google Scholar]
- 16.Hayden MS, Ghosh S. NF-κB, the first quarter-century: remarkable progress and outstanding questions. Genes Dev 2012;26:203-34. 10.1101/gad.183434.111 [DOI] [PMC free article] [PubMed] [Google Scholar]
- 17.Gilmore TD. Introduction to NF-kappaB: players, pathways, perspectives. Oncogene 2006;25:6680-4. 10.1038/sj.onc.1209954 [DOI] [PubMed] [Google Scholar]
- 18.Balkwill F. TNF-alpha in promotion and progression of cancer. Cancer Metastasis Rev 2006;25:409-16. 10.1007/s10555-006-9005-3 [DOI] [PubMed] [Google Scholar]
- 19.Li Y, Qin Y, Yang C, et al. Cardamonin induces ROS-mediated G2/M phase arrest and apoptosis through inhibition of NF-κB pathway in nasopharyngeal carcinoma. Cell Death Dis 2017;8:e3024. 10.1038/cddis.2017.407 [DOI] [PMC free article] [PubMed] [Google Scholar] [Retracted]
- 20.Yang Y, Zhou C, Wang Y, et al. The E3 ubiquitin ligase RNF114 and TAB1 degradation are required for maternal-to-zygotic transition. EMBO Rep 2017;18:205-16. 10.15252/embr.201642573 [DOI] [PMC free article] [PubMed] [Google Scholar]
- 21.Fan B, Liu X, Chen X et al. Periostin Mediates Condylar Resorption via the NF-κB-ADAMTS5 Pathway. Inflammation 2019. [Epub ahead of print]. [DOI] [PubMed]
- 22.Okada Y, Kato S, Sakamoto Y, et al. Synthetic lethal interaction of CDK inhibition and autophagy inhibition in human solid cancer cell lines. Oncol Rep 2017;38:31-42. 10.3892/or.2017.5684 [DOI] [PMC free article] [PubMed] [Google Scholar]
- 23.Didonato JA, Mercurio F, Karin M. NF-κB and the link between inflammation and cancer. Immunol Rev 2012;246:379-400. 10.1111/j.1600-065X.2012.01099.x [DOI] [PubMed] [Google Scholar]


