

Abstract
Background
In the intact vessel wall, endothelial cells form a barrier between the blood and the remaining vascular structures, serving to maintain blood fluidity and preventing platelet activation and fibrin clot formation. The spatiotemporal space of this inhibition is largely unknown.
Objective
To assess the local inhibitory roles of a discontinuous endothelium, we developed a vessel‐on‐a‐chip model, consisting of a microfluidic chamber coated with the thrombogenic collagen and tissue factor (TF), and covered with patches of human endothelial cells. By flow perfusion of human blood and plasma, the heterogeneous formation of platelet aggregates and fibrin clots was monitored by multicolor fluorescence microscopy.
Results
On collagen/TF coatings, a coverage of 40% to 60% of human umbilical vein endothelial cells resulted in a strong overall delay in platelet deposition and fibrin fiber formation under flow. Fibrin formation colocalized with the deposited platelets, and was restricted to regions in between endothelial cells, thus pointing to immediate local suppression of the clotting process. Fibrin kinetics were enhanced by treatment of the cells with heparinase III, partially disrupting the glycocalyx, and to a lesser degree by antagonism of the endothelial thrombomodulin. Co‐coating of purified thrombomodulin and collagen had a similar coagulation‐suppressing effect as endothelial thrombomodulin.
Conclusions
In this vessel‐on‐a‐chip system with patches of endothelial cells on thrombogenic surfaces, the coagulant activity under flow is regulated by: (a) the residual exposure of trigger (collagen/TF), (b) the endothelial glycocalyx, and (c) to a lesser degree the endothelial thrombomodulin.
Keywords: blood platelets, endothelial cells, fibrin, hemostasis, microfluidics
Essentials.
In vivo, the endothelial monolayer is known to suppress platelet activation and fibrin formation.
Endothelial cell patches on a thrombogenic surface were subjected to whole blood and plasma flow.
These endothelial cells locally suppressed platelet activation and fibrin formation.
The suppressed clotting was linked to the endothelial glycocalyx and thrombomodulin.
1. INTRODUCTION
In the intact vessel wall, endothelial cells form a necessary barrier between the blood and the underlying vascular structures, thus controlling undisturbed circulation of the blood through the body.1, 2 The prevailing concept is that non‐activated endothelium has antihemostatic activities, thus maintaining blood fluidity, and prevents inflammation by impeding leukocyte adhesion. Damage or injury of the endothelial layer results in loss of its hemostatic protection, with as consequences unrestrained platelet aggregation and a more rapid formation of a fibrin clot.3, 4
In vivo, the endothelial monolayer is known to prevent the activation of flowing platelets by the release of nitric oxide and prostacyclin as well as by nucleotide degradation via surface‐expressed ectonucleoside triphosphate diphosphohydrolase.5, 6, 7 In addition, the endothelial cells can downregulate the coagulation process through several pathways. These include: (a) the surface expression of the glycoprotein thrombomodulin, which regulates the inactivation of thrombin and other coagulation factors via the protein S‐dependent activation of protein C into activated protein C (APC); (b) the membrane anchored tissue factor pathway inhibitor (TFPI), an anticoagulant which also inactivates several coagulation factors;4, 8 and furthermore by (c) the glycocalyx, which provides a physical barrier to blood components and scavenges thrombin, binding to negatively charged glycosaminoglycans such as heparan sulphates.9, 10 However, no more than little is known of the spatiotemporal regulation and the relative importance of these anticoagulant mechanisms.
Damaging of the endothelial barrier results in uncovering of subendothelial matrix components, of which in particular collagen and tissue factor (TF) are considered to be the most active hemostatic components.4, 11, 12 Accordingly, endothelial damage can trigger the activation of platelets (e.g., via the collagen receptor glycoprotein VI) and the TF‐dependent generation of thrombin and fibrin (via the extrinsic coagulation pathway of factor VII).
Since the 1990s, flow chamber models with confluent endothelial cell monolayers have shown that prolonged stimulation of these cells with tumor necrosis factor‐α results in the exposure of TF (stimulating coagulation) and in the release of multimeric von Willebrand factor (stimulating platelet adhesion).13, 14 In recent years, other vascularized microfluidics channels have been developed to also assess the consequences of more severe endothelial disruption, for instance by the free radical‐generating FeCl3 15 or by transchannel fluid pressure.16
In this paper, we developed a different microfluidic model, using nonconfluent endothelial cells grown on physiologically relevant blood‐activating surfaces. We reasoned that the vascular media and atherosclerotic plaques contain high levels of pro‐hemostatic collagens as well as TF.12 On such surfaces with high procoagulant strength, we aimed to determine how nearby endothelial cells could influence platelet and coagulation processes under conditions of flow. As a most commonly studied source, we used human umbilical vein endothelial cells (HUVEC).
2. MATERIALS AND METHODS
2.1. Blood collection and plasma preparation
Human blood was collected from healthy volunteers, after full informed consent according to the Declaration of Helsinki. Subjects did not use antiplatelet medication for at least 2 weeks. Venous blood was collected into 3.2% trisodium citrate Vacuette tubes (Greiner Bio‐One, Alphen a/d Rijn, The Netherlands). Platelet‐free plasma was prepared by centrifuging twice for 10 minutes at 2200g, as described.17 Approval was obtained from the local Medical Ethics Committee.
2.2. Endothelial cell culture
HUVEC (passages 4‐6; Promocell, Heidelberg, Germany) were cultured in endothelial cell growth medium, supplemented with growth medium supplement mix (Promocell), 1% penicillin/streptomycin (Gibco, Waltham, MA), and 1% L‐glutamine (Gibco), after seeding in collagen‐coated flasks (35.5 µg/mL, EMD Millipore, Darmstadt, Germany). Culturing was at 37°C in an atmosphere containing 5% CO2.18
2.3. Microfluidic coating with endothelial cells (vessel‐on‐a‐chip model)
For microfluidic flow chamber experiments, Ibidi µ‐slides I0.2 Luer (height 200 μm, width 5 mm, length 50 mm; Ibidi, Martinsried, Germany) were precoated with Horm collagen type I (75 µL of 50 µg/mL, Takeda, Hoofddorp, The Netherlands) under sterile conditions. After washing with sterile phosphate‐buffered saline, co‐coating was performed with TF (75 µL of 500 pmol/L, Dade‐Behring, Breda, The Netherlands), unless indicated otherwise. This gave an estimated coating density of 15 ng/mm2 collagen and 90 × 106 molecules/mm2 TF.19 Subsequently, HUVEC (around 100 000 cells/slide, passage 4‐6) were seeded on the coated slides, and cultured until a coverage of 40% to 60% was obtained, thus representing a discontinuous endothelial layer. Control microfluidic chambers did not contain HUVEC. For specific experiments, HUVEC were treated with heparinase III (500 mU/mL for 3 hours, Sigma‐Aldrich, Zwijndrecht, The Netherlands) or anti‐thrombomodulin mAb (10 µg/mL for 30 minutes, Acris Antibodies, Herford, Germany), before subjection to blood flow.
2.4. Microfluidic coating with two platelet‐adhesive microspots
For specific experiments, glass coverslips (24 x 60 mm, Thermo‐Fisher, Breda, The Netherlands) were coated with two microspots of Horm collagen type I (2.0 μL of 50 μg/mL) for 1 hour. The upstream microspot was co‐coated with thrombomodulin (1.0 μL, 10 nmol/L), as before.20 After blocking with bovine serum albumin (BSA)‐containing Hepes buffer pH 7.45 (136 mmol/L NaCl, 10 mmol/L Hepes, 2.7 mmol/L KCl, 2 mmol/L MgCl2, 0.1% glucose, 1% BSA), the coverslips were mounted onto a transparent parallel‐plate flow chamber (height 50 μm, width 3.0 mm, length 30 mm), as described before.21
2.5. Platelet adhesion and fibrin formation under flow
Using the endothelial‐covered microfluidic chambers, a two‐step protocol was followed to monitor platelet deposition and ensuing coagulation activation, by adapting a procedure described earlier.19 Immediately before flow perfusion, the cellular nuclei were stained for 10 minutes with Hoechst 33342 (1 µg/mL, Molecular Probes, Waltham, MA). To achieve platelet adhesion, citrated whole blood labeled with DiOC6 (0.5 µg/mL, Anaspec, Fremont, CA) was perfused for 3.5 minutes at a wall shear rate of 500 s−1. After a 2‐minute rinse with modified Hepes buffer pH 7.45 (5 mmol/L Hepes, 136 mmol/L NaCl, 2.7 mmol/L KCl, 0.42 mmol/L, NaH2PO4, 2 mmol/L MgCl2, 2 mmol/L CaCl2, 0.1% glucose, 0.1% BSA), coagulation was induced. Therefore, blood plasma labeled with Alexa Fluor (AF)546‐fibrinogen (5 µg/mL, Invitrogen Life Technologies, Waltham, MA) was coinfused with recalcification medium (10:1, vol/vol; 63.2 mmol/L CaCl2 and 31.5 mmol/L MgCl2), using a y‐tube inlet system, placed immediately before the microfluidic chamber.20 Final wall‐shear rate at this step was 50 s−1 to promote fibrin formation. Where indicated, blocking anti‐thrombomodulin mAb (5 µg/mL) was added to plasma samples.
For experiments with collagen/thrombomodulin microspots in the absence of HUVEC, citrated whole blood was prelabeled with DiOC6 (0.5 µg/mL) and AF546‐fibrinogen (5 µg/mL) and, using the y‐tube inlet system, coperfused with recalcification medium, containing 10 pmol/L TF (shear rate 1000 s−1), similarly as described previously.
Multicolor confocal fluorescence images of appropriate colors were captured with a line‐scanning confocal Zeiss LSM7 microscope (Carl Zeiss, Oberkochen, Germany) and a 63×/1.4 numerical aperture oil immersion objective, as described.21 Brightfield and fluorescence images were captured every 2 minutes. After a total of 10 minutes of plasma perfusion, z‐stacks of endothelial cells, platelets (DiOC6 labeled) and fibrin (AF546 labeled) were taken with 1‐µm steps. Time to first fibrin formation was assessed from recorded images, by observing the presence of fluorescent fibrin fibers, and checked from differential subtracted images, as described in detail previously.19 For the analysis of fibrin formation, images were thresholded to assess the highly fluorescent fibers only, thus eliminating a residual fluorescence from noncleaved fibrinogen binding to platelets.19, 20 As previously assessed, after cleavage by thrombin, the AF546‐fibrin is effectively incorporated into the microscopically visible fibrin fibers. In flow channels, upstream as well as downstream positions were regularly inspected; no heterogeneity in fibrin formation was observed.
2.6. Post‐flow fixation and staining
HUVEC with(out) platelet thrombi on relevant coatings in microfluidic chambers were fixated with 1% paraformaldehyde, after which the cells were permeabilized with 0.005% SDS (unless indicated otherwise), and rinsed with 5% BSA‐containing phosphate‐buffered saline blocking buffer. As appropriate, the cells were subsequently stained with: CF543‐phalloidin (1:200; VWR, Dublin, Ireland); AF647‐labeled anti‐VE‐cadherin mAb (1:200; BD Biosciences, Franklin Lakes, NJ); rat anti‐human thrombomodulin mAb (1:25) followed by AF488‐labeled anti‐rat IgG (1:100, Molecular Probes, Waltham, MA); FITC‐labeled wheat germ agglutinin (WGA, 1:50; Sigma‐Aldrich, Zwijndrecht, The Netherlands); and/or Hoechst 33342 (1:10 000). Staining patterns were evaluated using a Zeiss LSM7 confocal microscope.
2.7. Cell viability assay
Cell viability was assessed by calcein staining according to the manufacturer's protocol (Molecular Probes). In brief, HUVEC were treated with either control buffer or heparinase III (500 mU/mL) for 3 hours in serum‐free medium. As a negative control, HUVECs were incubated with 0.2% Triton X‐100 for 30 minutes. The cells were then stained for 30 minutes with calcein dye (1 µmol/L), after which fluorescence was measured with a Spectramax reader (excitation 485 nm, emission 530 nm). In addition, cells were stained with both Hoechst and calcein dyes, and confocal images were captured to assess percentages of living cells (positive for calcein).
2.8. Data analysis
Microscopic images were analyzed for surface area coverage of the indicated fluorescent stains, and to identify fibrin fiber morphologies, using predefined scripts in Fiji/ImageJ (version 1.48 g: Rasband, National Institutes of Health, Bethesda, MD).22 Nuclei were counted using the ImageJ Cell counter plug‐in. Fluorescent signal profiles were obtained with Zen software (Carl Zeiss). Parameter values were normalized on a scale of 0‐10; subtractions were performed to visualize treatment effects. Heatmaps were generated using the R project version 3.2.5, as described before.21
2.9. Statistical analysis
Data are presented as means ± standard error of the mean. Significance was determined with the Student t‐test or ANOVA for analysis of two or more groups, respectively, by using the program GraphPad Prism 6. P values < 0.05 were considered to be significant.
3. RESULTS
3.1. Microfluidics model of partial coverage of endothelial cells affects platelet aggregation and coagulation activation
In an earlier developed microfluidics technique, a highly thrombogenic surface of collagen and TF was used to consecutively assess platelet deposition and coagulation activation under flow conditions.19 Herein, first perfusion with anticoagulated whole blood allowed to monitor collagen‐dependent platelet activation via glycoprotein VI; and a second perfusion with recalcified plasma served to induce TF‐triggered thrombin generation and ensuing fibrin clot formation. This clotting process appeared to rely on the flow rate,20 the coagulation factors VIII, IX and X,23 and was controlled by plasma‐derived TFPI.19 For the present paper, we converted this method into a “thrombogenic” vessel‐on‐a‐chip model by growing a discontinuous layer of endothelial cells on top of the collagen/TF surface.
Microfluidic chambers, coated with collagen and TF, were cultured with HUVEC to achieve partial coverage of endothelial cells (i.e., 40%‐60% corresponding to around 22 nuclei/field) (Figure 1A). Under these grow conditions, it appeared that the cells developed as patches in the flow channel (Figure 1A) while expressing a normal cytoskeleton structure (phalloidin staining) and the expected surface‐exposed VE‐cadherin (CD144 staining) (Figure 1B). Coloring of non‐permeabilized cells for the presence of potential anticoagulant molecules revealed the presence of a glycocalyx (detected with fluorescent WGA), enriched at cell‐cell contacts, and of thrombomodulin (detected by immuno‐fluorescence staining) (Figure 1C). Both fluorescent probes confirmed the partial cell coverage of around 40% to 60%.
Figure 1.
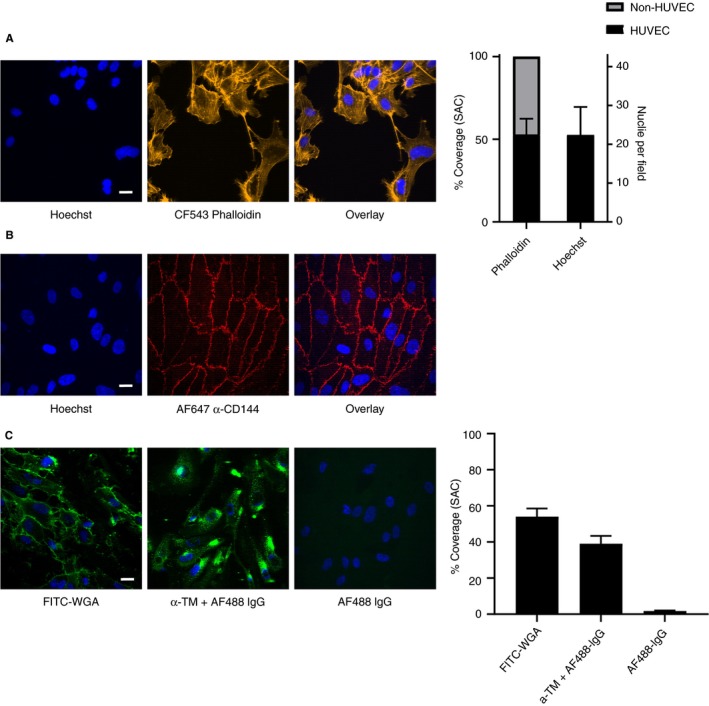
Discontinuous “vessel‐on‐a‐chip” model: nonconfluent endothelial cells on collagen/TF coating in microfluidic chambers. HUVECs were cultured until partial coverage in collagen/TF‐coated microfluidic chambers. (A) Confocal fluorescence images indicating contours of patches of cells and cell‐free areas with 40% to 60% of coverage after staining for nuclei (Hoechst 33342, blue) and F‐actin (CF543‐phalloidin, yellow). Right panel indicating quantification. (B) Confocal fluorescence overlay images after cell staining for nuclei (blue) or plasma membrane (AF647 anti VE‐cadherin mAb, α‐CD144, red). (C) Confocal fluorescence images after staining of HUVEC for nuclei (blue), surface‐exposed glycosaminoglycans (FITC‐labeled wheat germ agglutinin, WGA, green, no permeabilization), surface‐exposed thrombomodulin (rat anti‐thrombomodulin mAb and secondary AF488‐labeled rat IgG, green, no permeabilization); bottom right image indicating control staining with AF488 rat IgG only. Right panel indicating quantification. Bars = 20 µm. N = 3
Microfluidic chambers with HUVEC were perfused with citrate‐anticoagulated whole blood (prelabeled with DiOC6 to stain platelets) at a shear rate of 500 s−1. Over a period of 3.5 minutes, this resulted in the formation of aggregates of DiOC6‐labeled platelets, mostly confined to spots between the patches of endothelial cells. Coagulation was subsequently promoted by perfusion of autologous plasma (with AF546‐labeled fibrinogen) that was recalcified immediately before entering the microfluidic chip, at a low shear rate of 50 s−1. In the chambers containing HUVEC, compared with chambers without endothelial cells, the clotting was substantially delayed, with times to fibrin formation increasing from 2.33 ± 1.53 minutes to 10.60 ± 1.82 minutes (mean ± SD, n = 4, P < .001) (Figure 2A,B). However, platelet surface area coverage was not significantly changed in chambers with or without endothelial cells (18.24 ± 6.31% vs. 11.33 ± 1.53%, respectively) (n = 4). In agreement with a slower onset of fibrin formation (Figure 2C), surface area covered by the fluorescent fibrin fibers lagged behind, when endothelial cells were present (Figure 2D).
Figure 2.
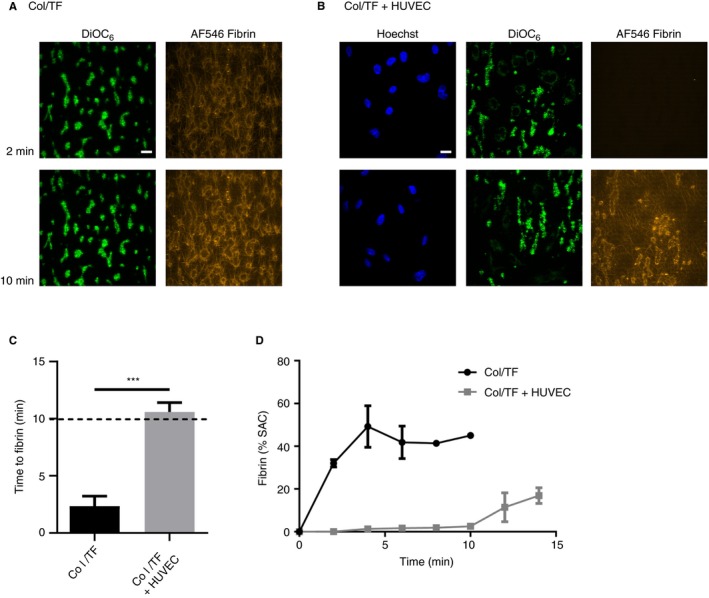
Nonconfluent endothelial cells on collagen/TF coating alter patterns of platelet deposition and fibrin formation under flow. Microfluidic chambers coated with collagen and tissue factor (Col/TF) were cultured with HUVEC until coverage of 40% to 60%, as for Figure 1. Whole blood with DiOC6‐labeled platelets was perfused over the cells to allow platelet deposition (3.5 minutes at wall‐shear rate of 500 s‐1), after which autologous recalcified plasma containing AF546‐fibrinogen was perfused (10 minutes at 50 s‐1, then stasis). Where indicated, chambers were used without HUVEC. Representative confocal fluorescence images from microfluidic chambers (A) without or (B) with HUVEC at indicated times of plasma perfusion. Bar = 20 µm. (C) Times to initial formation of fluorescent fibrin fibers; and (D), surface‐area coverage (%SAC) of fluorescent fibrin. Means ± SEM (n = 3‐5), ***P < 0.001
Control experiments indicated that in the presence of the high‐affinity thrombin inhibitor PPACK no fibrin was formed for >30 minutes. In the absence of TF co‐coating, it also appeared that fibrin formation was markedly delayed, thus indicating a consistent procoagulant activity of the uncovered TF (data not shown). On the other hand, variation of the shear rate or lowering of the coated concentrations of collagen or TF did not substantially modulate the anticoagulant effect of the HUVEC, when compared with the conditions without cells (Figure S1). On BSA‐containing spots, fibrin gradually grew out from the adjacent collagen/TF areas, whereas fibrin formation was only slightly delayed when compared with HUVEC areas (data not shown). Taken together, these results indicated that the patched endothelial cells had a consistent effect in locally delaying and confining the deposition of platelets and the formation of fibrin through the presence of uncovered collagen and TF.
3.2. Localized inhibition of platelet aggregation and fibrin formation by endothelial cells
The heterogeneity in deposition of labeled platelets (DiOC6) and fibrin (AF546) was examined in more detail. Confocal optical z‐stacks for both fluorescent labels, recorded after 15 minutes of plasma flow, indicated that the platelets were deposited at sites where distances between endothelial nuclei (stained with Hoechst 33342) were largest (Figure 3A). Highest fibrin staining was detected close to the platelet thrombi, but was almost absent in areas around the endothelial nuclei. A distinct localization of endothelial cells in comparison to platelets and fibrin was also observed in cross‐sectional fluorescence intensity profiles of endothelial nuclei (Hoechst 33342), platelets (DiOC6), and fibrin (AF546) (Figure 3B). Confocal time movies supported the idea of fibrin fibers originating from mainly the platelet‐rich areas (Video S1).
Figure 3.
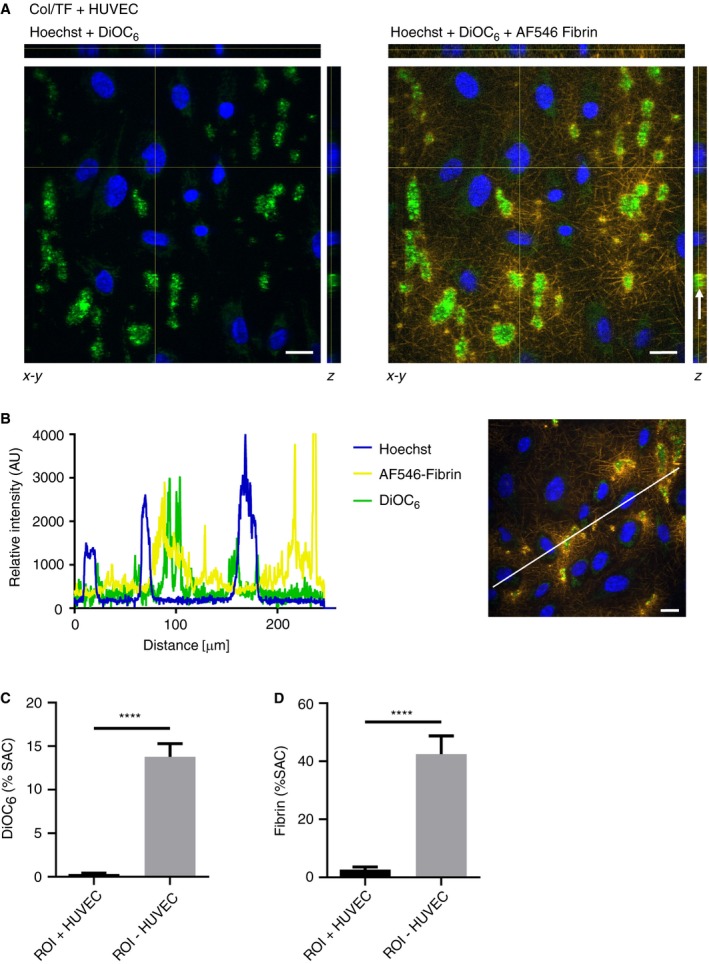
Localized platelet deposition and fibrin formation in endothelial cell‐free areas. Microfluidic chambers with collagen/TF coating and 40% to 60% coverage of HUVEC were subjected to perfusion with whole blood (DiOC6‐labeled platelets), followed by recalcified plasma (AF546‐fibrinogen), for 10 minutes as described for Figure 2. (A), Representative z‐stacks of confocal images to reveal heterogeneous localization of: HUVEC nuclei (Hoechst 33342), platelets (DiOC6), and fibrin (AF546). Stack arrangements are shown as ortholog views with xz projection (upper bars) and yz projection (right bars). Arrow indicates platelet‐rich area containing fibrin staining. Bar = 20 µm. (B) Representative cross‐sectional intensity profiles of endothelial nuclei (Hoechst 33342), platelets (DiOC6) and fibrin (AF546). Right panel illustrates analyzed image. (C‐D) Fluorescence surface‐area‐coverage (%SAC) of rectangular regions of interest (ROI; 14.6 × 14.6 µm) around cell nuclei and distantly from cell nuclei. ROIs were drawn from images of Hoechst staining, without knowing the localization of platelet‐fibrin rich areas. Means ± SEM (n = 7‐13), ****P < 0.0001
To further confirm these findings, the local presence of fibrin was also examined by staining the HUVEC with WGA. Confocal z‐stacks and fluorescence intensity profiles again pointed to the presence of fibrin at sites where the endothelial cells were absent (Figure S2A,B). Comparing the quantification of fluorescence in regions‐of‐interest (ROI) of cell nuclei and in‐between cell nuclei also revealed fluorescence from platelets and fibrin mostly present in the latter ROI (Figure 3C‐D). Taken together, these data pointed to a marked overall delay in the formation of platelet‐fibrin thrombi in the presence of endothelial cells, and to a heterogeneous localization of such thrombi in areas that were not covered by the cells.
3.3. Microfluidic model revealing different anticoagulant mechanisms by endothelial cells
Given the presence of thrombomodulin on the HUVEC surface, we investigated its possible anticoagulant role using an established blocking anti‐thrombomodulin antibody.24 Interestingly, with cells grown on the standard surface of collagen (coated 50 µg/mL) and TF (coated 500 pmol/L), the antibody did not alter times to or rates of fibrin formation (Figure 4A,B). However, when reducing the concentration of coated TF to 5 pmol/L, the antibody treatment led to a significantly enhanced formation of fibrin, still at 40% to 60% coverage of endothelial cells. Kinetic analysis indicated that fluorescent fibrin was formed at faster rate by thrombomodulin blockage (Figure 4B). Also, in this condition, the fibrin fibers were formed at the aggregated platelets in between the patches of endothelial cells.
Figure 4.
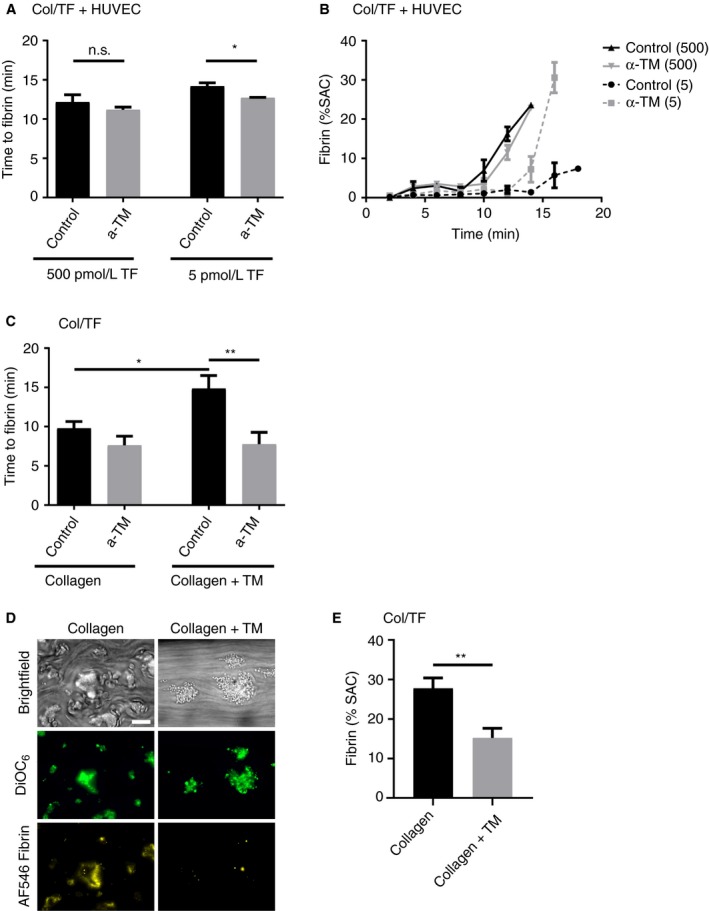
Thrombomodulin on endothelial cells suppresses fibrin formation only at low TF coating. (A‐B) Microfluidic chambers coated with collagen plus TF (5 or 500 pmol/L) and 40% to 60% coverage of HUVEC were treated with blocking anti‐thrombomodulin mAb (α‐TM, 10 µg/mL), as indicated. Cells were then subjected to perfusion with whole blood (DiOC6‐labeled platelets), and for 10 minutes with recalcified plasma (AF546‐fibrinogen), as for Figure 2. Indicated are treatment effects on initial formation of fluorescent fibrin fibers (A), and on fibrin formation kinetics (B) (n = 3‐5). (C‐E) Whole blood was perfused for 10 minutes under recalcification over microspots of collagen plus thrombomodulin (upstream) and collagen alone (downstream) in the presence or absence of anti‐thrombomodulin mAb (10 µg/mL). (C) Recorded was time to initial fibrin formation per microspot. After 6‐minute perfusion, (D) representative microscopic images (E) and quantification of fibrin surface area coverage. Bar = 20 µm. Means ± SEM (n = 10‐11), *P < 0.05; **P < 0.01
To confirm the ability of surface‐immobilized thrombomodulin to suppress fibrin formation under flow, additional microfluidic experiments were performed using two adjacent microspots of coated collagen with or without thrombomodulin, which were then subjected to perfusion with recalcified blood. Markedly, the co‐coating of thrombomodulin resulted in an increased time to fibrin formation and in lower fibrin coverage at platelet thrombi, when compared to the coating of collagen alone (Figure 4C‐E). Platelet deposition and aggregation were essentially unchanged (Figure 4D). As required, the anti‐thrombomodulin antibody affected fibrin formation only at collagen/thrombomodulin spots (Figure 4C). It did not influence the localization of fibrin formation at platelet areas (data not shown). Together, these results pointed to a moderate anticoagulant potential of HUVEC‐expressed thrombomodulin, capable to suppress platelet‐dependent fibrin formation, under conditions where the procoagulant strength by TF is low.
Subsequently, we investigated the possible anticoagulant role of glycosaminoglycans in the endothelial glycocalyx. The HUVEC on collagen/TF (coated 500 pmol/L) were pretreated with heparinase III before blood flow, as a manner to cleave off the negatively charged heparan sulphate side chains.25 This pretreatment did not affect the cell viability (Figure S3). However, in the flow assay, it resulted in a shortening of the time to fibrin formation (Figure 5A). Kinetic analysis indicated that the heparinase‐treated cells mediated a more rapid and pronounced formation of fibrin (Figure 5B). Control flow measurements without HUVEC indicated that heparinase then did not alter the fibrin formation time (6.6 ± 1.7 minutes in comparison to 6.2 ± 1.9 minutes, mean ± SD, n = 6, P = 0.71).
Figure 5.
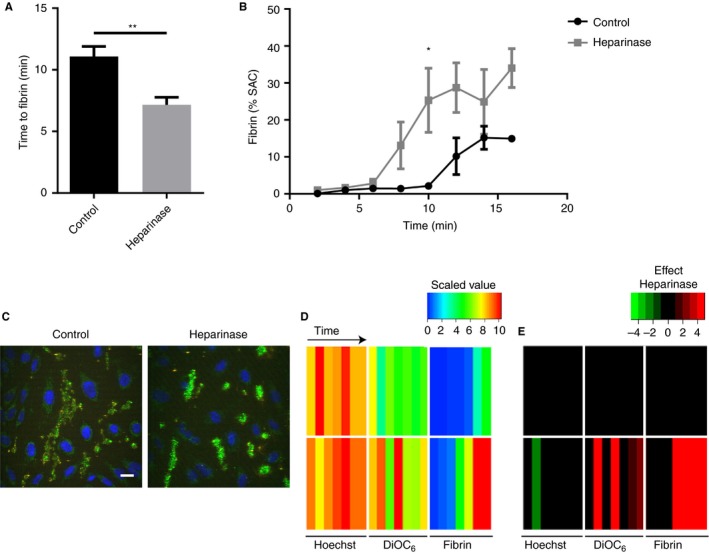
Heparinase treatment of endothelial cells accelerates fibrin formation but not platelet deposition. Microfluidic chambers with collagen/TF coating and 40% to 60% coverage of HUVEC were treated with heparinase III (500 mU/mL) or remained untreated. Cells were then subjected to perfusion with whole blood (DiOC6‐labeled platelets), and for 10 minutes with recalcified plasma (AF546‐fibrinogen), as in Figure 2. (A) Times to initial formation of fluorescent fibrin fibers; (B) surface‐area coverage (%SAC) of fibrin fluorescence over time. (C) Representative images of HUVEC (blue) and platelets (green) in the absence or presence of heparinase treatment. Bar = 20 µm. (D‐E) Parameters for the number of nuclei (Hoechst), platelets (DiOC6), and fibrin SAC were scaled from 0‐10. (D) Scaled parameter values, with rainbow coloring (blue = low, red = high). (E) Subtraction heatmap indicating effect of heparinase treatment (green = decrease, red = increase). Means ± SEM (n = 7), *P < 0.05; **P < 0.01
The HUVEC treatment with heparinase seemed to result in limited platelet adhesion on the endothelial cells (Figure 5C). However, quantification of the overlap of DiOC6 and WGA staining did not show a difference between the heparinase‐treated and control cells (4.02 ± 1.06% vs. 2.90 ± 1.49%, mean ± SD, n = 3, P = 0.35). Kinetic analysis pointed to an overall increase of platelet adhesion and fibrin formation after heparinase treatment, while the HUVEC coverage was unchanged (Figure 5D,E). Summarizing, these data revealed a prominent role for heparan sulphates of the endothelial glycocalyx in the nearby suppression of coagulation.
4. DISCUSSION
In this proof‐of‐principle paper, we describe a novel model for in vitro investigation of the antiplatelet and anticoagulant properties of cultured endothelial cells using microfluidic chambers. By using HUVEC grown on a highly thrombogenic, platelet‐, and coagulation‐stimulating surface (collagen/TF) at partial coverage, it appeared to be possible to examine the local hemostatic control near and at the sites of endothelial cells. This setup thus can mimic in vivo conditions of localized endothelial damage or injury, where also platelet aggregation and fibrin clot formation may be restricted to sites where no vital endothelium is present.
Our approach herein differs from other vessel‐on‐a‐chip methods, mostly using a confluent monolayer of endothelial cells, which is activated with tumor necrosis factor‐α 13, 26 or is damaged mechanically or by FeCl3.15, 16 Those methods can be considered to reflect conditions of inflammation or severe endothelial injury and may lack the presence of a “healthy” endothelium. Markedly, we find that the immediate presence of nonstimulated endothelial cells prevents platelet deposition and delays coagulation, in terms of fibrin fiber formation originating from platelet thrombi on noncovered collagen and TF areas. This is in agreement with earlier studies showing that an undamaged endothelium protects for fibrin formation,27 such in contrast to PS‐exposing platelets adhered to collagen/TF, which promote this process.20, 28 In contrast, studies performed with human adult liver‐derived progenitor cells, expressing TF on their surface, revealed both platelet and fibrin deposition at sites of cell presence.29
In agreement with the present data, it has been described that HUVEC grown in culture expose a limited, but well‐detectable glycocalyx,30 visible by electron microscopy, in spite of the fact that this structure is much thicker in blood vessels.31 The heparan sulphates appear to be the most active GAGs with anticoagulant activity, making up 50% to 90% of the endothelial glycocalyx.9 Degradation of the heparan sulphates by heparinase III in vitro has also been shown by others.25, 30 With the textbook knowledge that negative charges in the glycocalyx serve to inactivate thrombin in an antithrombin‐dependent way, our results are the first to demonstrate experimentally that heparinase‐induced proteolysis of heparan sulphates can affect the anticoagulant potential of endothelial cells under flow conditions. Transgenic, heparanase‐deficient mice show an increased thrombosis tendency after vascular injury,32 which is in agreement with the present data. Also activated platelets may release heparanase, causing the shedding of heparan sulphate proteoglycans from the glycocalyx.33 In the present setting of short‐term flow runs, such a role of platelets is likely limited. On the other hand, in agreement with our findings, another recent study describes increased platelet adhesion under stasis to a HUVEC monolayer pretreated with heparinase.34
Thrombomodulin is a transmembrane glycoprotein, which is present at the luminal side of the endothelial cell vessel wall barrier. When binding thrombin, thrombomodulin converts protein C into APC in a protein S‐dependent manner,35 thus resulting in inactivation of the coagulation factors Va and VIIIa, and thereby preventing the formation of fibrin. In our microfluidics approach, this anticoagulant effect of thrombomodulin on HUVEC was found to be restricted to conditions of low TF, in a similar way as we have reported before for the anticoagulant effect of plasmatic TFPI.19 An explanation for this is that at high TF levels, the amounts of thrombin formed under flow are too high to be targeted the coagulation factor‐inactivating thrombomodulin. In an inflammatory endothelial model, it was also found that the introduction of thrombomodulin suppresses fibrin deposition.26
An advantage of the present vessel‐on‐a‐chip model with non‐inflammatory HUVEC is that the working mechanisms of intact, noninflamed endothelial cells can be studied regarding inhibition of platelets and coagulation. A second advantage is that the method provides detailed spatiotemporal information on the endothelial control of these hemostatic processes. Limitations of the model are that the cultured patches of endothelial cells can differ in properties from confluent endothelial layers, and that the conditions of in vivo hemostasis are only partly mimicked.
In summary, this paper provides a proof‐of‐principle study using a new vessel‐on‐a‐chip model for investigating the local anticoagulant and antiplatelet properties of endothelial cells under whole blood flow conditions. Even at high procoagulant strength, provided by collagen and TF, our data point to a strong, local control of unharmed endothelial cells in regulating these hemostatic processes, with distinct roles of the endothelial glycocalyx and thrombomodulin. The present paper hence might serve as a field opener, based on which further biochemical and mechanistic studies work can be performed.
DISCLOSURES
J.H. is founder and coowner at FlowChamber b.v. Other authors declare that no relevant conflicts of interest exist.
ADDENDUM
S.L.N. Brouns performed experiments, analyzed data, and wrote the manuscript. I. Provenzale and J.P. van Geffen performed experiments and analyzed data. P.E.J. van der Meijden and J.W.M. Heemskerk provided expert supervision and wrote the manuscript.
Supporting information
ACKNOWLEDGEMENTS
Support was obtained from the Cardiovascular Centre (HVC), Maastricht University Medical Centre, the Interreg program Euregio Meuse‐Rhin (Polyvalve), and from the H2020‐MSCA‐ITN‐2017 Marie Skłodowska‐Curie Innovative Training Network, TAPAS 766118.
Brouns SLN, Provenzale I, van Geffen JP, van der Meijden PE, Heemskerk JWM. Localized endothelial‐based control of platelet aggregation and coagulation under flow: A proof‐of‐principle vessel‐on‐a‐chip study. J Thromb Haemost. 2020;18:931–941. 10.1111/jth.14719
Manuscript handled by: Roger Preston
Final decision: Roger Preston, 18 December 2019
REFERENCES
- 1. Siegel‐Axel DI, Gawaz M. Platelets and endothelial cells. Semin Thromb Hemost. 2007;33:128‐135. [DOI] [PubMed] [Google Scholar]
- 2. van Hinsbergh VW. Endothelium–role in regulation of coagulation and inflammation. Semin Immunopathol. 2012;34:93‐106. [DOI] [PMC free article] [PubMed] [Google Scholar]
- 3. Monroe DM, Hoffman M. The clotting system ‐ a major player in wound healing. Haemophilia. 2012;18(Suppl 5):11‐16. [DOI] [PubMed] [Google Scholar]
- 4. Versteeg HH, Heemskerk JW, Levi M, Reitsma PH. New fundamentals in hemostasis. Physiol Rev. 2013;93:327‐358. [DOI] [PubMed] [Google Scholar]
- 5. Goepfert C, Imai M, Brouard S, Csizmadia E, Kaczmarek E, Robson SC. CD39 modulates endothelial cell activation and apoptosis. Mol Med. 2000;6:591‐603. [PMC free article] [PubMed] [Google Scholar]
- 6. Marcus AJ, Broekman MJ, Drosopoulos JH, Pinsky DJ, Islam N, Maliszewsk CR. Inhibition of platelet recruitment by endothelial cell CD39/ecto‐ADPase: significance for occlusive vascular diseases. Ital Heart J. 2001;2:824‐830. [PubMed] [Google Scholar]
- 7. Smolenski A. Novel roles of cAMP/cGMP‐dependent signaling in platelets. J Thromb Haemost. 2012;10:167‐176. [DOI] [PubMed] [Google Scholar]
- 8. White TA, Johnson T, Zarzhevsky N, et al Endothelial‐derived tissue factor pathway inhibitor regulates arterial thrombosis but is not required for development or hemostasis. Blood. 2010;116:1787‐1794. [DOI] [PMC free article] [PubMed] [Google Scholar]
- 9. Alphonsus CS, Rodseth RN. The endothelial glycocalyx: a review of the vascular barrier. Anaesthesia. 2014;69:777‐784. [DOI] [PubMed] [Google Scholar]
- 10. Chappell D, Brettner F, Doerfler N, et al Protection of glycocalyx decreases platelet adhesion after ischaemia/reperfusion: an animal study. Eur J Anaesthesiol. 2014;31:474‐481. [DOI] [PubMed] [Google Scholar]
- 11. Mackman N, Tilley RE, Key NS. Role of the extrinsic pathway of blood coagulation in hemostasis and thrombosis. Arterioscler Thromb Vasc Biol. 2007;27:1687‐1693. [DOI] [PubMed] [Google Scholar]
- 12. Mastenbroek TG, van Geffen JP, Heemskerk JW, Cosemans JM. Acute and persistent platelet and coagulant activities in atherothrombosis. J Thromb Haemost. 2015;13(Suppl 1):S272‐S280. [DOI] [PubMed] [Google Scholar]
- 13. Kirchhofer D, Tschopp TB, Hadvary P, Baumgartner HR. Endothelial cells stimulated with tumor necrosis factor‐alpha express varying amounts of tissue factor resulting in inhomogenous fibrin deposition in a native blood flow system. Effects of thrombin inhibitors. J Clin Invest. 1994;93:2073‐2083. [DOI] [PMC free article] [PubMed] [Google Scholar]
- 14. Westein E, van der Meer AD, Kuijpers MJ, Frimat JP, van den Berg A, Heemskerk JW. Atherosclerotic geometries exacerbate pathological thrombus formation poststenosis in a von Willebrand factor‐dependent manner. Proc Natl Acad Sci USA. 2013;110:1357‐1362. [DOI] [PMC free article] [PubMed] [Google Scholar]
- 15. Ciciliano JC, Sakurai Y, Myers DR, et al Resolving the multifaceted mechanisms of the ferric chloride thrombosis model using an interdisciplinary microfluidic approach. Blood. 2015;126:817‐824. [DOI] [PMC free article] [PubMed] [Google Scholar]
- 16. Sakurai Y, Hardy ET, Ahn B, et al A microengineered vascularized bleeding model that integrates the principal components of hemostasis. Nat Commun. 2018;9:509. [DOI] [PMC free article] [PubMed] [Google Scholar]
- 17. Schols SE, Lance MD, Feijge MA, et al Impaired thrombin generation and fibrin clot formation in patients with dilutional coagulopathy during major surgery. Thromb Haemost. 2010;103:318‐328. [DOI] [PubMed] [Google Scholar]
- 18. van Gorp RM, Broers JL, Reutelingsperger CP, et al Peroxide‐induced membrane blebbing in endothelial cells associated with glutathione oxidation but not apoptosis. Am J Physiol. 1999;277:C20‐C28. [DOI] [PubMed] [Google Scholar]
- 19. Thomassen S, Mastenbroek TG, Swieringa F, et al Suppressive role of tissue factor pathway inhibitor‐alpha in platelet‐dependent fibrin formation under flow is restricted to low procoagulant strength. Thromb Haemost. 2018;118:502‐513. [DOI] [PMC free article] [PubMed] [Google Scholar]
- 20. Swieringa F, Baaten CC, Verdoold R, et al Platelet control of fibrin distribution and microelasticity in thrombus formation under flow. Arterioscler Thromb Vasc Biol. 2016;36:692‐699. [DOI] [PubMed] [Google Scholar]
- 21. de Witt SM, Swieringa F, Cavill R, et al Identification of platelet function defects by multi‐parameter assessment of thrombus formation. Nat Commun. 2014;5:4257. [DOI] [PMC free article] [PubMed] [Google Scholar]
- 22. van Geffen JP, Brouns SLN, Batista J, et al High‐throughput elucidation of thrombus formation reveals sources of platelet function variability. Haematologica. 2019;104:1256‐1267. [DOI] [PMC free article] [PubMed] [Google Scholar]
- 23. Swieringa F, Kuijpers MJ, Lamers MM, van der Meijden PE, Heemskerk JW. Rate‐limiting roles of the tenase complex of factors VIII and IX in platelet procoagulant activity and formation of platelet‐fibrin thrombi under flow. Haematologica. 2015;100:748‐756. [DOI] [PMC free article] [PubMed] [Google Scholar]
- 24. Dargaud Y, Scoazec JY, Wielders SJ, et al Characterization of an autosomal dominant bleeding disorder caused by a thrombomodulin mutation. Blood. 2015;125:1497‐1501. [DOI] [PMC free article] [PubMed] [Google Scholar]
- 25. Mensah SA, Cheng MJ, Homayoni H, Plouffe BD, Coury AJ, Ebong EE. Regeneration of glycocalyx by heparan sulfate and sphingosine 1‐phosphate restores inter‐endothelial communication. PLoS ONE. 2017;12:e0186116. [DOI] [PMC free article] [PubMed] [Google Scholar]
- 26. Greineder CF, Johnston IH, Villa CH, et al ICAM‐1‐targeted thrombomodulin mitigates tissue factor‐driven inflammatory thrombosis in a human endothelialized microfluidic model. Blood Adv. 2017;1:1452‐1465. [DOI] [PMC free article] [PubMed] [Google Scholar]
- 27. Atkinson BT, Jasuja R, Chen VM, Nandivada P, Furie B, Furie BC. Laser‐induced endothelial cell activation supports fibrin formation. Blood. 2010;116:4675‐4683. [DOI] [PMC free article] [PubMed] [Google Scholar]
- 28. Cosemans JM, Schols SE, Stefanini L, et al Key role of glycoprotein Ib/V/IX and von Willebrand factor in platelet activation‐dependent fibrin formation at low shear flow. Blood. 2011;117:651‐660. [DOI] [PMC free article] [PubMed] [Google Scholar]
- 29. Coppin L, Najimi M, Bodart J, et al Clinical protocol to prevent thrombogenic effect of liver‐derived mesenchymal cells for cell‐based therapies. Cells. 2019;8(8):846. [DOI] [PMC free article] [PubMed] [Google Scholar]
- 30. Chappell D, Jacob M, Paul O, et al The glycocalyx of the human umbilical vein endothelial cell: an impressive structure ex vivo but not in culture. Circ Res. 2009;104:1313‐1317. [DOI] [PubMed] [Google Scholar]
- 31. Reitsma S, Oude Egbrink MG, Heijnen VV, et al Endothelial glycocalyx thickness and platelet‐vessel wall interactions during atherogenesis. Thromb Haemost. 2011;106:939‐946. [DOI] [PubMed] [Google Scholar]
- 32. Baker AB, Gibson WJ, Kolachalama VB, et al Heparanase regulates thrombosis in vascular injury and stent‐induced flow disturbance. J Am Coll Cardiol. 2012;59:1551‐1560. [DOI] [PMC free article] [PubMed] [Google Scholar]
- 33. Tatour M, Shapira M, Axelman E, et al Thrombin is a selective inducer of heparanase release from platelets and granulocytes via protease‐activated receptor‐1. Thromb Haemost. 2017;117:1391‐1401. [DOI] [PubMed] [Google Scholar]
- 34. Cui H, Tan YX, Osterholm C, et al Heparanase expression upregulates platelet adhesion activity and thrombogenicity. Oncotarget. 2016;7:39486‐39496. [DOI] [PMC free article] [PubMed] [Google Scholar]
- 35. Wu C, Kim PY, Swystun LL, Liaw PC, Weitz JI. Activation of protein C and thrombin activable fibrinolysis inhibitor on cultured human endothelial cells. J Thromb Haemost. 2016;14:366‐374. [DOI] [PubMed] [Google Scholar]
Associated Data
This section collects any data citations, data availability statements, or supplementary materials included in this article.
Supplementary Materials