

Abstract
Aim
A low‐carbohydrate, healthy‐fat (LCHF) dietary approach has been demonstrated as an effective strategy for improving metabolic health; however, it is often criticised for being more expensive than following a dietary approach guided by the national, Ministry of Health nutrition guidelines. This study compared the cost of these two nutritionally replete dietary approaches for one day for a family of four.
Methods
In this descriptive case study, one‐day meal plans were designed for a hypothetical family of four representing the average New Zealand (NZ) male and female weight‐stable adult and two adolescent children. National documented heights, a healthy body mass index range (18.5–25.0 kg/m2), and a 1.7‐activity factor was used to estimate total energy requirements using the Schofield equation. Total daily costs were compared based on food prices from a popular Auckland supermarket. Meal plans were analysed for their nutritional adequacy using FoodWorks 8 dietary analysis software against national Australian and NZ nutrient reference value thresholds.
Results
The total daily costs were $43.42 (national guidelines) and $51.67 (LCHF) representing an $8.25 difference, or $2.06 per person, with the LCHF meal plan being the costlier option.
Conclusions
We consider this increased cost for an LCHF approach to be negligible. In practice, less costly food items with similar nutrition qualities can be substituted to reduce costs further should this be a goal. The LCHF approach should therefore not be disregarded as a viable dietary approach for improving health outcomes, based on its perceived expense.
Keywords: cost, LCHF, low‐carbohydrate, healthy‐fat, national nutrition guidelines
Introduction
When it comes to the promotion of optimal health, prevention and management of chronic disease, we base our dietary guidance on the national Ministry of Health (MOH) food and nutrition guidelines.1 More recently, an alternate option for dietary guidance has emerged, that is a wholefood‐based approach, characterised by a reduced carbohydrate, higher natural fat intake, also termed low‐carbohydrate, healthy‐fat (LCHF). This approach is becoming increasingly employed in clinical practice as an equally suitable, and in some cases more effective management strategy for a variety of chronic conditions, in particular, diabetes.2, 3, 4 It has also been shown to be effective both in the short and long term for its beneficial outcomes on metabolic health.5, 6, 7, 8, 9 Eating according to the LCHF approach is often criticised as being more expensive than eating following standard dietary guidelines, yet there is no literature to draw on to confirm or refute this.
The cost of food plays a central role in determining food choices for New Zealanders. In a national 2010 survey, cost was highlighted as the main influencer of food and drink purchases by 75% of the population surveyed (n = 1740), regardless of ethnicity and neighbourhood deprivation.10 While the bulk of the literature alludes to a greater cost of healthy foods in general, compared with unhealthy foods, this might depend on the food classification systems used in studies. Cross‐sectional observational studies in Australia and Europe have shown foods considered to be healthier, defined by a higher nutrient density, lower energy density, or through meeting government guidelines, tend to cost more.11, 12, 13, 14 A systematic review and meta‐analysis of 10 countries, including New Zealand (NZ), found healthier diets, on average tend to cost US$1.48 more per day than unhealthy diets.15 In contrast, an NZ study investigating 10‐year trends in food costs defined healthy food by the degree of food processing, and found processed foods to be NZ$0.51 more expensive than minimally processed foods; however, the price difference between ultra‐processed and minimally processed foods was negligible.16
When it comes to comparing healthy eating approaches with each other rather than isolated foods or ultra‐processed food‐based diets, few studies have examined such cost variances. Wilson et al. 17 compared the cost differences between a nutritionally adequate, typical NZ male diet (excluding alcohol), and an Asian and a Mediterranean‐style dietary approach and found the latter two to be significantly less expensive than the former. A further cost comparison between Mediterranean, Paleo and Intermittent Fasting (IF) diets found no significant differences in costs between diets.18
Ultimately, where eating well is a key factor in promoting good health and the reduced risk of lifestyle‐related disease, a healthy diet not only needs to be nutritionally replete, and sustainable to follow long term, but also financially viable. There is no documented literature that we are aware of on the costs associated with the LCHF approach. With the growing widespread use and interest in this dietary approach, we decided that this was an important aspect to explore. The aim of this study was to compare the costs of a nutritionally replete one‐day meal plan for a family of four for two dietary scenarios: LCHF and MOH national nutrition guidelines.
Methods
This descriptive study was conducted using a hypothetical case study scenario defined to represent a family of four living in Auckland, NZ. The family selected was designed to approximate the average Auckland household size according to the 2013 census data.19 The family included two weight‐stable adults (male and female) and two adolescent children (male and female) with no medically diagnosed health conditions. Participant characteristics were defined using anthropometric parameters to represent a healthy body mass index (BMI) (18.5–25.0 kg/m2)1 based on the estimated mean height of New Zealanders from each age and gender demographic.20 Individual nutrition requirements of the participants were determined using the Schofield equation for predicting basal metabolic rate21 and adjusted for gender, anthropometric information and a light‐to‐moderately active physical activity level (PAL, 1.7).22 Table 1 presents the demographic data used for the case studies.
Table 1.
Family demographics
| Family member | Age (years) | Height (cm) | Weight (kg) | BMI (kg/m2) | PAL | EER (kJ) | EER (Cal) |
|---|---|---|---|---|---|---|---|
| Adult male | 45 | 176.0 | 72 | 23 | 1.7 | 12 085 | 2888 |
| Adult female | 45 | 162.9 | 60 | 23 | 1.7 | 9483 | 2266 |
| Adolescent male | 14 | 169.8 | 65 | 23 | 1.7 | 12 964 | 3098 |
| Adolescent female | 12 | 156.1 | 55 | 23 | 1.7 | 10 268 | 2454 |
BMI, body mass index; EER, estimated energy requirement; PAL, physical activity level.
Dietary comparison for the two approaches was conducted using an energy‐matched estimated one‐day's intake for each participant. Meal plans were analysed using the nutrient analysis programme FoodWorks 8 Professional Edition (Xyris Software, Australia). Meal plans representing the MOH nutrition guidelines were developed to be consistent with food group and serving recommendations for NZ adults and adolescents according to the Eating and Activity Guidelines for NZ Adults1 and Food and Nutrition Guidelines for Healthy Children and Young People.23 Macronutrient intake was aligned with the acceptable macronutrient distribution ranges (AMDR) to reduce risk of chronic disease (45–65% energy from carbohydrate, 15–25% energy from protein and 20–35% energy from fat with less than 10% energy from saturated fat).22 For the LCHF meal plans, macronutrient intake was established to align with the AMDR for protein (15–25% of energy). Carbohydrate intake was selected to provide 10–20% energy (60–120 g), with the remaining energy derived from wholefood sourced fat (55–70% of energy). There was no defined restriction for saturated fat intake. All micronutrients for the two diets were assessed on FoodWorks against national Australian and NZ nutrient reference value (NRV) thresholds.22
Types of food consumed were standardised across both diets to include traditional meals, to exemplify common dietary choices and to match local food availability of the wider NZ population. Food cost data were collected from shelf prices examined from a reputably inexpensive local supermarket, Pak 'n Save in Albany, Auckland, NZ, in October 2016.24 Food items selected for inclusion were based on the following criteria: (i) foods that we considered to be, generally, popular and acceptable, rather than any specialty or unusual food that would demand an acquired taste; (ii) lowest cost brands within a food category, apart from eggs, where free range was selected over conventional eggs, for ethical reasons; and (iii) fresh vegetables were chosen in preference over frozen except for green beans, brussel sprouts and spinach. Costs for each one‐day sample meal plan for all participants were calculated by price per weight of food product consumed. Where price data were acquired for uncooked weight of foods (such as meat and rice), the weight of foods was adjusted for the cooked version.
Results
Tables 2 and 3 present the sample meal plans of the male and female case studies for both dietary approaches, and their macronutrient and energy composition, respectively.
Table 2.
MOH nutrition guidelines and LCHF meal plans for each family member
| MOH nutrition guidelines meal plans | LCHF meal plans | ||||||
|---|---|---|---|---|---|---|---|
| Adult male | Adolescent male | Adult female | Adolescent female | Adult male | Adolescent male | Adult female | Adolescent female |
| Breakfast | Breakfast | ||||||
|
Toast with tuna/avocado: Mixed grain bread, three slices; margarine, 2 tsp; tuna, 90 g; Mixed grain bread, three slices; avocado, ½; trim milk, 1 c |
Fruity oats: Oats, raw, 1 ¾ c; trim milk, 1 c; banana, 1 medium; frozen blueberries, ½ c | Fruity oats: Oats, raw, ⅔ c; trim milk, 150 mL; banana, ½ medium; sunflower seeds, 15 g; iodised salt, ¼ tsp |
Fruity oats and smoothie: Oats, rolled, raw, ½ c; reduced fat fruit yoghurt, ½ c; frozen blueberries, ½ c; Smoothie: Trim milk, 1 c; reduced fat fruit yoghurt, ½ c; banana, 1 medium; frozen blueberries, oats, rolled, raw, ¼ c |
Scrambled eggs with vegetables: Egg, 3 size 6; mushroom, 15 g; tomato, 100 g; onion, ¼ c; butter, 1.5 tbsp; iodised salt, ⅛ tsp | Scrambled eggs with vegetables: Egg, 4 size 6; mushroom, 17 g; tomato, 120 g; onion, ¼ c; butter, 1.5 tbsp; iodised salt, ⅛ tsp | Scrambled eggs with vegetables: Eggs, 3 size 6; mushroom, 15 g; tomato, 75 g; onion, ¼ c; butter, 3 tsp; cheese, cheddar, 40 g; iodised salt, ⅛ tsp | Fruit smoothie: Whole milk, 1 c; yoghurt, full fat Greek‐style, 1 c; frozen blueberries, ½ c; banana, ½ medium; sunflower seeds, 2 tbsp |
| Lunch | Lunch | ||||||
|
Two Ham and salad sandwiches: Mixed grain bread, four slices; ham, 95 g; lettuce, ½ c; tomato, 30 g; carrot, ⅓ c; mayonnaise, reduced fat, 3 tsp; Muesli bar, multigrain; Apple, 1 fruit |
Two Ham and salad sandwiches: mixed grain bread, four toast slices; margarine, 3 tsp; spinach, raw, ½ c; cheese, Edam, 30 g; ham, 95 g; Muesli bar, multigrain; Banana, 1 medium |
Beef and rice salad: Mesclun salad, 1 c; brown rice, 1.5 c; lean beef, 80 g; reduced fat vinaigrette dressing, 1 tbsp; Multigrain crackers, 6 biscuits; cheese, Edam, 40 g |
Beef and cheese pitas: Wholemeal pita, 2; lean beef, 60 g; mesclun salad, ½ c; carrot, raw, ½ c; mayonnaise, reduced fat, 3 tsp Banana, 1 medium Muesli bar, multigrain, 50 g |
Chicken and vegetable salad: Chicken thigh, roasted, 130 g; sweet potato, 110 g roasted in 1 ½ tbsp olive oil; ⅛ tsp iodised salt; pumpkin seeds, 2 tbsp; sunflower seeds, 1 tbsp; spinach leaves, 1 c; capsicum, 83 g; cheese, cheddar, 80 g | Chicken and vegetable salad: Chicken thigh, roasted, 100 g; sweet potato, 145 g roasted in 2 tbsp olive oil; ⅛ tsp iodised salt; capsicum, 166 g; carrot, 110 g; avocado, ½; cheese, cheddar, 50 g | Roast beef salad: Beef brisket, braised, 80 g; mesclun salad, 1 c; tomato, 120 g; cucumber, ½ c; carrot, ½ c; olive oil, 1 tbsp; pumpkin seeds, 2 tbsp |
Roast beef salad: Beef brisket, braised, 80 g; mesclun salad, 1 c; tomato, 120 g; cucumber, 1 c; carrot, 1 c; olive oil, 1.5 tbsp; pumpkin seeds, 2 tbsp; cheese, cheddar, 50 g |
| Dinner | Dinner | ||||||
|
Roast chicken and veg: Chicken breast, 130 g; broccoli, 1 c cooked; potato, 2 c cooked; spinach, 1 c raw; olive oil, 1 tbsp |
Roast chicken and veg: Chicken breast, 130 g; potato, 2 c cooked; broccoli, 1 c cooked; pumpkin, 1 c cooked; spinach 1 cup, raw; olive oil, 1 tbsp | Roast chicken dinner: Chicken breast, 80 g; pumpkin baked, ⅔ c; spinach steamed, ½ c; broccoli cooked, 1½ c; potato, 1 c; olive oil, 3 tsp; iodised salt, ¼ tsp |
Roast chicken dinner: Chicken breast, 90 g; potato, cooked 1 c; broccoli, cooked, 1 c; pumpkin, baked, ½ c; spinach, steamed, ½ c; olive oil, 2 tsp; iodised salt, ¼ tsp |
Roast chicken and veg: Chicken thigh, 130 g; pumpkin, 1 c cooked; broccoli, 1 c cooked; spinach, steamed, ½ c; olive oil, 2 tbsp | Roast chicken and veg: Chicken thigh, 130 g; pumpkin, 1 c cooked; broccoli, 1 c cooked; spinach, steamed, ½ c; olive oil, 2 tbsp | Roast chicken dinner: Chicken leg, 80 g; broccoli, cooked, 1 ½ c; pumpkin, baked, 1 c; spinach, steamed, ½ c; olive oil, 3 tsp; iodised salt, ¼ tsp | Roast Chicken dinner: Chicken leg, 90 g; broccoli, 1 c cooked; pumpkin, baked, 1 c; spinach, steamed, ½ c; olive oil, 2 tsp.; iodised salt, ¼ tsp |
| Snacks | Snacks | ||||||
|
Yoghurt, plain, low fat, ½ cup; banana, 1 medium chopped; Multigrain crackers, 10 biscuits; cream cheese, reduced fat, 80 g Kiwifruit, 1 fruit |
Smoothie: trim milk, 250 mL; banana, 1 medium Mixed grain bread, two toast slices; jam, 2 tsp (on one slice); natural peanut butter, 2 tsp (on one slice) Fruit yoghurt, ½ c; almonds, 7 g; raisins, 13 g |
Smoothie: trim milk, 200 mL; kiwifruit, 2 fruits; oats, raw ⅓ c Yoghurt, plain, low fat, 1 c; apple, 1 fruit, chopped |
Yoghurt, fruit, low fat, ½ c; apple, 1 chopped; almonds, 12 g Mixed grain bread, two slices; margarine, 2 tsp; marmite spread, 1 tsp; cheese, Edam 40 g |
Apple, 2 fruits, chopped, dipped in natural peanut butter, 3 tbsp Yoghurt, Greek‐style, full fat, 1 c; frozen blueberries, 1 c Brazil nuts, 38 g |
Yoghurt, Greek‐style, full‐fat, 1 c; frozen raspberries, ½ c; natural peanut butter, 3 tbsp Almonds, 24 g; sunflower seeds, 30 g Banana, 1 fruit |
Smoothie: whole milk, 250 mL; kiwifruit, 1 fruit Yoghurt, full fat Greek‐style, 1 c; sunflower seeds, 30 g; almonds, 18 g |
Cucumber, Lebanese, 1, with spread natural peanut butter, salted, 3 tsp Almonds, 18 g; cashew nuts, 50 g Apple, 1 fruit |
LCHF, low‐carbohydrate, healthy‐fat; MOH, Ministry of Health.
Table 3.
Total energy and macronutrient distribution for the MOH nutrition guidelines, and LCHF meal plans
| MOH nutrition guidelines | LCHF | |||||||
|---|---|---|---|---|---|---|---|---|
| Nutrient breakdown | Adult male | Adult female | Adolescent male | Adolescent female | Adult male | Adult female | Adolescent male | Adolescent female |
| Energy | ||||||||
| kJ | 12 742.2 | 9494.0 | 13 035.2 | 10 679.9 | 12 773.1 | 9442.2 | 13 045.2 | 10 310.3 |
| Cal | 3045.5 | 2269.1 | 3115.5 | 2552.6 | 3052.8 | 2256.7 | 3117.9 | 2464.1 |
| Carbohydrate | ||||||||
| g | 352.9 | 277.5 | 394.2 | 325.1 | 102.3 | 63.1 | 103.9 | 114.3 |
| % | 46.2 | 48.8 | 50.3 | 50.6 | 13.0 | 10.8 | 12.9 | 18.0 |
| Protein | ||||||||
| g | 158.6 | 129.3 | 163.0 | 139.6 | 150.6 | 131.5 | 142.6 | 122.8 |
| % | 21.2 | 23.2 | 21.3 | 22.2 | 20.0 | 23.7 | 18.6 | 20.3 |
| Fat | ||||||||
| g | 96.1 | 60.1 | 82.1 | 59.6 | 220.5 | 159.3 | 230.7 | 161.8 |
| % | 27.9 | 23.4 | 23.3 | 21.7 | 63.9 | 62.4 | 65.4 | 58.1 |
| Saturated Fat | ||||||||
| g | 23.9 | 18.9 | 21.3 | 18.7 | 70.1 | 62.2 | 62.4 | 56.2 |
| % | 6.9 | 7.4 | 6.0 | 6.3 | 20.3 | 24.0 | 17.7 | 20.2 |
LCHF, low‐carbohydrate, healthy‐fat; MOH, Ministry of Health.
Cost comparisons for the one‐day meal plans are presented in Figure 1. The total combined costs for the diets of all four family members were $43.42 for the MOH nutrition guidelines (average cost per person: $10.86) and $51.67 for LCHF (average cost per person: $12.92). The difference between the two dietary approaches was $8.25, with the LCHF diet being the more expensive option. Taken as an average cost per family member, this amounted to $2.06.
Figure 1.
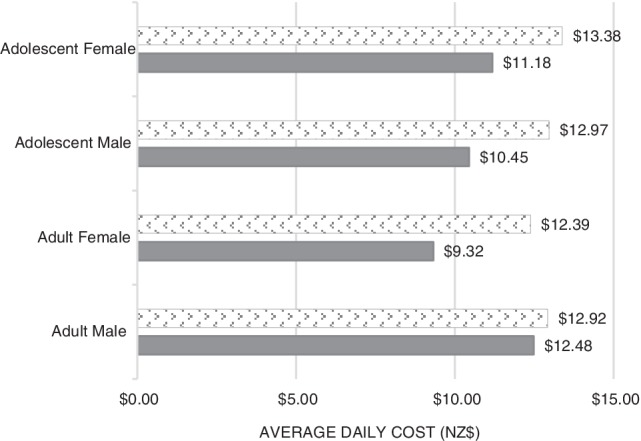
Cost comparison analyses for one‐day sample meal plans (LCHF, low‐carbohydrate, healthy‐fat; MOH, Ministry of Health; NZ, New Zealand). ( ) LCHF; (
 ) MOH national guidelines.
All versions of the meal plans were replete for all the micronutrients as compared against their recommended dietary intake (RDI) or specific dietary target (SDT) thresholds apart from the mineral selenium, which reached 95% of the RDI for the adolescent male in the MOH guidelines plan (see Appendix I). The maximum SDT for sodium for the adult male and female, and the adolescent female for the MOH guidelines meal plans was exceeded.
Discussion
This is the first study to compare the food costs of a nutritionally replete meal plan for a wholefood‐based LCHF approach with that of an MOH national nutrition guidelines‐based approach. The key finding was that in this instance, the LCHF was the costlier set of meal plans of the two amounting to an additional $8.25 per day for a family of four, or an average of $2.06 per person. Extrapolated to one week totals $361.69 and $303.94 for the LCHF and MOH plans, respectively; however, these figures should be interpreted with caution. Purchased meals, snacks and beverages consumed outside of the home environment, as well as different meal varieties could either overestimate or underestimate costs over the week for both dietary conditions.
Our findings differed from those reported by Wilson et al. 17 This research group reported an Asian and Mediterranean meal plan at NZ$4.95 per day and NZ$5.64 per day, respectively; with both meal plans less costly than that of a typical NZ male (as guided by national survey data from the National Nutrition Adult Nutrition Survey),25 costed at $17.29 per day. In this NZ study, nutrient thresholds were assessed against estimated average requirements (EARs), that is the intake required to meet the needs of half of the population; hence it represented a 1000kJ lower dietary energy requirement than that used in our study. Researchers also used a selection of micronutrients for comparison rather than the full spectrum as we did (i.e. vitamin B1—thiamine—to represent all the B vitamins, upper limits for sodium and vitamin A) and undertook analyses for males only.
In contrast, our cost findings for LCHF ($12.92) were similar to those reported by Park who conducted a dietary adherence study using weighed dietary records with actual participants. Park reported no significant difference between average daily costs of three diets: Mediterranean diet: $11.27; Paleo diet: $12.85 and IF on a non‐fasting day, where the participants could eat whatever they wished: $12.06. One would assume a cost similarity between Paleo and LCHF dietary approaches as they share a common dietary philosophy, that is a focus on the consumption of whole unprocessed foods. However, this argument does not hold true considering the similar costs seen for IF on a non‐fasting day.17, 18
Despite the costlier outcome for LCHF meal plans in this study, there are several important points that warrant consideration when it comes to estimating the cost of different diets, especially LCHF. The first of these is that whichever style of eating you adopt, there are mechanisms for reducing the cost of foods, even when foods are matched for nutrient composition. For example, extra virgin olive oil, fresh salmon, macadamia nuts and broccolini, foods often used with LCHF but not limited to it, would be considered expensive options, yet their less costly, approximate nutrient‐equivalents such as standard olive oil, sardines, linseed and frozen spinach are substantially cheaper. Ethical perspectives could also alter food costs. In this exercise, we used free‐range eggs (eggs were only used in the LCHF plan); however, using standard caged‐eggs would have been a less costly option, bringing the daily cost of the one‐day LCHF plan down by $2.00, and thereby, reducing the daily difference between the plans from $8.25 to $6.25.
In the context of the LCHF approach, there are some foods known to be less expensive than their equivalent following an MOH nutrition guidelines approach. For example, standard mince, rump steak and chicken thighs or wings with skin all have a higher natural fat content and are less costly than leaner cuts of meat such as premium mince, eye fillet steak and skinless chicken breasts. This point was reflected in our work as the ‘Meats’ food group comparative costs for the family were $16.41 for the MOH approach, and $12.67 for the LCHF approach. On the other hand, there are some foods known to be more expensive compared with their non‐LCHF counterparts, the notable one being almond flour (almond meal) versus standard white flour, an ingredient frequently used as a lower carbohydrate alternative for baking. In this case, there is also a vast difference between the nutritional content of these two flours, with almond flour being nutritionally superior.26 In these meal plans, we did not include any homemade baking products, and have therefore not captured this as a significant cost difference.
When other food groups were compared, there were similarities noted in the total amounts as follows: ‘fruit’: $5.25 versus $5.04; ‘dairy’: $5.27 versus $6.35; ‘fats, oils, spreads’ $1.34 versus $2.26; for the MOH plans and the LCHF plans, respectively. The main cost discrepancies were noted in the remaining food groups, ‘nuts and seeds’, ‘grains’ and ‘vegetables’, and were largely due to the different proportions of these foods used in the two sets of meal plans. The cost differences were as follows: ‘nuts and seeds’: 87c versus $8.64; ‘grains’: $6.49 versus $0 and ‘vegetables’: $7.80 versus $16.58, for the MOH versus LCHF plans, respectively. The total cost difference between these food groupings was $10.06, with LCHF being costlier than MOH. The greater use of nuts, seeds and vegetables in the LCHF plans was a necessary trade‐off from the absence of carbohydrate‐heavy grains, to ensure the macronutrient, micronutrient and fibre thresholds were met. The grains selected for the MOH plans were all wholegrain, rather than their known less costly refined counterparts. Despite this, grain‐based foods still tend to be a less costly option than nuts, seeds and vegetables based on the proportions used to satisfy certain nutrient requirements, in particular fibre and certain B vitamins. Modelled as family eating behaviours, our analysis included family‐style meals that allowed for strategic shopping, meal planning, purchasing in bulk and avoiding waste; known strategies to make weekly shopping affordable.27 In our study, foods were selected for both nutrition approaches equally with general affordability in mind. We selected low cost brands, seasonal fresh produce and frozen alternatives to more expensive fresh varieties. Whether either style of eating is considered affordable for low‐income families is important, but beyond the scope of this work.
The second important point to consider is the value people place on the foods they purchase in relation to their overall health. While LCHF may be a costlier dietary approach in this instance, for some the additional $2.06 per person per day (which accumulates, hypothetically, to $57.69 per week for the whole family) may be viewed as a worthy investment for the perceived health benefits and overall reduction in health‐related costs it may imply. Food purchasing is a complex issue; one only needs to consider the extent of discretionary food and beverage spending (i.e. weekly coffee consumption in 2015 ranged from $12.09 to $14.02 per person in different regions of NZ28) to realise that food purchasing behaviours can be influenced by both affordability (or lack of) and priorities, which differs markedly between individuals and families.
We were able to achieve nutrient‐replete diet plans for both dietary approaches (apart from the mineral selenium for the adolescent boy in the MOH guidelines plan—which can be remedied by the addition of one Brazil nut). This finding corroborates with previous LCHF plan nutrient analyses.29 MOH national nutrition guidelines promote a carbohydrate‐dominant, lower fat dietary approach, with adults and adolescents advised to eat a minimum of six servings of grain‐based foods daily as a main source of dietary energy (in the form of carbohydrate) as well as fibre, vitamins (B group vitamins excluding B12 and E) and minerals (magnesium, calcium, iron, zinc and selenium).1 Alternate low carbohydrate choices are believed to raise the cost of obtaining these essential nutrients either resulting in nutritional inadequacy or additional food cost.30 This was shown to some extent in our work, despite previous nutrient‐driven cost analyses showing LCHF‐appropriate wholefoods such as eggs, meat, dairy, dry beans, nuts, seeds, vegetables and fruit, among the lowest cost food sources of protein, fibre, vitamin A, vitamin C, calcium, iron and potassium.31
Our study had several limitations; however, none of them single out or bias any one style of eating but rather apply to both LCHF and MOH nutrition guidelines equally. The first is that only a one‐day sample meal plan was examined and therefore does not consider the variety that would usually be seen over the course of a week. As a result, the application of these findings to larger and more diverse groups over a longer duration is limited.
Another limitation was that food costs were determined from off‐shelf price information from an Auckland supermarket over a one‐week period. This did not account for usual budgeting strategies that involve taking advantage of food specials one might see at a different supermarket. Neither did it include the purchase of foods from vegetable shops, markets and the butcher, where often foods can be obtained more inexpensively, or foods from vegetable or herb gardens. However, this is not necessarily problematic, in that the aim of this study was not to undertake an exercise in cost‐effectiveness or affordability of food in general, but rather to compare the costs of two eating approaches. These limitations can be applied equally to both nutrition approaches and does not bias seasonal price or food choice variation.
The fact that these were theoretical case studies was a limitation as food preference was unable to be considered in food selection. Furthermore, there was potential for researcher bias in determining menu items and ‘typical’ food choices for the theorised participants.
A strength of the study is that an accurate, professional and local food composition database for dietary analysis was used. A further strength was the exclusion of specialty, fortified and unpopular foods in food selection to avoid bias towards nutrient density in any one dietary approach.
In conclusion, this study demonstrated that a nutrient‐replete LCHF meal plan was costlier in this instance than an MOH nutrition guidelines plan for a family of four. Whether $2.06 per person per day is considered a minor or a major difference in costs is subjective. Either way, we do not believe this constitutes a meaningful enough difference to warrant disregarding LCHF as a viable dietary approach for improving health outcomes, based on its perceived expense.
Funding source
CM, one of the study authors received funding to assist with the study data collection and analysis from a contestable Graduate Assistantship grant supplied by AUT.
Conflict of interest
Dr CZ has co‐authored four books on the topic of the LCHF dietary approach. All other authors declare no conflict of interest.
Authorship
CZ and GH contributed to the study idea and design. CM undertook the data collection. CM, SN, KD and CZ contributed to the data analysis and interpretation. All authors contributed to the development of the manuscript. All authors approved the final manuscript and declare that the content has not been published elsewhere.
Appendix I 1.
Table A1.
Micronutrient analysis for MOH nutrition guideline and LCHF diet plans for each family member
| MOH nutrition guidelines | LCHF | |||||||||||||||
|---|---|---|---|---|---|---|---|---|---|---|---|---|---|---|---|---|
| Micronutrients | Adult male | % RDI (unless otherwise specified) | Adult female | % RDI (unless otherwise specified) | Adolescent male | % RDI (unless otherwise specified) | Adolescent female | % RDI (unless otherwise specified) | Adult male | % RDI (unless otherwise specified) | Adult female | % RDI (unless otherwise specified) | Adolescent male | % RDI (unless otherwise specified) | Adolescent female | % RDI (unless otherwise specified) |
| Thiamin (mg) | 3.3 | 274 | 2.4 | 220 | 2.5 | 207 | 2.7 | 305 | 1.4 | 114 | 1.4 | 131 | 1.5 | 129 | 1.4 | 160 |
| Riboflavin (mg) | 5.2 | 402 | 3.3 | 296 | 3.7 | 282 | 3.9 | 434 | 3.4 | 262 | 3.7 | 338 | 3.7 | 286 | 3.1 | 355 |
| Niacin (mg) | 48.1 | NA | 21.1 | NA | 25.9 | NA | 22.0 | NA | 23.2 | NA | 10.4 | NA | 29.7 | NA | 13.1 | NA |
| Niacin equivalents (mg) | 81.3 | 508 | 48.0 | 343 | 59.0 | 369 | 46.6 | 389 | 59.5 | 372 | 40.8 | 291 | 65 | 406 | 40 | 333 |
| Vitamin C (mg) | 218.6 | 486 | 443.6 | 986 | 191.8 | 480 | 165.3 | 413 | 307.7 | 684 | 278.7 | 619 | 438.8 | 1097 | 185 | 462 |
| Vitamin B6 (mg) | 7.3 | 563 | 3.6 | 280 | 4.3 | 333 | 3.6 | 360 | 3.0 | 232 | 2.24 | 172 | 4.6 | 354 | 2.4 | 237 |
| Vitamin B12 (μg) | 8.5 | 354 | 5.9 | 246 | 6.2 | 257 | 5.4 | 299 | 7.7 | 320 | 6.8 | 285 | 7.3 | 302 | 4.7 | 259 |
| Folate (dietary folate equivalents, μg) | 1373.9 | 342 | 518.1 | 130 | 473.5 | 118 | 796.6 | 266 | 737.3 | 184 | 6.37 | 159 | 692.4 | 173 | 467.2 | 156 |
| Total vitamin A equivalents (μg) | 963.2 | 107 | 1760 | 252 | 1994.7 | 222 | 2048.7 | 341 | 3881.7 | 431 | 3803.4 | 543 | 4300.1 | 478 | 4225.2 | 704 |
| Magnesium (mg) | 552.2 | 131 | 593.9 | 186 | 766.6 | 187 | 592.4 | 247 | 630.7 | 150 | 563 | 176 | 541.1 | 132 | 664.3 | 277 |
| Calcium (mg) | 1236.4 | 124 | 1723.5 | 172 | 1913.5 | 147 | 1899.7 | 146 | 160.4 | 160 | 1630.8 | 163 | 1371.8 | 106 | 1672.1 | 129 |
| Potassium (mg) | 6399.7 | 136a | 5389.3 | 115a | 7254.0 | 154a | 5426.0 | 115a | 5199.8 | 111a | 4494.4 | 96a | 5880.7 | 125a | 4930.2 | 105a |
| Phosphorus (mg) | 2571.7 | 257 | 2507.2 | 251 | 2882.6 | 231 | 2414.5 | 193 | 2573.6 | 257 | 2375.4 | 238 | 2407.3 | 193 | 2326.7 | 186 |
| Iron (mg) | 25.6 | 319 | 18.4 | 102 | 26.1 | 237 | 19.0 | 237 | 18.8 | 235 | 18.7 | 104 | 16.3 | 149 | 17.7 | 221 |
| Zinc (mg) | 16.4 | 117 | 13.7 | 171 | 15.3 | 117 | 15.5 | 258 | 20.1 | 144 | 18.5 | 231 | 19.3 | 148 | 19.5 | 326 |
| Selenium (μg) | 125.2 | 179 | 60.5 | 101 | 66.8 | 95 | 78.7 | 157 | 572.5 | 818 | 95.1 | 159 | 108.6 | 155 | 62.9 | 126 |
| Iodine (μg) | 151.8 | 101 | 195.5 | 130 | 156.2 | 104 | 121.4 | 101 | 194.7 | 130 | 183.2 | 122 | 208.2 | 139 | 125.3 | 104 |
| Sodium (mg) | 3981.6 | 199b | 2211.5 | 111b | 1761.8 | 88b | 2370.6 | 119b | 1935.8 | 97b | 1520.0 | 76b | 1707.3 | 85b | 1575.4 | 79b |
| Fibre (g) | 61 | 161a | 45 | 159a | 66 | 173a | 58 | 208a | 39 | 103a | 30 | 107a | 39 | 103a | 36 | 130a |
Potassium and fibre are presented as a percentage of the minimum SDT.
Sodium is presented as a percentage of the maximum SDT.
NA, not applicable; LCHF, low‐carbohydrate, healthy‐fat; MOH, Ministry of Health, RDI, recommended dietary intake; SDT, suggested dietary target.
C. Zinn, PhD, NZRD, Senior Lecturer, Head of Research
S. North, MSc (NutrDiet), NZ Registered Dietitian
K. Donovan, BSR student
C. Muir, BSR student
G. Henderson, Research assistant
References
- 1. Ministry of Health . Eating and Activity Guidelines for New Zealand Adults. Wellington: The Organization, 2015. [Google Scholar]
- 2. McKenzie AL, Hallberg SJ, Creighton BC et al. A novel intervention including individualized nutritional recommendations reduces hemoglobin A1c level, medication use, and weight in type 2 diabetes. JMIR Diabetes 2017; 2: e5. [DOI] [PMC free article] [PubMed] [Google Scholar]
- 3. Noakes TD. Low‐carbohydrate and high‐fat intake can manage obesity and associated conditions: occasional survey. S Afr Med J 2013; 103: 826–30. [DOI] [PubMed] [Google Scholar]
- 4. Unwin D, Unwin J. Low carbohydrate diet to achieve weight loss and improve HbA1c in type 2 diabetes and pre‐diabetes: experience from one general practice. Practical Diabetes 2014; 31: 76–9. [Google Scholar]
- 5. Fan Y, Di H, Chen G, Mao X, Liu C. Effects of low carbohydrate diets in individuals with type 2 diabetes: systematic review and meta‐analysis. Int J Clin Exp Med 2016; 9: 11166–74. [Google Scholar]
- 6. Forsythe CE, Phinney SD, Fernandez ML et al. Comparison of low fat and low carbohydrate diets on circulating fatty acid composition and markers of inflammation. Lipids 2008; 43: 65–77. [DOI] [PubMed] [Google Scholar]
- 7. Sackner‐Bernstein J, Kanter D, Kaul S. Dietary intervention for overweight and obese adults: comparison of low‐carbohydrate and low‐fat diets. A meta‐analysis. PLoS One 2015; 10: e0139817. [DOI] [PMC free article] [PubMed] [Google Scholar]
- 8. Foster GD, Wyatt HR, Hill JO et al. Weight and metabolic outcomes after 2 years on a low‐carbohydrate versus low‐fat diet: a randomized trial. Ann Intern Med 2010; 153: 147–57. [DOI] [PMC free article] [PubMed] [Google Scholar]
- 9. Shai I, Schwarzfuchs D, Henkin Y et al. Weight loss with a low‐carbohydrate, Mediterranean, or low‐fat diet. N Engl J Med 2008; 359: 229–41. [DOI] [PubMed] [Google Scholar]
- 10. Murray S. Shopping Behaviours of New Zealand Households. Wellington: Health Sponsorship Council, 2012. [Google Scholar]
- 11. Harrison M, Lee A, Findlay M, Nicholls R, Leonard D, Martin C. The increasing cost of healthy food. Aust N Z J Public Health 2010; 34: 179–86. [DOI] [PubMed] [Google Scholar]
- 12. Maillot M, Darmon N, Darmon M, Lafay L, Drewnowski A. Nutrient‐dense food groups have high energy costs: an econometric approach to nutrient profiling. J Nutr 2007; 137: 1815–20. [DOI] [PubMed] [Google Scholar]
- 13. Morris MA, Hulme C, Clarke GP, Edwards KL, Cade JE. What is the cost of a healthy diet? Using diet data from the UKWomen's Cohort Study. J Epidemiol Community Health 2014; 68: 1043–9. [DOI] [PubMed] [Google Scholar]
- 14. Waterlander WE, de Haas WE, van Amstel I et al. Energy density, energy costs and income – how are they related? Public Health Nutr 2010; 13: 1599–608. [DOI] [PubMed] [Google Scholar]
- 15. Rao M, Afshin A, Singh G, Mozaffarian D. Do healthier foods and diet patterns cost more than less healthy options? A systematic review and meta‐analysis. BMJ Open 2013; 3: e004277. [DOI] [PMC free article] [PubMed] [Google Scholar]
- 16. Mackay S, Vandevijvere S, Arier L. Ten‐year trends in the price differential between healthier and less healthy foods in New Zealand. Nutr Diet 2018. 10.1111/1747-0080.12457. [DOI] [PubMed] [Google Scholar]
- 17. Wilson N, Nghiem N, Ni Mhurchu C, Eyles H, Baker M, Blakely T. Foods and dietary patterns that are healthy, low‐cost, and environmentally sustainable: a case study of optimization modeling for New Zealand. PLoS One 2013; 8: e59648. [DOI] [PMC free article] [PubMed] [Google Scholar]
- 18. Park ML. A Cost Analysis of Three Popular Diets: The Mediterranean Diet, a Modified Paleo Diet and Intermittent Fasting. Otago: University of Otago, 2016. [Google Scholar]
- 19. Statistics New Zealand . Census QuickStats about families and households, 2013. (Available from: http://www.stats.govt.nz/Census/2013-census/profile-and-summary-reports/qstats-families-households/households.aspx?gclid=Cj0KCQjwy4zLBRCOARIsADfss35eYh9ha7FcXKVaJexZybslfQLn0MT6l5kUB71N9kzXX9dwo-AZr70aAkHyEALw_wcB2014, accessed 10 July 2017).
- 20. Statistics New Zealand . New Zealand Health Survey 2015/16: interactive data, 2017. (Available from: https://minhealthnz.shinyapps.io/nz-health-survey-2015-16-annual-update/, accessed 10 July 2017).
- 21. Schofield WN. Predicting basal metabolic rate, new standards and review of previous work. Hum Nutr Clin Nutr 1985; 39: S5–41. [PubMed] [Google Scholar]
- 22. National Health and Medical Research Council, Ministry of Health . Nutrient Reference Values for Australia and New Zealand Including Recommended Dietary Intakes. Canberra: The Council, 2006. [Google Scholar]
- 23. Ministry of Health . Food and nutrition guidelines for healthy children and young people (aged 2–18 years): a background paper: Ministry of Health, 2015. (Available from: http://www.health.govt.nz/publication/food-and-nutrition-guidelines-healthy-children-and-young-people-aged-2-18-years-background-paper, accessed 17 October 2017).
- 24. Consumer NZ . Supermarket price survey: consumer NZ, 2016. (Available from: https://www.consumer.org.nz/articles/supermarket-price-survey, accessed 10 July 2018).
- 25. University of Otago, Ministry of Health . A Focus on Nutrition: Key Findings of the 2008/09 New Zealand Adult Nutrition Survey. Wellington: Ministry of Health, 2011. [Google Scholar]
- 26. The New Zealand Institute for Plant & Food Research Limited . New Zealand food composition data, 2018. (Available from: https://www.foodcomposition.co.nz/, accessed 11 November 2018).
- 27. Wiig K, Smith C. The art of grocery shopping on a food stamp budget: factors influencing the food choices of low‐income women as they try to make ends meet. Public Health Nutr 2009; 12: 1726–34. [DOI] [PubMed] [Google Scholar]
- 28. Canstar Blue . Are we spending too much on coffee? 2016. (Available from: https://www.canstarblue.co.nz/food-drink/coffee-shop-chains/what-do-we-spend-on-coffee/, accessed 22 November 2018).
- 29. Zinn C, Rush A, Johnson R. Assessing the nutrient intake of a low‐carbohydrate, high‐fat (LCHF) diet: a hypothetical case study design. BMJ Open 2018; 8: e018846. [DOI] [PMC free article] [PubMed] [Google Scholar]
- 30. Raffensperger JF. The least‐cost low‐carbohydrate diet is expensive. Nutr Res 2008; 28: 6–12. [DOI] [PubMed] [Google Scholar]
- 31. Drewnowski A. The carbohydrate‐fat problem: can we construct a healthy diet based on dietary guidelines? Adv Nutr 2015; 6: 318S–25S. [DOI] [PMC free article] [PubMed] [Google Scholar]