

Abstract
Anthropogenic noise associated with shipping has emerged as a major disruptor of aquatic animal behavior worldwide. The Arctic marine realm has historically experienced little noise‐generating human activity; however, the continual loss of sea ice has facilitated a dramatic increase in shipping activity. Here, we use a combination of acoustic telemetry and modeling of ship noise to examine the temporospatial habitat use of key Arctic forage fish, Arctic cod (Boreogadus saida) in the presence and absence of vessels in Resolute Bay, Nunavut, Canada. The presence and movement of vessels induced a horizontal shift in the home ranges of Arctic cod with low core overlap when compared to periods without vessel activity. Home range displacement occurred near the vessel. Individuals also altered their swimming behaviors in response to vessel presence with searching decreasing and travelling increasing in proportion. Results indicate that Arctic cod perceive vessel noise and presence as a threat and react by moving away and decreasing exploratory activities. These changes in fish behavior also coincide with the critical open water feeding period suggesting an interruption in exploitation of important and seasonally abundant food resources, and carry broader implications for dependent seabirds and marine mammals, and indirectly for all Arctic indigenous peoples’ subsistence and long‐term cultural traditions. Our study implies that strategic management is required for aquatic acoustic disturbance as an environmental stressor in the Arctic marine ecosystem, and highlights ecologically and socially important impacts that require timely conservation action.
Keywords: anthropogenic disturbance, Arctic cod, Arctic, marine habitat, climate change, spatial ecology, swimming behavior, vessel traffic
Introduction
Underwater sound is of critical importance to fish for foraging, predator avoidance, exploration, navigation, and communication (Hastings et al. 1996, Popper and Hastings 2009, Slabbekoorn et al. 2010). All fish species studied to date can detect sound (Kasumyan 2005, Popper and Fay 2011) typically in the range of 30 to 5,000 Hz, which falls within the frequency band of many sources of anthropogenic noise (Slabbekoorn et al. 2010). Ships produce noise at frequencies ranging from 10 to 40,000 Hz (Veirs et al. 2016), and this noise has been found to cause avoidance behavior in fish (Vabø et al. 2002). Also, noise associated with boats and smaller vessels has been linked to increased stress levels (Wysocki and Ladich 2005) and elevated mortality due to predation (Simpson et al. 2016). Longer term effects on fish are associated with reduced reproduction potential, and changes in the overall population and community structure (Sandström et al. 2005, Picciulin et al. 2010, Slabbekoorn et al. 2010).
Global shipping traffic has increased fourfold over the past two decades (Tournadre 2014), primarily in temperate waters, resulting in a 10–12 dB increase in low‐frequency ambient noise levels (McDonald et al. 2006). The Arctic, a previously largely inaccessible region, has, until recently, experienced limited historical shipping activity and noise; however, climate change is altering that. The rate of warming in the Arctic is nearly double that observed globally (Bintanja and Selten 2014, Richardson et al. 2016) and is causing record declines in summer sea ice cover since the 1970s (Johannessen et al. 2004, Comiso et al. 2008). September sea ice extent in 2012 was estimated to be reduced by 49% from the 1979–2000 baseline average (Overland and Wang 2013) as a result of climate change, with 2007, 2016, and 2019 following closely behind with 34% reduction (Gautier 2019), and the decadal trend of decrease in multiyear ice has doubled since 1996 (Comiso 2012). This ice decline is facilitating ship traffic growth in the Arctic. Shipping, including cruise‐ship traffic, has increased two‐fold over the past 20 yr (Fig. 1 inset), and the number of days vessels spend in the Arctic has nearly quadrupled since 2000 (Judson 2010). This upward trend is projected to continue (Melia et al. 2016) and will result in an increase of acoustic noise in the Arctic marine environment, especially along the Northwest Passage (the sea route through the Arctic archipelago of Canada considered to have the shortest distance for connecting Europe and Asia by sea).
Figure 1.
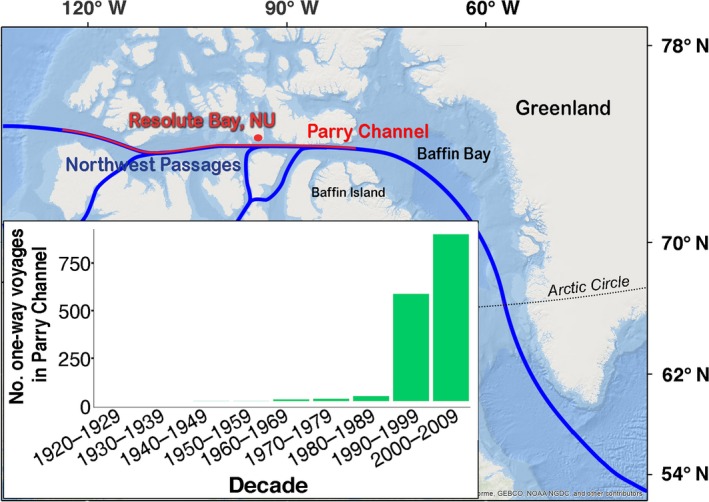
Map of the Northwest Passage routes (blue line) and location of Resolute Bay, Nunavut (NU), Canada (74.6773° N, 94.8297° W). The Parry Channel is shown in red along a route of the Northwest Passage. (Base map used in this figure is from the public domain Natural Earth and is freely available for personal, educational and commercial uses. See http://www.naturalearthdata.com/about/terms-of-use/ for more details.) The inset shows historical vessel activity; number of one‐way ship voyages in the Parry Channel per decade (excluding vessels < 50 m).
Although the effects of vessel noise are documented for fish living in temperate and tropical ecosystems across the globe, no research has been conducted on Arctic fish species to date. National legislations, such as the U.S. National Environmental Policy Act, Canadian Environmental Protection Act, and the European Union Marine Strategy Framework Directive, recognize the need for assessment of the biological impacts of anthropogenic disturbance. These also support environmental protection, human health, and sustainable management. In compliance with this and given the rapidly changing Arctic environment, quantifying fish behavioral shifts related to shipping is an important proactive step required to better understand and predict potential impacts of increased shipping in this region. Ultimately, this will aid in the development of effective conservation and management approaches in this relatively pristine yet vulnerable ecosystem (Hussey et al. 2015).
Arctic cod (Boreogadus saida) is believed to be a hearing specialist (Minerals Management Service Alaska OCS Region 2007), although no studies to date have focused on the hearing ranges of this species. Arctic cod is a key species in Arctic marine ecosystems due to its large biomass and role as a conduit of energy from lower to higher trophic levels (Welch et al. 1993). High in fat, Arctic cod have more energy content relative to other prey species (Brekke and Gabrielsen 1994) and, as such, is the preferred food for marine mammals and seabirds (Bradstreet and Cross 1982, Gaston et al. 2012). Of particular importance to these predators are the feedings occurring during open‐water periods when Arctic cod form large schools in nearshore areas. Ship traffic also tends to be located in these nearshore areas around indigenous communities. Consequently, changes in the behavior and distribution of Arctic cod due to vessels may have negative cascading effects for associated predators, such as ringed seals (Pusa hispida) and beluga whales (Delphinapterus leucas), resulting from replacement with lower quality prey and/or prolonged search for prey (Gaston et al. 2012, Harwood et al. 2015). A direct effect may be a modified marine mammal distribution, which would ultimately alter the availability of these to indigenous peoples who depend on them for subsistence. Thus, in this study, we hypothesized that (1) noise generated by ship presence will deter fish from the habitat near the vessel resulting in horizontal displacement, (2) vessel movement will elicit a school aggregation, thus, decreasing the core home ranges of cod, and (3) vessel movement will elicit a startle response, resulting in an increase in higher speed swimming patterns. We used acoustic telemetry, particularly Vemco Positioning System (Smith 2013), in the high Arctic to quantify the impact of vessel presence and movement on the home ranges and movement behavior of Arctic cod. Identification of different movement behaviors, such as searching, feeding and transiting, is possible through decomposing movement characteristics derived from telemetry data (Coughlin et al. 1992, Kasumyan 1999, McLean et al. 2014), which include total distance travelled, rate, linearity, and turning angles of movements. We also quantified propagation of sound in Resolute Bay, Nunavut, Canada, and noise levels during periods with vessel movement, presence but no movement, and absence.
Methods
Study site
Resolute Bay, Nunavut, Canada (latitude 74.6773° N and longitude 94.8297° W) was chosen as the study site due to its proximity to the Northwest Passage and it being used as anchorage for supplies and passengers (see Fig. 1). Ships are frequently present in the bay and there is an Arctic cod population (Welch et al. 1993, Graham and Hop 1995). The bay is shallow, with a deep depression of up to 30 m at the head of the bay (Fig. 2a).
Figure 2.

Bathymetry and vessel noise quantification for Resolute Bay, Nunavut, Canada. (a) Bathymetry of Resolute Bay. Straight black lines denote the west and east vessel navigation lanes. The 20‐m depth contour line at the head of the bay is also shown. (b) Noise‐field directionality around the vessel Sea Explorer while in transit is shown with nominal observed sound pressure level (SPL) values. A value of 0° represents the bow and 180° directly behind the vessel. (c) Sound‐speed–depth profile for the passenger vessel Sea Explorer used for sound propagation modeling. (d–i) Root mean‐squared sound pressure levels (rms SPL) in dB re 1μPa (0.7–64 kHz) calculated at 1 m above the sea floor when the Sea Explorer cruise ship enters along the western and eastern shipping lanes at 3 and 2 knots, respectively (1 knot = 0.51 m/s). Directionality of noise from the moving vessel and the sound propagation in the bay can be seen in panels e and g–i. Panel d shows that the bay is shielded from the noise produced by a vessel approaching the mouth of the bay. The 16 dB reduction in rms SPL is visible in panel f when the ship is at anchor.
Quantification of vessel noise and ambient noise levels
For logistical reasons, it was not possible to measure the broadband source levels (dB re 1μPa) of the cruise vessels that entered Resolute Bay, Nunavut, during the 2012 field season. Therefore, as a proxy, the cruise vessel Sea Explorer (IMO 8802882 – 3, 302 ton, 90 m length, 30 m beam, 4 m draft), which visited Resolute Bay on 27–28 August 2015, was used. Veirs et al. (2016) have shown that cruise ships have broadband (20–40,000 Hz) source levels that vary between 166 and 170 dB, suggesting a possible range of source levels from these types of vessels visiting Resolute Bay. In contrast, cargo vessels, which also visit the bay, are generally noisier and may have broadband source levels as much as 9 dB higher than the passenger vessels (Veirs et al. 2016). Considering this, passenger ship measurements were expected to yield conservative results if in the lower spectrum of the reported source levels range, or representative of both types of ships results if in the higher spectrum, thus justifying the use of this ship to estimate the noise environment in Resolute Bay three years earlier.
The Sea Explorer source level was obtained from Sound Pressure Level (SPL) measurements using an Ocean Sound Meter (JASCO Applied Sciences, Dartmouth, Nova Scotia, Canada) from a stationary rigid hull inflatable boat located ~50 m from the vessel, and back calculated to the position of the ship. At these short distances, we assumed that the transmission loss could be approximated by spherical spreading and a frequency‐dependent absorption term, i.e.,
where r is the slant range (m) between vessel and the Ocean Sound Meter, f is the frequency (Hz), and is a frequency‐dependent absorption term (Francois and Garrison 1982). For the transmission loss calculations and modeling, it was assumed that most of the vessel noise was generated by the propeller (Mitson and Knudsen 2003) at a single point at a depth of 3.5 m.
The Ocean Sound Meter used a sampling rate of 128 kHz to produce an acoustic bandwidth of 10 Hz to 64 kHz and the hydrophone was deployed at a depth of 15 m. During the start of the recording session, while the ship was at anchor, it was sunny with 1‐m chop with frequent whitecaps as a result of a 30 km/h wind from the southeast. A few hours later, when the ship started moving, the wind had decreased to 20 km/h with 0.5‐m waves and few whitecaps. When the ship was at anchor, the noise field was measured for 1 h continuously. During this time, a rigid hull inflatable boat with a single 50‐horsepower (1 horsepower = 0.75 kw) engine transported passengers to and from the ship. Also, while the ship was anchored, an 11‐minute recording was collected during a period when there were no small‐boat movements in the bay. Both of these recordings were used to estimate the source levels of the anchored ship.
Recording for vessel movement commenced when the ship started lifting its anchor and continued until the vessel was well out of the bay (~17 minutes). The ambient noise levels of the bay were recorded in the absence of any shipping on 14 August 2015. Weather was calm and sunny with wind speed of 5 km/h and ripples in the water.
To model the three‐dimensional sound field around this vessel, a two‐dimensional (range and depth) propagation model was run in 10° steps azimuthally around chosen ship locations along the eastern and western shipping lanes in and out of Resolute Bay (Fig. 2a). The model is based on ray theory (Jensen et al. 1994) and is a modified version of RAY (Bowlin et al. 1992), which includes absorption loss by the sediment, and frequency‐dependent absorption by ocean water (Francois and Garrison 1982). The model runs included local bathymetric data (Fig. 2a) and the sound speed profile shown in Fig. 2c. The inferred vessel source levels from (1) combined with the modeled transmission losses allowed estimation of the SPL for set locations around the ship. Since ray tracing is a high‐frequency approximation to the solution of the wave equation, the accuracy and validity at lower frequencies may be uncertain. Hovem (2013) suggested that the source and receiver should be at a height above the seabed of at least one‐half wavelength. For a receiver at 1 m above the seafloor, this implies that the low‐frequency cutoff for our modeling exercise is about 700 Hz. The model rms SPL presented here do therefore cover the bandwidth between 0.7 and 64 kHz.
Presence and movement of ships in Resolute Bay
Satellite Automatic Identification System (AIS) archive data from 2012 were used to determine the times of vessels absence, presence, and movements. In August and September of 2012, seven different vessels (n = 7) visited Resolute Bay. Two of these vessels had incomplete AIS records for either arrival or departure times. Thus, as required by Northern Canada Vessel Traffic Services Zone (NORDREG) and following the patterns of other vessels with complete records (i.e., AIS position was transmitted every few minutes), it was assumed these ships would transmit a position and time 0.5 h after arrival or 1 h before departure. According to NORDREG, vessels are required to report before entering, while operating and upon exiting northern Canadian waters (Tulaktarvik Inc. 2014). The times it took passenger and cargo vessels to enter and exit the bay via the two shipping lanes were cross‐referenced with time‐lapse footage set at 10‐s intervals using a Canon EOS T4 (Canon, Tokyo, Japan) with a 50‐mm lens mounted in a weather‐proof box with constant power supply facing the bay. The arrival times (i.e., time to enter the bay and reach anchoring location) were determined to be 10 and 30 minutes for passenger and cargo vessels, respectively, and the corresponding departure times (i.e., time to exit the bay) were 15 and 30 minutes for the two vessel types. Passenger vessels typically use the western lane and cargo vessels utilize the eastern lane (see Fig. 2a). An extra 5 minutes was added at the point of anchorage and prior to departure to account for noise generated by dropping or lifting the anchor. The average time a vessel spent anchored in the bay was 54 ± 21.3 h (mean ± SE), for a combined total of 378 h.
The arriving vessels anchored in one of two locations in the bay: west (n = 5) and north (n = 2; Appendix S1: Fig. S1). However, due to vessels more commonly anchoring in the west location, for the purposes of this study, we considered all fish detections together and thus, modeled ship noise levels for the west location.
Fish telemetry
Arctic cod were caught via hook‐and‐line (hook size #5 sabiki rigs, without feather) in four different locations in Resolute Bay in July 2012. The fish were kept in a holding tank full of seawater on the shore of the bay for 1 h prior to surgical placement of acoustic tags to ensure there were no effects of capture. A total of 85 individuals (mean total length of 19.9 ± 2.1 cm with minimum size of 15.5 cm and maximum 27.4 cm) were anaesthetized in MS222–seawater solution (4 g/20 L) and tagged by surgically implanting Vemco V6 acoustic tags (Vemco, Halifax, Nova Scotia, Canada) into the body cavity of the fish, using the protocol detailed in Kessel et al. (2015). Fish were released after regaining equilibrium in a holding tank. A Vemco VR2W 180 kHz acoustic receiver array consisting of 60 units was used to log detections of tagged fish and associated detection times in Resolute Bay (Appendix S1: Fig. S2). The array was deployed at the end of July 2012 and recovered in August 2013. Minimum receiver depth deployment was 15 m to account for ice cover, with spacing between individual units from 150 to 300 m. Moorings consisted of a rock anchor (~40 kg) attached to an ORE Port ME acoustic release (EdgeTech, West Wareham, Massachusetts, USA), receiver, and float via ~2 m rope. Sync tags were attached to 17 receivers across the array and were used for correction of receiver internal clock drift during the processing of positional data (Espinoza et al. 2011) and to estimate receiver performance and range.
Acoustic telemetry data processing
A caveat of using acoustic telemetry is receiver array performance with varying acoustic conditions in the environment. Thus, we tested our receiver array performance using sync tags (n = 17) for changes in sensitivity due to the variable noise conditions during periods of ship absence, movement, and presence. Sync tag detections were broken down by minute, separated into the same vessel variables as in our analysis for the behaviors and home range estimation and tested at three different distance intervals from each receiver (0, 88, and 150 m). We found no significant differences between vessel variables in the sync tag performance for either of the three distance intervals, suggesting there would be no bias to detecting our tagged fish.
Fixed station acoustic telemetry, the Vemco Positioning System (VPS), was used for advanced high‐resolution tracking of Arctic cod movements. Through complete coverage of the bay, the locations of individual fish were triangulated from the difference in detection times (in milliseconds) at three or more time‐synchronized receivers (Smith 2013). These positions were used to quantify home ranges and movement patterns of Arctic cod during periods of vessel absence, presence and movement.
A total of eight individuals were removed from further analysis due to insufficient data (believed to have left the system following tagging); thus, positional data for 77 Arctic cod individuals (mean, SD, minimum and maximum of total length for these individuals remained the same) were filtered for HPE (horizontal position error, a unitless estimate of the sensitivity of the calculated position; Smith 2013) of 19.9, any values larger than 20 were removed from further analysis. Due to vessel traffic occurrence being limited to the period between the end of July and end of September (as a result of sea ice), only data from 27 July 2012 to 30 September 2012 were considered. Thus, a total of 11,852 detections were available for further analysis.
We used adeHabitatHR and adeHabitatLT packages (Calenge 2006) in R (version 0.98.1103 running on Mac OS X 10.9.5; RStudio Team 2015) to estimate home ranges and movement behaviors of cod, respectively, with the following vessel variables: (1) vessels absent from the bay (VA), (2) vessels present/anchored in the bay (VP), and (3) vessels moving in or out of the bay (VM). During VA, the only noise in the bay would be from smaller boats, which, for this study, was considered a regular background noise. During VP, additional noise is produced by the generators of the vessel running to produce and supply it with power, as well as tenders transporting passengers or goods to the shore and back. During VM, noise is produced by the vessel's propellers, the vessel moving through the water, and also by the dropping or pulling of the anchor.
For home range (HR) determination, we used Kernel Utilization Distributions (KUD) and Minimum Convex Polygon (MCP; both reported in km2). To account for the differences in time frames (the number of days) of home ranges between the three vessel variables, we ran a simulation at 1,000 iterations for MCP, 50% and 95% KUD. We found that our results for VP were robust, whereas time biased our results for VM at MCP and 95% KUD. Thus, we used 50% KUD and MCP for VP, and only 50% KUD for VM; we refrained from reporting and discussing MCP for VM. The detection data were separated according to vessel variables. Because Arctic cod are schooling fish, we examined HR KUD at the population level (n = 77 for VA and VP and n = 15 for VM), but then investigated individuals as a secondary level of analysis to determine consistency in the patterns observed (individual HR for VA and VP was based on n = 77; for VM n = 1, due to ≥ 5 relocations requirement for HR estimation, thus, individual HR for VM were not included in further analysis and were not discussed).
Core HR for VP included vessels at both west (n = 5 vessels) and north (n = 2 vessels) anchoring locations combined. Analysis of detections from periods with vessels at the west anchor location produced a core home range very similar to that produced by detections from both locations (Appendix S1: Fig. S1) and the Hurlbert index of overlap between the two was 0.81. Core HR results for periods of VP at the north anchoring location only, showed cod mostly maintaining their original home range as during VA, except for retraction of the northern boundary to the south. In each, north and west, anchoring location results, we saw a consistent shift in the HR areas closest to vessels, which are also consistently represented in the combined location results. Thus, for simplicity, we used the core HR generated by the combined anchoring location data. An overlap examination was performed using CalcHR.R and Indices.txt (Fieberg and Kochanny 2005) on 50% KUD for VP, VA, and VM. Kruskal‐Wallis rank sum test was undertaken to examine differences in individual MCP area sizes between VA and VP.
For cod behavior, trajectories of individuals (n = 77) were broken into bursts according to the recorded time and date stamp (detection). Bursts are defined as discrete pieces of successive VPS positions (Turchin 1998) extracted from each individual's trajectory (a collection of VPS positions forming a continuous curve of that individual's movements; Calenge et al. 2009). Burst break‐off occurred when no detection between consecutive positions existed for > 30 minutes. This allowed for the elimination of prolonged/excessive periods between detections/positions, and thus, the separation of distinct behaviors. Correlation analysis was performed on all bursts with five or more positions. Variables (such as distance from first to last point of burst, linearity, mean, SD, and variance of distance travelled, turn angle, bearing, rate of movement, etc.) with correlation >0.4 were removed from further analysis. Three clusters were identified based on a “within‐groups‐sum‐of‐squares” plot. The movement trajectories were categorized/clustered using fuzzy clustering fanny method with Euclidean distances (Maechler et al. 2015) into three movement types (here also referred to as clusters or movement patterns) by analyzing the following metric variables that were selected based on significance (McLean et al. 2014): (1) sum of distance (P < 0.001; Kruskal‐Wallis rank sum test); (2) mean rate of movement (ROM; m/s; P < 0.001)); (3) variance of distance (m; P < 0.001); (4) mean turn angle (P < 0.001); and (5) variance in bearing (absolute angle; P < 0.001). Movement patterns were then subset into the three vessel variables and overall proportions of each were calculated from their frequencies (based on VA n = 73 individuals, VP n = 67, and VM n = 6). Proportions were also calculated for cod individuals. A chi‐squared test was performed for the overall proportions of Arctic cod using VA as the expected values. A Shapiro‐Wilk normality test revealed non‐normal distributions, and thus a Kruskal‐Wallis rank sum test was performed between separate movement patterns for VA, VP, and VM on the individual proportion values to determine the actual differences.
A generalized linear mixed model (glmmadmb in R) was run with Poisson response distribution and a random factor for the number of different IDs detected each day to examine any influence of environmental variables on the proportions of movement patterns. The variables used were mammal presence, daily dissolved oxygen, water temperature (°C), salinity, mean wind speed, and mean wind direction. A Satlantic STOR‐X submersible data logger (Halifax, Nova Scotia, Canada) with a Seabird 37‐SIP microCAT C‐T recorder (Sea‐Bird Scientific, Bellevue, Washington, USA) was used to collect hourly‐averaged salinity (PSU), water temperature (°C), and dissolved oxygen saturation (%), sampling for 30 s/h at resolutions of 1, 1, and 5 s, respectively. The instruments were located approximately 0.5 m above the seafloor, in 30 m of water at the head of the bay (74.68549° N 94.86194° W). Daily average air temperature and wind speed were acquired from the online archives of Environment and Climate Change Canada (data available online).1 Photoperiod (h) was obtained from the time and date online archives (Thorsen 2014). An Autonomous Multichannel Acoustic Recorder (AMAR; JASCO Applied Sciences Ltd., Darthmouth, Nova Scotia, Canada) recording frequencies between 10 Hz and 48 kHz was also deployed on a floating mooring 3 m above the seabed in 46 m of water just outside the bay. Vocalizations from this acoustic data were identified by an automated tonal call detector (Martin et al. 2014, Delarue et al. 2015), which established daily marine mammal presence.
Historical vessel activity (Fig. 1 Inlay)
Vessel voyage information was obtained from Canadian Coast Guard Services (1995 to 2009), and from Headland (2015) and MacFarlane (2012). One‐way vessel voyages were defined as follows: (1) vessels that had as an aim to cross partially or fully the Northwest Passage were counted as a single voyage unless they performed a return trip, in which case, it was counted as a second voyage; (2) each port‐to‐port trip in directions east to west, west to east, south to north, and north to south, performed by vessels, such as cargo or ice‐breakers, if these were known or distinguished from data set, was counted as a separate voyage; and (3) if a vessel discontinued reporting every day at 16:00 as is regulated by NORDREG, was considered to have left the NORDREG zone and thus the Parry Channel. Only vessels with length of > 50 m were used, thus tug boats and yachts < 50 m were excluded; submarines were excluded as well.
Results
Quantification of ship noise in an Arctic ecosystem
Noise was greater at the back of the ship when compared to the front (Fig. 2b; Trevorrow et al. 2008), thus the ship heading modulated the directionality and levels of the noise. The bathymetric depression at the head of Resolute Bay is a known location for high Arctic cod residency (Kessel et al. 2015). Based on the acoustic model, this area of the bay was shielded from ship noise entering the system until the vessel had crossed the mouth of the bay when transiting along one of the two identified shipping lanes (Fig. 2d). This was a result of a shallow sill located in the center of the bay's mouth that reaches ~1 m depth at low tide and acts as a physical barrier to sound from outside the bay. The summer ambient noise level observed in the bay prior to the arrival of the vessel was measured at a sound pressure level of 74 dB re 1μPa. When the Sea Explorer was anchored in the bay, this increased to 131 dB re 1μPa, reaching a maximum noise level of 147 dB re 1μPa when the ship was moving within the bay (Fig. 2e, g–i). The noise level increased significantly in the bay in the presence of ships, including in the deep depression at the head of the bay where cod reside. The above observations were used in subsequent analysis as a proxy for the noise levels and noise transmission loss patterns of ships encountered in 2012.
Spatial ecology of Arctic cod
We found that Arctic cod schools (n = 77) favored the northwestern part of the deep depression at the head of Resolute Bay when vessels were absent (VA) but relocated to the northeastern part when vessels were present (VP) and contracted to the northern part when vessels were moving (VM; Fig. 3). Displacement of the southern ends of the HRs was between 250 and 350 m for either VP or VM compared to VA. Hurlbert's index confirmed low levels of overlap among core habitat used by Arctic cod during VA, VP, and VM (VA and VP overlap was 0.31; VA and VM was 0.45; Fig. 3). The shift in HR during VP in comparison to VA occurred in the area surrounding the vessel, where estimated sound pressure level values were near and above 120 dB re 1μPa (Fig. 3). Mean for individual cod VA core HR area size was 0.22 km2 with lower and upper quartiles of 0.20 and 0.25, respectively, and standard deviation of 0.04. Mean for VP dropped slightly to 0.21 km2, with lower and upper quartiles of 0.18 and 0.25, respectively, and standard deviation 0.04. However, similarly to the school results, individual Arctic cod also exhibited low overlap in their core home ranges, where mean 50% KUD of Hurlbert's index for VA vs. VP was 0.24 with standard deviation of 0.15.
Figure 3.

Core home ranges (50%) of Arctic cod in Resolute Bay, Nunavut, Canada, when vessels are absent (VA; red), present (VP; purple), and moving (VM; yellow) are plotted over root meansquared sound pressure levels (rms SPL) of an anchored vessel. The rms SPL is centered at the most common large vessel anchoring location at the west part of Resolute Bay, Nunavut. Black curve denotes the 20‐m depth contour. North vessel anchoring location is also shown where two of the seven vessels were anchored (see Appendix S1: Fig. S1 for more details).
The mean of MCP changed significantly from 0.46 ± 0.01 km2 (mean ± SE) for VA to 0.34 ± 0.01 km2 for VP (P < 0.001, Kruskal‐Wallis test; Fig. 4a, b).
Figure 4.

Extended spatial use of Arctic cod in Resolute Bay, Nunavut, Canada. (a) Minimum convex polygon (MCP) area sizes for individual Arctic cod when vessels are present (VP; red) and absent (VA; blue) from the bay. Note: VP overlaps VA to show the decline in MCP area size during VP for each individual. (b) Mean values for MCP area sizes (mean ± SE) of Arctic cod individuals during VP (red, 0.335 km2) decreased significantly (P < 0.001) in comparison to VA (blue, 0.456 km2).
Arctic cod swimming behavior
Three distinct movement patterns were identified for Arctic cod: (1) searching, characterized by a medium rate of movement, low turning angle, medium to large sum of distance travelled, and medium variance of distance travelled, this behavior is typical of fish searching for food (Coughlin et al. 1992); (2) feeding, characterized by winding (tortuous trajectories with many changes in direction), slow (low rate of movement) movement, low overall distance travelled (sum of distance), and low variance of distance travelled, this behavior is typical of fish feeding, nesting, or mating (Kasumyan 1999), the latter two of which are not relevant as cod do not build nests and do not spawn during the study period; and (3) travelling, characterized by fast rate of movement, large variance of distance travelled, and very low turn angles, this is typical behavior of fish in transit, fleeing, or dispersing (McLean et al. 2014; Fig. 5a). Using VA proportion values as our overall expected proportions, significant differences were observed in VP overall movement pattern proportions (χ2 = 19.09, df = 2, P < 0.001), but not in VM overall movement pattern proportions (χ2 = 4.76, df = 2, P = 0.09; Fig. 5b). Comparing the different movement patterns for each vessel variable, we found that means of searching and travelling were significantly different between VA and VP (P = 0.017 and 0.026, respectively; Kruskal‐Wallis test; Fig. 5b), with searching decreasing and travelling increasing in proportion during VP. Proportions for feeding during VA and VP did not change significantly (P = 0.27). Furthermore, mean proportions for feeding during VM, as compared to VA, changed significantly, with feeding decreasing (P = 0.001), whereas searching and travelling did not change (P = 0.31 and 0.13).
Figure 5.

Movement pattern examples and proportions per vessel variable for Arctic cod in Resolute Bay, Nunavut. (a) The three characterized movement patterns (MP) of Arctic cod. Circles and squares denote detection locations. An example of MP 1 (searching) is shown with red movement path: individual 811 travelled a total distance of 1,539.75 m, had mean rate of movement (ROM) 0.16 m/s, mean turning angle 0.033, mean distance between relocations 76.99 m and variance of distance 898.12 m. An example of MP 2 (feeding) is shown in the inset with black movement path (note: scale here is 2 m): individual 812 travelled a total distance of 114.87 m with mean distance between relocations 1.53 m, mean ROM 0.0038 m/s and variance of distance of 1.46 m. An example of MP 3 (in‐transit) is shown with blue movement path: individual 818 travelled a total distance of 604.95 m, mean distance between relocations of 151.24 m, mean ROM 0.3304 m/s, variance of distance 3,676.84 m, and mean turn angle 0.016. Black line on general bay map denotes the area of the bay with depth 20–30 m. (b) Mean proportions of MP 1, 2, and 3 for Arctic cod and their standard error bars are plotted for each of the three vessel variables: vessels absent (VA; purple), vessels present (VP; blue) and vessels are moving (VM; green). Using VA as expected proportions, significant differences were observed in VA and VP overall MP proportions (χ2 = 19.09, P < 0.001), and VA and VM overall MP proportion (χ2 = 4.75, P = 0.093). Examining different MPs for each vessel variable, we found that exhibited MPs 1 and 3 were significantly different between VA and VP (P = 0.017 and 0.026, respectively); proportions for MP 2 during VA and VP did not change significantly (P = 0.27); mean proportions for MP 2 during VM as compared to VA decreased significantly (P = 0.001), while MPs 1 and 3 did not change significantly (P = 0.31, and 0.13, respectively).
The GLMM model revealed no significant influence or relationships of any of the examined environmental variables (mammal presence, daily dissolved oxygen, water temperature, salinity, mean wind speed, and mean wind direction) on the movement patterns.
Discussion
Spatial displacement of Arctic cod
Home ranges depict the habitat used by a species and an in‐situ comparison of periods with and without anthropogenic disturbance can provide a measure of a species’ response to the disturbance. In August and September of 2012, seven vessels visited Resolute Bay, facilitating such a comparison. Core areas (50%) in HR often indicate habitat of critical importance (Powell 2000) and our results indicate that Arctic cod were actively responding to noise produced by anchored and moving vessels within the bay and are exhibiting a negative response by moving away from the vessel to areas with lower noise levels.
During VP, individuals maintained the core area of their home range within the deep part of the bay (~30 m), an area probably preferred because of reduced predation risk from seabirds. The low overlap between VP and VA core areas indicates a horizontal displacement of cod for periods of vessel presence in the bay, supporting our first hypothesis. The observed 50% KUD during VM indicates that cod aggregated in the deepest part of the bay to the north. This is further shown by the low overlap with the core during periods of VA, thus supporting our second hypothesis on cod school aggregation and decrease in core HR for VM periods.
Studies have shown that fish can exhibit a sudden dive and school compression reaction when subjected to high noise levels from vessels (Fréon et al. 1993, Vabø et al. 2002). The greatest noise levels produced by vessels are during periods of transit, influenced by the type and condition of the propellers, speed, and the type of vessel (Mitson and Knudsen 2003). Arctic cod use shallow embayments with deep depressions (Welch et al. 1993, Kessel et al. 2015), likely to avoid detection by echolocation from toothed whales. They also exhibit an aggregating behavior linked to predatory events, including boat noise (Fréon et al. 1993, Mitson and Knudsen 2003). This is presumed to be a defense mechanism due to a perceived increase in predation risk (Shafiei Sabet et al. 2016). At this point, it is unclear if cod changed the actual depth they occupied during VP and VM in comparison to VA within the depression of the bay, thus we recommend that future studies incorporate depth, if possible, as a component into their design. Nonetheless, our results for VP and VM indicate that Arctic cod perceived ship noise as a threat, and reacted by moving away.
The full extent of habitat used by an animal depicts exploration beyond the HR and any changes due to disturbance can indicate sensitivity to that disturbance. This was identified and measured using MCP. MCP is the smallest area that includes all available positions of an animal's occurrence (IUCN 1994), and here is used to estimate the extent of occurrence or range of Arctic cod within the bay that include the areas an individual explores outside of its HR. By quantifying MCP we gained understanding of the exploratory forays that occur under normal conditions (during VA). Given that MCP includes areas of non‐critical importance, a perceived threat would decrease the forays into these areas and thus the size of MCP, which could be used as a further indicator of the species being disturbed. We observed a significant decrease in the MCP for all tagged Arctic cod individuals between VA and VP. This decrease in MCP areas during VP suggests that individuals were less exploratory and remained within a more confined area. Similar cautious movement behavior has been observed for other fish species during periods of increased predation risk and boat movements (Fréon et al. 1993, Shafiei Sabet et al. 2016). Thus, these results further indicate Arctic cod's sensitivity to vessel presence in the bay.
Disruption of Arctic cod behavior
Predators are well known for affecting the behavior of prey species; similarly, varying environmental conditions affect all animals. Our GLMM model revealed no influence of marine mammals on the behavior of Arctic cod in our study, likely due to the minimal presence of single individual seals for only 8 d out of over 60 d of observations with equal distribution during VA and VP. Beyond the GLMM variables, we also considered diel migration and diurnal ship activity. Arctic cod are known to exhibit diel migration patterns during winter and spring; however, these are not observed during the summer (Benoit et al. 2010), which was the period of interest in this study. Also, ship movements and presence did not follow particular pattern in regards to time of day and occurred during both day and night hours (note that more than one‐half of our study period had over 17 h of daylight per photoperiod), thus any diurnal influences are unlikely for our behavior results per vessel variable.
Quantifying behavioral patterns of animals is crucial for understanding their spatial ecology, the motivations driving their movements, and assessing any effects of anthropogenic disturbances (McLean et al. 2014). Significantly less feeding occurred during VM, but there was no significant difference in the proportion of in‐transit movement patterns in VM compared with VA, thus our third hypothesis regarding increase of high‐speed swimming patterns during VM was not supported. It is likely that our results for VM are biased due to low sampling size, thus any interpretations should be and are, in this paper, made with caution. However, the changes observed in the exhibited proportions of Arctic cod movement patterns during VP indicate that significantly more time was spent travelling greater distances at a faster rate of movement and less time was spent searching. These findings for periods of VP echo these for three‐spined stickleback (Gasterosteus aculeatus), European minnow (Phoxinus phoxinus; Purser and Radford 2011, Voellmy et al. 2014), and for Mediterranean damselfish (Chromis chromis; Bracciali et al. 2012). The evident switch in movement patterns during VP likely represents a behavioral trade‐off with negative implications for the overall energetics of individuals (Wright et al. 2007), especially during the summer months, when cod's exploitation of seasonally abundant food resources may be interrupted (Hop et al. 1997).
Noise acclimation potential
Studies on adaptation or acclimation to increased background noise have reported mixed results, although those examining anthropogenic noise in particular are scarce (Radford et al. 2014). Adaptation was observed for two freshwater goby species living in streams where the presence of a waterfall changed significantly the ambient noise levels (Lugli and Fine 2003). Bluefin tuna (Thunnus thynnus) was reported to acclimate to short (10–15 s) repeating loud noise, but not to long stimuli noise (10–15 m) of the same source (associated with wind farms), or to the regular boat noise associated with feeding time (Pérez‐Arjona et al. 2014). Evidence is also available that fish exposed to constant noise, such as that in aquaculture facilities, exhibit significantly higher hearing thresholds, and are acclimated to it (Caiger et al. 2012). In the Arctic, vessels only visit in the summer months and are not constantly present in one area. Thus, at this point it is unclear if Arctic cod will acclimate to the noise in the long term. In the short term, however, studies have shown that fish species living in noisy habitats have increased susceptibility to predation due to diminished response or inability to hear approaching predators (Simpson et al. 2016). For example, Scholik and Yan (2001) reported decreased hearing sensitivity for the hearing specialist fat head minnow (Pimephales promelas) with recovery depending on exposure duration and auditory frequency, which for the minnow took > 14 d. Similar results were seen in goldfish (Carassius auratus) and Amazonian catfish (Pimelodus pictus) with stronger effects in the vocalizing catfish (Amoser and Ladich 2003). Recent study reported that Arctic cod produces sounds to communicate (Riera et al. 2018), suggesting that cod may experience stronger effects as well. This could be of major concern, given that Arctic cod interact with marine mammal predators, including beluga and narwhal (Monodon monoceros) that use echolocation to locate prey.
Conclusion
Vessel traffic in the high Arctic has already increased significantly and as ice continues to recede, future projections cause concern among Arctic ecologists (Reeves et al. 2014), in part due to the associated underwater noise increase. Thus, the observed noise‐induced spatial avoidance via horizontal displacement and change in normal behavioral patterns of Arctic cod due to ship traffic in its natural environment are in support of these concerns. The changes observed here are relatively small scale, but also at relatively low ship activity (only a single ship was present in the bay at a given moment at the time of study, while in recent years two ships are commonly seen in the bay). However, given the exponential increase in vessel activity in the Parry Channel over the last couple of decades (Fig. 1 inset, historical vessel activity), if this trend continues, the observed shifts in cod habitat use and movements may become more pronounced. Given the importance of this species in the Arctic marine food web (Welch et al. 1993), such shifts have the potential to affect seabird and marine mammal predators.
In addition, indigenous peoples living in the Arctic are also expressing concern regarding vessel activity near settlements and marine mammal avoidance of vessels, thus, a disturbance of Arctic cod schooling and movements by increased ship traffic adds to their concerns. Although Arctic cod are not a common diet item, they are cherished for attracting valued marine mammals near settlements. For example, over one‐half of Canadian Inuit diet consists of subsistence‐hunted marine mammals (Wenzel 2009) and these are preferred due to their high nutritional value. Leftovers are used to feed sled dogs and to share in the community; inedible parts are made into jewelry and accessories, and sold to generate extra income (Wenzel 2009). Thus, Inuit's income and expenses for food may be affected if increasing ship traffic also disturbs Arctic cod when near Inuit settlements, contributing to exacerbation of an already existing food security issue (Lawn and Harvey 2003). Inuit are also expressing concern that changed behavior and reduced presence of marine mammals in close proximity to Inuit settlements may also increase the duration and distance travelled by Inuit for subsistence hunting trips, therefore also affecting their personal safety.
The Arctic ecosystem naturally has less species diversity than temperate and tropical climates, and thus, its resilience to disturbance is lower (Piatt and Anderson 1996). The concerns of ecologists and indigenous peoples taken with our results imply that if the Arctic ecosystem and its human inhabitants are to remain resilient to the pressures of climate change, management of underwater acoustic disturbance as an environmental stressor will be required. This study highlights the need for timely conservation action, and progress of international conservation and management targets for the Arctic.
Supporting information
Acknowledgments
This project was funded by the Ocean Tracking Network through the Canada Foundation for Innovation, and the Natural Sciences and Engineering Research Council of Canada and the Polar Continental Shelf Research Project to A. T. Fisk. A. T. Fisk and R. Williams acknowledge support from the Pew Marine Fellows program. Many thanks are extended to the community of Resolute Bay, Nunavut, and Rick Crawford for assistance with fieldwork.
Ivanova, S. V. , Kessel S. T., Espinoza M., McLean M. F., O'Neill C., Landry J., Hussey N. E., Williams R., Vagle S., and Fisk A. T.. 2020. Shipping alters the movement and behavior of Arctic cod (Boreogadus saida), a keystone fish in Arctic marine ecosystems. Ecological Applications 30(3):02050 10.1002/eap.2050
Corresponding Editor: Erik Nelson.
Note
Data Availability
Data are available on Zenodo: https://doi.org/10.5281/zenodo.3533308
Literature Cited
- Amoser, S. , and Ladich F.. 2003. Diversity in noise‐induced temporary hearing loss in otophysine fishes. Journal of the Acoustical Society of America 113:2170–2179. [DOI] [PubMed] [Google Scholar]
- Benoit, D. , Simard Y., Gagne J., Geoffroy M., and Fortier L.. 2010. From polar night to midnight sun: photoperiod, seal predation, and the diel vertical migrations of polar cod (Boreogadus saida) under landfast ice in the Arctic Ocean. Polar Biology 33:1505–1520. [Google Scholar]
- Bintanja, R. , and Selten F. M.. 2014. Future increases in Arctic precipitation linked to local evaporation and sea‐ice retreat. Nature 509:479–482. [DOI] [PubMed] [Google Scholar]
- Bowlin, J. B. , Spiesberger J. L., Duda T. F., and Freitag L. F.. 1992. Ocean acoustical ray‐tracing software RAY. Woods Hole Oceanographic Institution, Woods Hole, Massachusetts, USA. [Google Scholar]
- Bracciali, C. , Campobello D., Giacoma C., and Sarà G.. 2012. Effects of nautical traffic and noise on foraging patterns of mediterranean damselfish (Chromis chromis). PLoS ONE 7:e40582. [DOI] [PMC free article] [PubMed] [Google Scholar]
- Bradstreet, M. S. , and Cross W. E.. 1982. Trophic relationships at high Arctic ice edges. Arctic 35:1–12. [Google Scholar]
- Brekke, B. , and Gabrielsen G. W.. 1994. Assimilation efficiency of adult Kittiwakes and Brunnich's Guillemots fed capelin and Arctic cod. Polar Biology 14:279–284. [Google Scholar]
- Caiger, P. E. , Montgomery J. C., and Radford C. A.. 2012. Chronic low‐intensity noise exposure affects the hearing thresholds of juvenile snapper. Marine Ecology Progress Series 466:225–232. [Google Scholar]
- Calenge, C. 2006. The package adehabitat for the R software: a tool for the analysis of space and habitat use by animals. Ecological Modelling 197:516–519. [Google Scholar]
- Calenge, C. , Dray S., and Royer‐Carenzi M.. 2009. The concept of animals’ trajectories from a data analysis perspective. Ecological Informatics 4:34–41. [Google Scholar]
- Comiso, J. C. 2012. Large decadal decline of the arctic multiyear ice cover. Journal of Climate 25:1176–1193. [Google Scholar]
- Comiso, J. C. , Parkinson C. L., Gersten R., and Stock L.. 2008. Accelerated decline in the Arctic Sea ice cover. Geophysical Research Letters 35:L01703. [Google Scholar]
- Coughlin, D. J. , Strickler J. R., and Sanderson B.. 1992. Swimming and search behaviour in clownfish, Amphiprion perideraion, larvae. Animal Behavior 44:427–440. [Google Scholar]
- Delarue, J. , MacDonnell J., Kowarski K., Martin B., Mouy X., and Hannay D.. 2015. Northeastern Chukchi Sea Joint Acoustic Monitoring Program 2013–2014 JASCO Document #01023. Technical report by JASCO Applied Sciences for Shell Exploration & Production, Anchorage, Alaska, USA. [Google Scholar]
- Espinoza, M. , Farrugia T. J., Webber D. M., Smith F., and Lowe C. G.. 2011. Testing a new acoustic telemetry technique to quantify long‐term, fine‐scale movements of aquatic animals. Fisheries Research 108:364–371. [Google Scholar]
- Fieberg, J. , and Kochanny C. O.. 2005. Quantifying home‐range overlap: the importance of the utilization distribution. Journal of Wildlife Management 69:1346. [Google Scholar]
- Francois, R. E. , and Garrison G. R.. 1982. Sound absorption based on ocean measurements. Part II: boric acid contribution and equation for total absorption. Journal of the Acoustical Society of America 72:1879–1890. [Google Scholar]
- Fréon, P. , Gerlotto F., and Soria M.. 1993. Variability of Harengula spp. school reactions to boats or predators in shallow water. ICES Marine Science Symposia 196:30–35. [Google Scholar]
- Gaston, A. J. , Smith P. A., and Provencher J. F.. 2012. Marine science and some consequences for marine birds and their prey. ICES Journal of Marine Science 69:1218–1225. [Google Scholar]
- Gautier, A. 2019. Arctic sea ice reaches second lowest minimum in satellite record. http://nsidc.org/arcticseaicenews/2019/09/arctic-sea-ice-reaches-second-lowest-minimum-in-satellite-record/
- Graham, M. , and Hop H.. 1995. Aspects of reproduction and larval biology of Arctic cod (Boreogadus saida). Arctic 48:130–135. [Google Scholar]
- Harwood, L. A. , Smith T. G., George J. C., Sandstrom S. J., Walkusz W., and Divoky G. J.. 2015. Change in the Beaufort Sea ecosystem: diverging trends in body condition and / or production in five marine vertebrate species. Progress in Oceanography 136:263–273. [Google Scholar]
- Hastings, M. C. , Popper A. N., Finneran J. J., and Lanford P. J.. 1996. Effects of low frequency underwater sound on hair cells of the inner ear and lateral line of the teleost fish Astronotus ocellatus . Journal of the Acoustical Society of America 99:1759–1766. [DOI] [PubMed] [Google Scholar]
- Headland, R. K. 2015. Transits of the Northwest Passage to end of the 2015 navigation season. Cambridge: Scott Polar Research Institute, University of Cambridge, Cambridge, UK. [Google Scholar]
- Hop, H. , Welch H. E., and Crawford R. E.. 1997. Population structure and feeding ecology of Arctic cod schools in the Canadian Arctic. American Fisheries Society Symposium 19:68–80. [Google Scholar]
- Hovem, J. M. 2013. Ray trace modeling of underwater sound propagation Pages 573–598 in Beghi M. G., editor. Modeling and measurement methods for acoustic waves and for acoustic microdevices. IntechOpen, London, UK. [Google Scholar]
- Hussey, N. E. , et al. 2015. Aquatic animal telemetry: a panoramic window into the underwater world. Science 348:1255642. [DOI] [PubMed] [Google Scholar]
- IUCN . 1994. IUCN Red List categories and criteria version 2.3. IUCN, Gland, Switzerland. [Google Scholar]
- Jensen, F. B. , Kuperman W. A., Porter M. B., and Schmidt H.. 1994. Computational ocean acoustics. American Institute of Physics, New York, New York, USA. [Google Scholar]
- Johannessen, O. M. , et al. 2004. Arctic climate change: observed and modelled temperature and sea‐ice variability. Tellus A: Dynamic Meteorology and Oceanography 56:328–341. [Google Scholar]
- Judson, B. 2010. Trends in Canadian Arctic shipping traffic—myths and rumours. Icetech 2010 7:1292–1299. [Google Scholar]
- Kasumyan, A. O. 1999. Olfaction and taste senses in sturgeon behaviour. Journal of Applied Ichthyology 15:228–232. [Google Scholar]
- Kasumyan, A. O. 2005. Structure and function of the auditory system in fishes. Journal of Ichthyology 45:S223–S270. [Google Scholar]
- Kessel, S. T. , Hussey N. E., Crawford R. E., Yurkowski D. J., O'Neill C., and Fisk A. T.. 2015. Distinct patterns of Arctic cod (Boreogadus saida) presence and absence in a shallow high Arctic embayment, revealed across open‐water and ice‐covered periods through acoustic telemetry. Polar Biology 39:1057–1068. [Google Scholar]
- Lawn, J. , and Harvey D.. 2003. Nutrition and food security in Kugaaruk, Nunavut: Baseline survey for the food mail pilot project. Indian and Northern Affairs Canada, Kugaaruk, Nunavut, Canada. [Google Scholar]
- Lugli, M. , and Fine M. L.. 2003. Acoustic communication in two freshwater gobies: ambient noise and short‐range propagation in shallow streams. Journal of the Acoustical Society of America 114:512–521. [DOI] [PubMed] [Google Scholar]
- MacFarlane, J. M. 2012. Full transits of the Canadian Northwest Passage. Nauticapedia.ca. http://nauticapedia.ca/Articles/NWP_Fulltransits.php [Google Scholar]
- Maechler, M. , Struyf A., Hubert M., Hornik K., Studer M., and Roudier P.. 2015. Package ‘cluster’: cluster analysis basics and extensions. https://cran.r-project.org/web/packages/cluster/cluster.pdf
- Martin, B. , Kowarski K., Mouy X., and Moors‐Murphy H.. 2014. Recording and identification of marine mammal vocalizations on the Scotian Shelf and slope. Pages 1–6 in 2014 oceans—St. John's. IEEE, St. John's, Newfoundland, Canada.
- McDonald, M. A. , Hildebrand J. A., and Wiggins S. M.. 2006. Increases in deep ocean ambient noise in the Northeast Pacific west of San Nicolas Island, California. Journal of the Acoustical Society of America 120:711–718. [DOI] [PubMed] [Google Scholar]
- McLean, M. F. , Simpfendorfer C. A., Heupel M. R., Dadswell M. J., and Stokesbury M. J. W.. 2014. Diversity of behavioural patterns displayed by a summer feeding aggregation of Atlantic sturgeon in the intertidal region of Minas Basin, Bay of Fundy, Canada. Marine Ecology Progress Series 496:59–69. [Google Scholar]
- Melia, N. , Haines K., and Hawkins E.. 2016. Sea ice decline and 21st century trans‐Arctic shipping routes. Geophysical Research Letters 43:9720–9728. [Google Scholar]
- Minerals Management Service Alaska OCS Region . 2007. Chukchi Sea planning area, oil and gas sale 193 and the seismic surveying activities in the Chukchi Sea. U.S. Department of the Interior Minerals Management Service Alaska OCS Region, Anchorage, Alaska, USA. [Google Scholar]
- Mitson, R. B. , and Knudsen H. P.. 2003. Causes and effects of underwater noise on fish abundance estimation. Aquatic Living Resources 16:255–263. [Google Scholar]
- Overland, J. E. , and Wang M.. 2013. When will the summer Arctic be nearly sea ice free? Geophysical Research Letters 40:2097–2101. [Google Scholar]
- Pérez‐Arjona, I. , Espinosa V., Puig V., Ordóñez P., Soliveres E., Poveda P., and Ramis J.. 2014. Effects of offshore wind farms operational noise on Bluefin tuna behaviour. Pages 1417–1422 in UA2014—2nd International Conference and Exhibition on Underwater Acoustics. Island of Rhodes, Greece. [Google Scholar]
- Piatt, J. F. , and Anderson P.. 1996. Response of Common Murres to the Exxon Valdez oil spill and long‐term changes in the Gulf of Alaska Marine Ecosystem. American Fisheries Society Symposium 18:720–737. [Google Scholar]
- Picciulin, M. , Sebastianutto L., Codarin A., Farina A., and Ferrero E. A.. 2010. In situ behavioural responses to boat noise exposure of Gobius cruentatus (Gmelin, 1789; fam Gobiidae) and Chromis chromis (Linnaeus, 1758; fam. Pomacentridae) living in a Marine Protected Area. Journal of Experimental Marine Biology and Ecology 386:125–132. [Google Scholar]
- Popper, A. N. , and Fay R. R.. 2011. Rethinking sound detection by fishes. Hearing Research 273:25–36. [DOI] [PubMed] [Google Scholar]
- Popper, A. N. , and Hastings M. C.. 2009. The effects of anthropogenic sources of sound on fishes. Journal of Fish Biology 75:455–489. [DOI] [PubMed] [Google Scholar]
- Powell, R. A. 2000. Animal home ranges and territories and home range estimators Pages 65–110 in Boitani L., and Fuller T. K., editors. Research techniques in animal ecology—controversies and consequences. Columbia University Press, New York, New York. [Google Scholar]
- Purser, J. , and Radford A. N.. 2011. Acoustic noise induces attention shifts and reduces foraging performance in three‐spined sticklebacks (Gasterosteus aculeatus). PLoS ONE 6:e17478. [DOI] [PMC free article] [PubMed] [Google Scholar]
- Radford, A. N. , Kerridge E., and Simpson S. D.. 2014. Acoustic communication in a noisy world: Can fish compete with anthropogenic noise? Behavioral Ecology 25:1022–1030. [Google Scholar]
- Reeves, R. , et al. 2014. Distribution of endemic cetaceans in relation to hydrocarbon development and commercial shipping in a warming Arctic. Marine Policy 44:375–389. [Google Scholar]
- Richardson, M. , Cowtan K., Hawkins E., and Stolpe M. B.. 2016. Reconciled climate response estimates from climate models and the energy budget of Earth. Nature Climate Change 6:931–935. [Google Scholar]
- Riera, A. , Rountree R. A., Pine M. K., and Juanes F.. 2018. Sounds of Arctic cod (Boreogadus saida) in captivity: a preliminary description. Journal of the Acoustical Society of America 143:EL317–EL321. [DOI] [PubMed] [Google Scholar]
- RStudio Team . 2015. RStudio: Integrated development for R RStudio, Inc., Boston, Massachuse, USA: http://www.rstudio.com/ [Google Scholar]
- Sandström, A. , Eriksson B. K., Karås P., Isaeus M., and Schreiber H.. 2005. Boating and navigation activities influence the recruitment of fish in a Baltic Sea archipelago area. Journal of the Human Environment 34:125–130. [PubMed] [Google Scholar]
- Scholik, A. R. , and Yan H. Y.. 2001. Effects of underwater noise on auditory sensitivity of a cyprinid fish. Hearing Research 152:17–24. [DOI] [PubMed] [Google Scholar]
- Shafiei Sabet, S. , Wesdorp K., Campbell J., Snelderwaard P., and Slabbekoorn H.. 2016. Behavioural responses to sound exposure in captivity by two fish species with different hearing ability. Animal Behavior 116:1–11. [Google Scholar]
- Simpson, S. D. , Radford A. N., Nedelec S. L., Ferrari M. C. O., Chivers D. P., McCormick M. I., and Meekan M. G.. 2016. Anthropogenic noise increases fish mortality by predation. Nature Communications 7:10544. [DOI] [PMC free article] [PubMed] [Google Scholar]
- Slabbekoorn, H. , Bouton N., van Opzeeland I., Coers A., ten Cate C., and Popper A. N.. 2010. A noisy spring: the impact of globally rising underwater sound levels on fish. Trends in Ecology & Evolution 25:419–427. [DOI] [PubMed] [Google Scholar]
- Smith, F. 2013. Understanding HPE in the VEMCO Positioning System (VPS). Vemco, Halifax, Nova Scotia, Canada. [Google Scholar]
- Thorsen, S. 2014. Sunrise and sunset times in Resolute Bay. https://www.timeanddate.com/sun/canada/resolute [Google Scholar]
- Tournadre, J. 2014. Anthropogenic pressure on the open ocean: the growth of ship traffic revealed by altimeter data analysis. Geophysical Research Letters 41:7924–7932. [Google Scholar]
- Trevorrow, M. V. , Vasiliev B., and Vagle S.. 2008. Directionality and maneuvering effects on a surface ship underwater acoustic signature. Journal of the Acoustical Society of America 124:767–778. [DOI] [PubMed] [Google Scholar]
- Tulaktarvik Inc . 2014. Submission to the tanker safety expert panel (Phase II—‘North of 60’). Tulaktarvik Inc ., Iqaluit, Nunavut, Canada.
- Turchin, P. 1998. Quantitative analysis of movement: measuring and modeling population redistribution in plants and animals. Sinauer Associates, Sunderland, Massachusetts, USA. [Google Scholar]
- Vabø, R. , Olsen K., and Huse I.. 2002. The effect of vessel avoidance of wintering Norwegian spring spawning herring. Fisheries Research 58:59–77. [Google Scholar]
- Veirs, S. , Veirs V., and Wood J.. 2016. Ship noise in an urban estuary extends to frequencies used for echolocation by endangered killer whales. PeerJ 4:e1657. [DOI] [PMC free article] [PubMed] [Google Scholar]
- Voellmy, I. K. , Purser J., Flynn D., Kennedy P., Simpson S. D., and Radford A. N.. 2014. Acoustic noise reduces foraging success in two sympatric fish species via different mechanisms. Animal Behavior 89:191–198. [Google Scholar]
- Welch, H. E. , Crawford R. E., and Hop H.. 1993. Occurrence of Arctic cod (Boreogadus‐Saida) schools and their vulnerability to predation in the Canadian high Arctic. Arctic 46:331–339. [Google Scholar]
- Wenzel, G. W. 2009. Canadian Inuit subsistence and ecological instability—If the climate changes, must the Inuit? Polar Research 28:89–99. [Google Scholar]
- Wright, A. J. , et al. 2007. Anthropogenic noise as a stressor in animals: a multidisciplinary perspective. International Journal of Comparative Psychology 20:250–273. [Google Scholar]
- Wysocki, L. E. , and Ladich F.. 2005. Hearing in fishes under noise conditions. Journal of the Association for Research in Otolaryngology 6:28–36. [DOI] [PMC free article] [PubMed] [Google Scholar]
Associated Data
This section collects any data citations, data availability statements, or supplementary materials included in this article.
Supplementary Materials
Data Availability Statement
Data are available on Zenodo: https://doi.org/10.5281/zenodo.3533308