

Abstract
Background
Chest computed tomography (CT) in children with cystic fibrosis (CF) is sensitive in detecting early airways disease. The pressure‐controlled CT‐protocol combines a total lung capacity scan (TLC PC‐CT) with a near functional residual capacity scan (FRC PC‐CT) under general anesthesia, while another CT‐protocol is acquired during free breathing (FB‐CT) near functional residual capacity. The aim of this study was to evaluate the sensitivity in detecting airways disease of both protocols in two cohorts.
Methods
Routine PC‐CTs (Princess Margaret Children's Hospital) and FB‐CTs (Erasmus MC—Sophia Children's Hospital) were retrospectively collected from CF children aged 2 to 6 years. Total airways disease (%disease), bronchiectasis (%Bx), and low attenuation regions (%LAR) were scored on CTs using the Perth‐Rotterdam annotated grid morphometric analysis‐CF method. The Wilcoxon signed‐rank test was used for differences between TLC and FRC PC‐CTs and the Wilcoxon rank‐sum test for differences between FRC PC‐CTs and FB‐CTs.
Results
Fifty patients with PC‐CTs (21 male, aged 2.5‐5.5 years) and 42 patients with FB‐CTs (26 male, aged 2.3‐6.8 years) were included. %Disease was higher on TLC PC‐CTs compared with FRC PC‐CTs (median 4.51 vs 2.49; P < .001). %Disease and %Bx were not significantly different between TLC PC‐CTs and FB‐CTs (median 4.51% vs 3.75%; P = .143 and 0.52% vs 0.57%; P = .849). %Disease, %Bx, and %LAR were not significantly different between FRC PC‐CTs and FB‐CTs (median 2.49% vs 3.75%; P = .055, 0.54% vs 0.57%; P = .797, and 2.49% vs 1.53%; P = .448).
Conclusions
Our data suggest that FRC PC‐CTs are less sensitive than TLC PC‐CTs and that FB‐CTs have similar sensitivity to PC‐CTs in detecting lung disease. FB‐CTs seem to be a viable alternative for PC‐CTs to track CF lung disease in young patients with CF.
Keywords: chest CT, cystic fibrosis, volume control, young children
Abbreviations
- AREST‐CF
Australian respiratory early surveillance team for cystic fibrosis
- CF
cystic fibrosis
- CT
computed tomography
- FB‐CT
free breathing computed tomography
- FRC
functional residual capacity
- LAR
low attenuation region
- ICC
intraclass correlation coefficient
- PC‐CT
pressure‐controlled computed tomography acquired under general anesthesia
- PRAGMA‐CF
Perth‐Rotterdam annotated grid morphometric analysis for cystic fibrosis
- TLC
total lung capacity
1. INTRODUCTION
Cystic fibrosis (CF) lung disease starts in infancy; lung abnormalities have been demonstrated on chest computed tomography (CT) in 1‐year‐old children. 1 , 2 Timely detection of lung disease in young children is considered important to initiate or change treatment with the aim to prevent progression into irreversible lung damage even though there are no well‐established therapies for this age category. Chest CT is the current gold standard to detect airways disease, including bronchiectasis, airway wall thickening, mucous plugging, and low attenuation regions (LAR). 3 , 4 , 5 , 6 The presence of bronchiectasis is a highly relevant clinical finding; it negatively affects the quality of life and increases the risk of respiratory tract exacerbations. 7 , 8 Airway wall thickening and mucous plugs are both the result of lung inflammation and have a prevalence of 85% and 79% in children with CF, respectively. 9 LAR are considered indirect visualizations of small airway disease on CT, and are thought to represent a combination of trapped air and hypoperfusion. 7 , 10 , 11 For children of 6 years and above standardization of lung volumes during CT acquisition has been advocated when using objective and sensitive assessments of airway dimensions to diagnose bronchiectasis, airway wall thickening, and LAR. 12 , 13 , 14 , 15 In these CF patients bronchiectasis, airway wall thickening and mucous plugs are routinely assessed on inspiratory CT, 1 whereas LAR are assessed on expiratory CT. 11 To optimize lung volume for a CT‐scan it can be acquired in cooperative children during a short voluntary breath hold after a deep inspiration near total lung capacity (TLC) and after expiration near residual volume. A lung function scientist trains the children with or without a spirometer before the CT and supervises them during these breath holds during CT acquisition. This method is described as the technician‐guided chest CT method. 16
In young, noncooperative children, chest CTs can be acquired under general anesthesia using a pressure‐controlled CT‐protocol (PC‐CT) to minimize movement artefacts and allow CT‐scanning at inspiration and expiration. 17 A low‐dose inspiratory PC‐CT is acquired to evaluate airways disease after inflating the lungs close to TLC using a transpulmonary pressure of 25 to 30 cm H2O. An ultra‐low‐dose expiratory PC‐CT to evaluate LAR is acquired at a transpulmonary pressure of 0 cm H2O, which results in a volume level close to functional residual capacity (FRC). 18 A disadvantage of PC‐CT, however, is that it requires general anesthesia. Newer generations of fast multislice CT‐scanners allow low‐dose chest CTs to be acquired during free breathing (FB‐CT) with limited motion artefacts and without the need for general anesthesia. 16 , 19 With FB‐CT a single low dose CT is acquired near FRC to evaluate both airways disease and LAR. A disadvantage of the FB‐CT method compared with PC‐CT is that the lung volume during acquisition is not controlled. 16
Even though control of lung volume during CT is preferred, structural lung disease can still be detected and scored on scans without volume control. In school‐aged children the CF‐CT scores on FRC‐CTs correlated well with those on TLC‐CTs. 20 However, in young children, the sensitivity of bronchiectasis detection on FRC PC‐CT was found to be lower compared with a TLC PC‐CT using the CF‐CT scoring system, 21 likely due to the low prevalence of bronchiectasis in this age group. Recently, a more sensitive scoring method, the Perth‐Rotterdam Annotated Grid Morphometry Analysis of Cystic Fibrosis (PRAGMA‐CF), has been developed for the quantification of early lung disease in young children. To date, the sensitivity of PRAGMA‐CF to detect airways disease on TLC PC‐CTs has not been compared with FRC PC‐CTs or FRC FB‐CTs in young children with CF.
The aim of this study is to evaluate the extent of airways disease on low‐dose TLC PC‐CT to ultra‐low‐dose FRC PC‐CT and of ultra‐low‐dose FRC PC‐CT to low‐dose FRC FB‐CT using PRAGMA‐CF in two cohorts of young children monitored using the AREST‐CF program.
We hypothesized that TLC PC‐CT is more sensitive to detect airways disease compared with FRC PC‐CT. Furthermore, we expect FRC PC‐CT and FRC FB‐CT to be equally sensitive to track airways disease and LAR.
2. MATERIALS AND METHODS
2.1. Study population
Routine annual or biennial CTs of patients with CF were retrospectively collected; PC‐CTs from the Princess Margaret Children's Hospital, Perth, Australia and FRC FB‐CTs from the Erasmus MC‐Sophia Children's Hospital, Rotterdam, The Netherlands. Patients in Perth and Rotterdam were both routinely followed according to the Australian Respiratory Early Surveillance Team for Cystic Fibrosis (AREST‐CF) protocol. 22
2.1.1. Pressure‐controlled computed tomography
Inclusion criteria: diagnosis of CF, participation in AREST‐CF cohort in Perth, age between 2 and 6 years and availability of a TLC PC‐CT and FRC PC‐CT. All PC‐CTs before 2012 were obtained with a Philips Brilliance 64 CT‐scanner (Phillips Healthcare, Jolimont, WA) and from 2012 with a Siemens SOMATOM Definition Flash CT‐scanner (Siemens Healthcare, Bayswater, Victoria, Australia). Detailed scan parameters can be found in online supplementary material (Table S1). All PC‐CT were acquired under general anesthesia.
2.1.2. Free‐breathing computed tomography
Inclusion criteria: diagnosis of CF, participation in CF‐CT cohort in Rotterdam, age between 2 and 6 years and availability of FRC FB‐CT or technician‐guided FRC‐CT. Technician‐guided FRC‐CTs were included in the FB‐CT group and will also be addressed as FB‐CT in this paper, because technician‐guided FRC‐CTs are acquired near FRC volume, similar to FB‐CTs. 16 , 19 All CTs from Rotterdam were obtained with SOMATOM Definition Flash CT‐scanner (Siemens Healthcare, Forchheim, Germany). Detailed scan parameters can be found in the Table S1. All FB‐CTs were acquired without sedation.
2.2. PRAGMA‐CF scoring
All CTs were anonymized and randomized before being assessed using PRAGMA‐CF method. PRAGMA‐CF is a morphological grid‐based assessment method for the quantification of airways disease in young children with CF. 23 Grid size is adjusted to the width of the lung. In short, the following structural abnormalities are annotated on axial CT‐slices according to a hierarchical system (highest to lowest priority): bronchiectasis, mucous plugging, airway wall thickening, atelectasis, or normal lung. For each of these components, the volume is computed and expressed as a percentage (%) of the total lung volume (ie, %bronchiectasis, %mucous plugging, %airway wall thickening, %atelectasis, and %normal lung. In addition, %disease, representative of total structural disease extent and incorporating all CT changes related to airways disease, is computed as the sum of %bronchiectasis, %mucous plugging, and %airway wall thickening. The volume of atelectasis (%atelectasis) is subtracted from the total lung volume before computing %disease score in all PC‐CTs, because atelectasis on PC‐CT can be the consequence of general anesthesia in children and is not always related to CF lung disease. 18 For FB‐CT, volume of atelectasis was also subtracted from total lung volume for consistency, even though these CTs were acquired without general anesthesia or sedation. %Bronchiectasis, %mucous plugging, and %airway wall thickening were scored on TLC and FRC PC‐CTs and on FRC FB‐CTs. LAR was scored on FRC PC‐CTs and FRC FB‐CTs and expressed as a percentage of total lung volume (%LAR). All scans were scored by a single observer (MCJO), a medical master student certified in CF‐CT scoring and PRAGMA‐CF scoring. To determine intra‐observer reliability a subset of 30 CTs was re‐randomized and rescored after more than 1 month.
2.3. Statistical analysis
Patient characteristics are computed using descriptive statistics. PRAGMA‐CF scores are computed as median (range). The Wilcoxon rank‐sum test was conducted to compare continuous patient characteristics and to compare PRAGMA‐CF scores. Fisher's exact test was used to compare categorical patient characteristics. The Wilcoxon signed‐rank test was used to compare PRAGMA‐CF scores in paired data (TLC PC‐CT with FRC PC‐CT). For comparisons with the subscore %bronchiectasis only patients with bronchiectasis were included, being considered a group with more severe airways disease. %Disease scores were divided in high (above median) and low (below median) score groups to investigate the relationship between %atelectasis and %disease. Intraobserver reliability was assessed using the intraclass correlation coefficient (ICC). Because no universally applicable standards are available for reliability, an ICC between 0.4 and 0.6 was considered moderate, between 0.6 and 0.8 good, and greater than 0.8 excellent. 23 The relationship between PRAGMA‐CF scores and age was investigated using linear regression analysis. For %bronchiectasis, the logarithmic scale was used because the assumption that the variance of the error terms is constant (homoscedasticity) was not satisfied in the original scale. This regression was repeated with the exclusion of the second FRC FB‐CT of patients with follow‐up CTs to investigate if the relationship still existed. No correction was applied to account for multiple testing. A P value of < .05 was selected as significant.
3. RESULTS
3.1. Study population
A total of 170 patients with AREST‐CF having PC‐CTs met the inclusion criteria. About 50 out of 170 patients with each a TLC PC‐CT and FRC PC‐CT were randomly selected and included in this study. A total of 37 patients with CF‐CT met the inclusion criteria and were included in this study, of which four patients had two routine CTs (one baseline FB‐CT and one follow‐up technician‐guided CT) and one patient had two FB‐CTs. Hence, a total of 42 CTs were included in the FRC FB‐CT group consisting of 29 FRC FB‐CTs and 13 technician‐guided FRC‐CTs. Patient characteristics and their comparisons can be found in Table 1.
Table 1.
Patient characteristics and prevalence of structural abnormalities scored on FRC FB‐CT, TLC PC‐CT, and FRC‐CT
| TLC/FRC PC‐CT | FRC FB‐CT | P value | |
|---|---|---|---|
| Patient characteristics | |||
| Total n | 50 | 42 | |
| Male total n (%) | 21 (42) | 26 (62) | .06 |
| Age, y a | 4.25 (2.51‐5.48) | 4.12 (2.28‐6.77) | 1.00 |
| Pancreatic insufficiency n (%) | 40 (80) | 39 (93) | .13 |
| Homozygous deltaF508 n (%) b | 23 (46) | 28 (67) | .06 |
| Heterozygous deltaF508 n (%) b | 26 (52) | 14 (33) | .09 |
| Two other mutations n (%) b | 1 (2) | 0 (0) | |
| Pseudomonas n (%) c | 13 (26) | 10 (24) | 1.00 |
| TLC PC‐CT | FRC PC‐CT | FRC FB‐CT | |
|---|---|---|---|
| Prevalence structural abnormalities | |||
| Bronchiectasis n (%) | 14 (28) | 9 (18) | 18 (43) |
| Airway wall thickening n (%) | 50 (100) | 50 (100) | 42 (100) |
| Mucous plugging n (%) | 4 (8) | 6 (12) | 14 (33) |
| Atelectasis n (%) | 32 (64) | 22 (44) | 14 (33) |
| Low attenuation region n (%) | 43 (86) | 31 (74) | |
Note: Data are presented as a number of patients with median percentage between brackets unless otherwise specified.
Abbreviations: FRC FB‐CT, functional residual capacity free‐breathing computed tomography; FRC PC‐CT, functional residual capacity expiratory pressure‐controlled computed tomography; TLC PC‐CT, total lung capacity inspiratory pressure‐controlled computed tomography.
Age is presented as median (range).
Genotypes of patients were divided in patients with a homozygous deltaF508 genotype (deltaF508/deltaF508), patients with a heterozygous deltaF508 genotype (deltaF508/other mutation), and patients with two other mutation genotypes.
Pseudomonas detected in BAL at the time of the scans or in the past.
Bronchiectasis was detected in up to 43% in the two CT‐protocol groups (see Table 1). There was no significant difference in age between the patients with bronchiectasis and patients without bronchiectasis observed (median [range] 4.31 years [2.28‐6.77] and 4.17 years [2.70‐6.54], respectively, P = .357). Because of the high prevalence of patients without bronchiectasis (%bronchiectasis = 0%) we only compared %bronchiectasis between the two cohorts for those patients who had a subscore above 0%. As can be seen in Table 1, this resulted in inclusion of 14 patients in the TLC PC‐CT group, nine patients in the FRC PC‐CT group and 18 patients in the FRC PC‐CT group.
Atelectasis was scored in 64% of the TLC PC‐CT, 44% of the FRC PC‐CT, and 33% of the FRC FB‐CT group (Table 1). The median value for %disease subscore for the two CT‐protocol groups combined was 3.67%. For further analysis, we considered a value for %disease higher than 3.67% as the high disease group, whereas %disease below 3.67% was considered the low disease group. %Atelectasis was higher in the FRC PC‐CT high disease group compared with the FRC PC‐CT low disease group (P = .001) (Table S2).
3.2. PRAGMA‐CF scoring: TLC PC‐CT vs FRC PC‐CT vs FRC FB‐CT
Figure 1 shows the boxplots of %bronchiectasis, %disease, %airway wall thickening, and %LAR scored for the PC‐CT and FB‐CT groups. There was no significant difference in %bronchiectasis between TLC PC‐CT compared with FRC PC‐CT (median [range] 0.52 [0.12‐8.09] and 0.54 [0.12‐2.28], P = .075). %Disease was higher on TLC PC‐CT compared with FRC PC‐CT (median [range] 4.51 [1.39‐12.62] and 2.49 [0.41‐10.47], respectively, P < .001).
Figure 1.
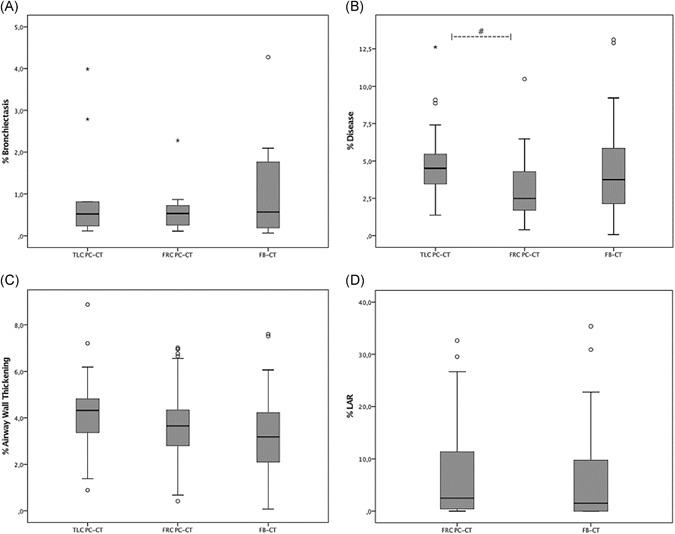
Boxplots of %bronchiectasis (A), %disease (B), %airway wall thickening (C), and %LAR (D) scored on inspiratory pressure‐controlled CTs (TLC PC‐CTs), expiratory pressure‐controlled CTs (FRC PC‐CTs), and free‐breathing CTs (FRC FB‐CTs), The boxes display the interquartile range of each PRAGMA‐CF outcome and contain 50% of the cases. The black line in the middle of the boxes represents the median score and whiskers go out to the smallest and largest scores. “o” indicates outliers (scores that are quite different from the remainder of the scores) and “*” indicates extreme outliers. Six extreme outliers of %LAR and one extreme outlier of %bronchiectasis could not be displayed in the figures. “#” indicates a significantly higher score of %disease for TLC PC‐CT compared with FRC PC‐CT. CT, computed tomography; FRC, functional residual capacity; LAR, low attenuation region; PRAGMA‐CF, Perth‐Rotterdam annotated grid morphometric analysis for cystic fibrosis; TLC, total lung capacity
Correlations comparisons of PRAGMA‐CF scores between TLC PC‐CT, FRC PC‐CT, and FRC FB‐CT are shown in Table 2.
Table 2.
PRAGMA‐CF outcomes %bronchiectasis, %disease, %airway wall thickening, %mucous plugging, and %LAR scored on TLC PC‐CTs, FRC PC‐CTs, and FRC FB‐CTs
| PRAGMA‐CF scores | TLC PC‐CT | FRC PC‐CT | FRC FB‐CT | P value* | P value** | P value*** |
|---|---|---|---|---|---|---|
| %Bronchiectasis | 0.52 (0.12‐8.09) | 0.54 (0.12‐2.28) | 0.57 (0.07‐4.27) | .075 | .849 | .797 |
| %Disease | 4.51 (1.39‐12.62) | 2.49 (0.41‐10.47) | 3.75 (0.08‐13.11) | <.001 | .143 | .055 |
| %Airway wall thickening | 4.32 (0.89‐8.87) | 3.18 (0.08‐7.60) | 3.65 (0.42‐7.01) | .026 | .003 | .188 |
| %Mucous plugging | 0.00 (0.00‐1.33) | 0.00 (0.00‐2.10) | 0.00 (0.00‐7.94) | .047 | .002 | .018 |
| %Atelectasis | 0.29 (0.00‐6.57) | 0.00 (0.00‐6.74) | 0.00 (0.00‐2.88) | .074 | .001 | .149 |
| %LAR | 2.48 (0.00‐51.52) | 1.53 (0.00‐35.36) | .143 |
Note: Significance (P values) of comparison of PRAGMA‐CF scores between FRC FB‐CTs vs TLC PC‐CTs and FRC FB‐CTs vs FRC PC‐CT are also displayed. Data are presented as median (range) unless otherwise specified.
Abbreviations: FRC FB‐CT, functional residual capacity free‐breathing computed tomography; FRC PC‐CT, functional residual capacity expiratory pressure‐controlled computed tomography; LAR, low attenuation region; PRAGMA‐CF, Perth‐Rotterdam annotated grid morphometric analysis for cystic fibrosis; TLC PC‐CT, total lung capacity inspiratory pressure‐controlled computed tomography.
Comparison of PRAGMA‐CF scores between TLC PC‐CT and FRC PC‐CT.
Comparison of PRAGMA‐CF scores between TLC PC‐CT and FRC FB‐CT.
Comparison of PRAGMA‐CF scores between FRC PC‐CT and FRC FB‐CT.
3.3. Intraobserver reliability
The ICC (95% CI) for %bronchiectasis, %disease, and %LAR were 0.83 (0.75‐0.89), 0.86 (0.79‐0.91), and 0.99 (0.98‐1.00), respectively.
3.3.1. %Bronchiectasis and %disease vs age
To evaluate the sensitivity of PC‐CT and FB‐CT groups to detect structural lung abnormalities, we investigated the associations between the logarithmic scale of %bronchiectasis and age and between %disease and age for both cohorts (Figure 2). The logarithmic scale of %bronchiectasis did not show a significant increase with age in patients with TLC PC‐CTs (β = .091, SE = 0.192, P = .758), FRC PC‐CTs (β = .279, SE = 0.163, P = .468), and FRC FB‐CTs (β = .410, SE = 0.126, P = .091). %Disease increased significantly with age for FRC PC‐CTs (β = .353, SE = 0.313, P = .012) and FRC FB‐CTs (β = .362, SE = 0.438, P = .018) (Figure 2). When excluding the second FRC FB‐CT of the five patients with follow‐up CTs, the increase of the logarithmic scale of %bronchiectasis with age remains insignificant (β = .330, SE = 0.152, P = .229), while %disease continued to show a trend towards progression (β = .300, SE = 0.470, P = .071).
Figure 2.
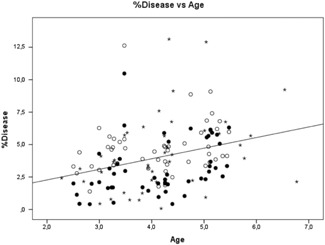
PRAGMA‐CF outcome %disease plotted against age of all patients for inspiratory pressure‐controlled CTs (TLC PC‐CTs, open circles), expiratory pressure‐controlled CTs (FRC PC‐CTs, closed circles), and free‐breathing CTs (FRC FB‐CTs, stars), The line shows the correlation between %disease and age for all patient groups. The regression equation is as follows: %Disease = 0.64 + 0.82 Age. A common slope is shown as there was no difference in slope between FB‐CT vs age and PC‐CT vs age. CT, computed tomography; FRC, functional residual capacity; PRAGMA‐CF, Perth‐Rotterdam annotated grid morphometric analysis for cystic fibrosis; TLC, total lung capacity
4. DISCUSSION
This is the first study in young children investigating PRAGMA‐CF scores of airways disease on CTs acquired using a pressure‐controlled protocol and on CTs acquired using a free‐breathing CT‐protocol in two cohorts. Our cross‐sectional analysis showed that airways disease can be detected with both CT‐protocols using PRAGMA‐CF scoring.
An important observation is that there is no significant difference in the detection of %bronchiectasis on TLC PC‐CTs compared to FRC PC‐CTs or to FRC FB‐CTs. This is in line with a previous study in older children with CF, which shows that CF‐CT scores of end‐expiratory CTs and end‐inspiratory CTs match well. 20 However, a study by Mott et al 21 in 10 young CF patients below the age of 5 years showed a significant lower number of bronchiectatic airways at FRC level measuring airway artery dimensions on sequential axial CT‐slices. Like in other studies, we observed a prevalence of bronchiectasis between 18% and 43%. However, the extend of bronchiectasis in CF at this young age was low for both CT‐protocols. This discrepancy between the findings of the study by Mott et al 21 and our current study is likely to be the result of the use of a more sensitive volumetric CT protocol for our image analysis.
In contrast to bronchiectasis, %disease was significantly higher on TLC PC‐CTs compared with FRC PC‐CTs. This can be explained by the fact that on TLC PC‐CTs airways are larger relative to the FRC PC‐CTs, allowing the evaluation of almost double the amount of airways, including diseased airways. 15 , 24 Another explanation is that for TLC PC‐CTs about double the radiation dose was used compared with an FRC PC‐CTs as the latter is only used routinely for the detection of LAR. 25 In general, a lower radiation dose results in lower image quality and therefore reduced sensitivity to detect airways. 24 Similarly, the radiation dose for FRC FB‐CTs is higher compared with FRC PC‐CTs as FRC FB‐CTs are used both to assess airway disease as well as LAR. This is in line with the observation that %disease on FRC FB‐CTs was between that of the TLC PC‐CTs and FRC PC‐CTs. Similarly, %airway wall thickening on FRC FB‐CTs was between that of TLC PC‐CTs and FRC PC‐CTs. However, we must be cautious in making comparisons with the two cohorts. Interestingly, %mucous plugging on FRC PC‐CTs was observed in a significantly higher percentage than on TLC PC‐CTs. This can be explained by the increased visibility of occluded airways at the FRC level due to the combination of folding of the thickened mucosa and mucus in the airway, filling up the space between the mucosal folds and/or lumen. 26 , 27 These observations support the use of %disease on FRC FB‐CTs as an alternative for %disease on TLC PC‐CTs and FRC PC‐CTs when using a similar radiation dose for FRC FB‐CTs as used for TLC PC‐CTs. 25
For %LAR there were no significant differences between FRC FB‐CTs and FRC PC‐CTs. Some more variability in lung volume could be expected in FRC FB‐CTS compared with the PC‐CTs which could have reduced the sensitivity to detect LAR on FRC FB‐CTs. 19 However, the higher radiation dose of FRC FB‐CTs compared with FRC PC‐CTs is likely to improve the sensitivity of FRC FB‐CTs to detect LAR.
As expected atelectasis was observed in around half of the patients with PC‐CTs. 18 Interestingly, atelectasis was also observed on FRC FB‐CTs in around one‐third of the patients, showing that children with CF are prone to develop atelectasis even without general anesthesia. This is likely to be related to CF lung disease in combination with the supine position during the execution of the CT‐scan. To our knowledge, the prevalence of atelectasis on FRC FB‐CTs in young children with CF has not been described before in the literature. This observation supports the clinical relevance of including quantification of atelectasis using the PRAGMA‐CF score on CTs as a marker of CF lung disease.
In our cross‐sectional study, %disease increased significantly with age for both patient groups. This supports that progression of CF lung disease between the ages of 2 and 6 could possibly be monitored using %disease for the TLC PC‐CT as well as for the FRC FB‐CT protocol. %Bronchiectasis did not show a significant increase with age for the two groups, which can be explained by the low extend of true bronchiectasis in the lungs of young children with CF. Clearly, longitudinal studies with pre‐school aged patients providing multiple CTs over time are needed to compare the sensitivity of FB‐CT and PC‐CT to monitor the progression of CF lung disease using the PRAGMA‐CF scoring method.
Both the PC‐CT and FB‐CT protocol have advantages and disadvantages for monitoring CF lung disease (Table S3). The most important disadvantage of PC‐CT over FB‐CT is that it requires general anesthesia. However, it must be noted that in multiple CF centers the PC‐CT under general anesthesia is combined with a diagnostic bronchoscopy. 28 Another disadvantage of PC‐CT is that there is a higher risk for the development of atelectasis especially in those patients with more severe lung disease. The observed atelectasis related to the PC‐CT underlines the importance of using a recruitment protocol at the end of the anesthesia procedure to reverse procedure‐related atelectasis. 18 In addition, postanesthesia recruitment exercises under the supervision of a physiotherapist can be considered to further reduce this risk. Another disadvantage of PC‐CT is that the total radiation dose needed is somewhat higher relative to FB‐CT, as the latter requires only a single low dose volumetric scan at FRC level in contrast to PC‐CT, which includes a low‐dose volumetric scan at TLC and an ultra‐low dose at FRC. However, it should be noted that the total radiation dose needed for both protocols is low and the risks related to the protocols are considered low. 29 A clear advantage of PC‐CT over FB‐CT is better standardization of lung volume for especially the inspiratory PC‐CT at the TLC level. Previous studies have established the importance of standardization of volume levels during chest CT. 12 , 13 , 14 , 21 It has been shown that the airway to artery ratio to diagnose bronchiectasis is dependent on lung volume. 30 However, bronchiectatic and thickened airways can also be diagnosed at the FRC level. 20 The expiratory scan for the PC‐CT protocol will be at the FRC level when sufficient time is taking to let the lung deflate. The FB‐CT will be at the FRC level plus minus the tidal volume. However, when a child is upset the volume level can be more variable. Finally, FB‐CTs have a higher risk of motion artifacts compared with PC‐CTs due to the child's tidal breathing. However, in our series, all FB‐CTs were of good quality without major movement artifacts. This risk for movement artifacts can be reduced by training cooperative children before the scan in a mock scanner and by using modern fast CT‐scanners and a high‐pitch spiral CT‐protocol. 19
There are some important limitations to this study. The most important one is that the FB‐CTs and PC‐CTs were executed in two different patient cohorts. The ideal protocol would be to do a FB‐CT and PC‐CT protocol within a short time frame in the same patient. Unfortunately, such a study has ethical limitations, as it would expose the patients to a higher dose of radiation. An alternative is alternating within the same cohort biennial PC‐CT with biennial FB‐CT but such a study takes 5 to 6 years to complete. However, the two cohorts of these young CF children from Rotterdam and Perth are similar in their key characteristics, such as age, gender, CF genotype, pancreatic insufficiency, and Pseudomonas status. Furthermore, both centers have been collaborating closely together since 2004 and Rotterdam has a structural follow‐up protocol similar to the AREST‐CF protocol for 6 years with the exception of the CT‐protocol. Clearly, it is well possible that demographical differences or differences in clinical management could have created a systemic bias between both cohorts. In addition, different CT‐scanners and CT‐scan protocols were used from two different centers. However, it is well recognized that scoring techniques are less sensitive to differences in CT‐protocols.
Another important limitation is that only a relative small sample size was studied, which reduced the sensitivity to find differences. This might have especially affected the comparison for bronchiectasis which has a relatively low prevalence and extend in these young patients with CF having early lung disease. However, %disease and low attenuation regions could be easily and reliably scored for both CT protocols. Given the above considerations, no strong conclusions can be made and this manuscript serves as a descriptive analysis. Future research, that could benefit from these descriptive results, should be performed for a more reliable comparison.
This cross‐sectional study suggests that FRC PC‐CTs have comparable sensitivity to TLC PC‐CT in terms of detecting airways disease in young children with CF. Furthermore, FRC FB‐CTs can be used to detect CF lung disease.
Our data suggest that the free‐breathing method is a general anesthesia‐free alternative to track CF lung disease for the pressure‐controlled method when a fast multislice CT‐scanner is available. Overall, PC‐CT is the preferred technique when it is combined with a diagnostic bronchoscopy or when standardized sensitive airway to artery measurements are needed. When this is not the case FB‐CT is the preferred technique as it reduces the burden for the patient and costs. Currently, running clinical trials in larger study populations that include both FRC FB‐CTs and PC‐CTs will generate more robust data on the sensitivity of both techniques for monitoring progression in CF lung disease.
CONFLICT OF INTERESTS
Authors Merel CJ Oudraad, Wieying Kuo, Elrozy Andrinopoulou, and Stephen M Stick declare that there are no conflict of interests. Tim Rosenow has a patent PCT/AU2016/000079 pending. Dr. Tiddens reports other from Roche, other from Novartis, grants from CFF, grants from Vertex, grants from Gilead, grants from Chiesi, outside the submitted work; in addition, Dr. Tiddens has a patent Vectura licensed, and a patent PRAGMA‐CF scoring system issued and I am heading the Erasmus MC‐Sophia Children's Hospital core laboratory Lung Analysis.
Supporting information
Supporting information
Supporting information
Supporting information
ACKNOWLEDGMENTS
The authors would like to thank Marcel Koek from the Erasmus MC for the development of the grid software used for PRAGMA‐CF.
Oudraad MCJ, Kuo W, Rosenow T, Andrinopoulou E‐R, Stick SM, Tiddens HAWM. Assessment of early lung disease in young children with CF: A comparison between pressure‐controlled and free‐breathing chest computed tomography. Pediatric Pulmonology. 2020;55:1161–1168. 10.1002/ppul.24702
REFERENCES
- 1. Mott LS, Park J, Gangell CL, et al. Distribution of early structural lung changes due to cystic fibrosis detected with chest computed tomography. J Paediatr. 2013;163(1):243‐248. [DOI] [PubMed] [Google Scholar]
- 2. Mott LS, Park J, Murray CP, et al. Progression of early structural lung disease in young children with cystic fibrosis assessed using CT. Thorax. 2012;67(6):509‐516. [DOI] [PubMed] [Google Scholar]
- 3. Jacobsen LE, Houston CS, Habbick BF, Genereux GP, Howie JL. Cystic fibrosis: a comparison of computed tomography and plain chest radiographs. Can Assoc Radiol J. 1986;37:17‐21. [PubMed] [Google Scholar]
- 4. De Jong PA, Nakano Y, Lequin MH, et al. Progressive damage on high resolution computed tomography despite stable lung function in cystic fibrosis. Eur Respir J. 2004;23:93‐97. [DOI] [PubMed] [Google Scholar]
- 5. De Jong PA, Lindblad A, Rubin L, et al. Progression of lung disease on computed tomography and pulmonary function tests in children and adults with cystic fibrosis. Thorax. 2006;61:80‐85. [DOI] [PMC free article] [PubMed] [Google Scholar]
- 6. Tiddens HA, de Jong PA. Imaging and clinical trials in cystic fibrosis. Proc Am Thorac Soc. 2007;4(4):343‐346. [DOI] [PubMed] [Google Scholar]
- 7. Tiddens HA, de Jong P. Update on the application of chest computed tomography scanning to cystic fibrosis. Curr Opin Pulm Med. 2006;12:433‐439. [DOI] [PubMed] [Google Scholar]
- 8. Brody AS, Sucharew H, Campbell JD, et al. Computed tomography correlates with pulmonary exacerbations in children with cystic fibrosis. Am J Respir Crit Care Med. 2005;1(172):1128‐1132. [DOI] [PubMed] [Google Scholar]
- 9. De Jong PA, Ottink MD, Robben SGF, et al. Pulmonary disease assessment in cystic fibrosis: comparison of CT scoring systems and value of bronchial and arterial dimension measurements. Radiology. 2004;231:434‐439. [DOI] [PubMed] [Google Scholar]
- 10. Rosenow T, Ramsey K, Turkovic L, et al. Air trapping in early cystic fibrosis lung disease‐Does CT tell the full story? Pediatr Pulmonol. 2017;52:1150‐1156. [DOI] [PubMed] [Google Scholar]
- 11. Arakawa H, Webb WR. Air trapping on expiratory high‐resolution CT scans in the absence of inspiratory scan abnormalities: correlation with pulmonary function tests and differential diagnosis. Am J Roentgenol. 1998;170:1349‐1353. [DOI] [PubMed] [Google Scholar]
- 12. Kauczor HU, Heussel CP, Fischer B, Klamm R, Mildenberger P, Thelen M. Assesment of lung volumes using helical CT at inspiration and expiration: comparison with pulmonary function tests. Am J Roentgenol. 1998;171:1091‐1095. [DOI] [PubMed] [Google Scholar]
- 13. Bakker ME, Stolk J, Reiber JHC, Stoel BC. Influence of inspiration level on bronchial lumen measurements with computed tomography. Respir Med. 2012;106(5):677‐686. [DOI] [PubMed] [Google Scholar]
- 14. Kongstad T, Buchvald FF, Green K, Lindblad A, Robinson TE, Nielsen KG. Improved air trapping evaluation in chest computed tomography in children with cystic fibrosis using real‐time spirometric monitoring and biofeedback. J Cyst Fibros. 2013;12(6):559‐566. [DOI] [PubMed] [Google Scholar]
- 15. Kuo W, de Bruijne M, Petersen J, et al. Diagnosis of bronchiectasis and airway wall thickening in children with cystic fibrosis: objective airway‐artery quantification. Eur Radiol. 2017;27(11):4680‐4689. [DOI] [PMC free article] [PubMed] [Google Scholar]
- 16. Salamon E, Lever S, Kuo W, Ciet P, Tiddens HAWM. Spirometer guided chest imaging in children: it is worth the effort! Pediatr Pulmonol. 2016;52(1):48‐56. [DOI] [PubMed] [Google Scholar]
- 17. Long FR, Castile RG. Technique and clinical applications of full‐inflation and end‐exhalation controlled‐ventilation chest CT in infants and young children. Pediatr Radiol. 2001;31(6):413‐422. [DOI] [PubMed] [Google Scholar]
- 18. Newman B, Krane EJ, Gawande R, Holmes TH, Robinson TE. Chest CT in children: anesthesia and atelectasis. Pediatr Radiol. 2014;44(2):164‐172. [DOI] [PubMed] [Google Scholar]
- 19. Lell MM, May M, Deak P, et al. High‐pitch spiral computed tomography. Invest Radiol. 2011;46:116‐123. [DOI] [PubMed] [Google Scholar]
- 20. Loeve M, Lequin MH, de Bruijne M, et al. Cystic fibrosis: are volumetric ultra‐low‐dose expiratory CT scans sufficient for monitoring related lung disease? Radiology. 2009;253(1):223‐229. [DOI] [PubMed] [Google Scholar]
- 21. Mott LS, Graniel KG, Park J, et al. Assessment of early bronchiectasis in young children with cystic fibrosis is dependent on lung volume. Chest. 2013;144(4):1193‐1198. [DOI] [PubMed] [Google Scholar]
- 22. Stick SM, Brennan S, Murray C, et al. Australian respiratory early surveillance team for cystic fibrosis (AREST CF). Bronchiectasis in infants and preschool children diagnosed with cystic fibrosis after newborn screening. J Pediatr. 2009;155:623‐628. [DOI] [PubMed] [Google Scholar]
- 23. Rosenow T, Oudraad MCJ, Murray CP, et al. PRAGMA‐CF: a quantitative structural lung disease CT outcome in young children with cystic fibrosis. Am J Respir Crit Care Med. 2015;191(10):1158‐1165. [DOI] [PubMed] [Google Scholar]
- 24. Kuo W, Andrinopoulou ER, Perez‐Rovira A, Ozturk H, De Bruijne M, Tiddens HAWM. Objective airway artery dimensions compared to CT scoring methods assessing structural cystic fibrosis lung disease. J Cyst Fibros. 2017;16(1):116‐123. [DOI] [PubMed] [Google Scholar]
- 25. Kuo W, Kemner‐van de Corput MPC, Perez‐Rovira A, et al. Multicentre chest computed tomography standardization in children and adolescents with cystic fibrosis: the way forward. Eur Respir J. 2016;47:1706‐1717. [DOI] [PubMed] [Google Scholar]
- 26. Lambert RK, Codd SL, Pack RJ, Alley MR. Mucosal folding in sheep bronchi is related to submucosal thickening and to airway narrowing. Eur Respir J. 1992;5(15):255s. [Google Scholar]
- 27. Lambert RK, Codd SL, Alley MR, Pack RJ. Physical determinants of bronchial mucosal folding. J Appl Physiol. 1994;77(3):1206‐1216. [DOI] [PubMed] [Google Scholar]
- 28. Stick SM, Brennan S, Murray C, et al. Bronchiectasis in infants and preschool children diagnosed with cystic fibrosis after newborn screening. J Pediatr. 2009;155(5):623‐628. [DOI] [PubMed] [Google Scholar]
- 29. Kuo W, Ciet P, Tiddens HAWM, Zhang W, Guillerman RP, Van Straten M. Monitoring cystic fibrosis lung disease by computed tomography. Radiation risk in perspective. Am J Respir Crit Care Med. 2014;189(11):1328‐1336. [DOI] [PubMed] [Google Scholar]
- 30. Kuo W, Soffers T, Andrinopoulou ER, et al. Quantitative assessment of airway dimensions in young children with cystic fibrosis lung disease using chest computed tomography. Pediatr Pulmonol. 2017;52(11):1414‐1423. [DOI] [PubMed] [Google Scholar]
Associated Data
This section collects any data citations, data availability statements, or supplementary materials included in this article.
Supplementary Materials
Supporting information
Supporting information
Supporting information