

Abstract
Background and Aims
Chronic hepatitis B (CHB) is a significant global health concern, and the most prevalent blood‐borne virus in Australia. World Health Organization (WHO) member states have committed to global elimination, with targets to diagnose 90% of people living with CHB, treat 80% of those eligible, and reduce attributable deaths by 65% by the year 2030. Australia has committed to national targets of 80% diagnosed, 20% on treatment, and a 30% reduction in deaths by 2022.
Approach and Results
We constructed and implemented a mathematical model to estimate the burden of CHB incorporating vaccination, phases of infection, cirrhosis progression, and mortality attributed to decompensated cirrhosis and hepatocellular carcinoma and examined the population‐level impact of antiviral therapy. Diversity was integrated according to migration patterns, CHB prevalence by country of birth, Indigenous status, and age. Modelled outcomes were subjected to multivariate uncertainty analysis. Of the estimated 221,420 people living with CHB in Australia in 2017, 68% were diagnosed and 8.7% were receiving treatment (less than one‐third of those estimated to be eligible). Based on current trends, the proportion of people living with CHB who have been diagnosed will reach 71% by 2022 and 81% by 2030, and treatment uptake will rise to 11.2% by 2022 and 12.9% by 2030, resulting in a 5.7% reduction in CHB‐attributable deaths from 2015 to 2030. CHB treatment has prevented approximately 2,300 deaths in Australia between 2000 and 2017.
Conclusions
Australia is not on track to meet local and global targets regarding CHB. Comprehensive and regularly updated modelling approaches accounting for diversity within the population are a useful tool to measure progress and impact of interventions, and quantify further improvements required to meet elimination goals.
Abbreviations
- ABS
Australian Bureau of Statistics
- CHB
chronic hepatitis B
- COB
country of birth
- DC
decompensated cirrhosis
- GHSS
Global Health Sector Strategy
- HCC
hepatocellular carcinoma
- LHS
Latin‐hypercube sampling
- MBS
Medicare Benefit Scheme
- National 2022 targets
Australia's 3rd National Hepatitis B Strategy targets 2018‐2022
- NNDSS
National Notifiable Diseases Surveillance
- NOM
net overseas migration
- PBS
Pharmaceutical Benefits Scheme
- PR
plausible range
- WHO
World Health Organization
- WHO 2030 targets
Global Health Sector Strategy targets for 2030
In Australia, approximately 1% of the population are living with chronic hepatitis B (CHB),1 with people born overseas and Aboriginal and Torres Strait Islander peoples representing three‐quarters of those affected.2 Through ongoing migration from endemic populations, the number of Australians living with CHB has continued to increase,3 with CHB now more prevalent in Australia than human immunodeficiency virus (HIV) and chronic hepatitis C combined. Universal infant hepatitis B vaccination programs in Australia and overseas are reducing transmission, especially to infants,4, 5 and although this is not yet significantly impacting on the prevalence of CHB among adult migrants, the prevalence of CHB in this group is expected to fall significantly in coming years.
Deaths attributable to liver cancer (predominantly hepatocellular carcinoma [HCC]) have been increasing faster than deaths caused by any other cancer in Australia, with liver cancer now the sixth most common cause of cancer death.6 Globally, liver cancer is the second leading cause of cancer deaths, with one in every ten cancer deaths globally being caused by liver cancer.7 The majority of these cancers are caused by chronic viral hepatitis infection.8 When considering other attributable causes of death, it has been estimated that viral hepatitis is the seventh leading cause of human deaths globally.9 Where indicated, antiviral treatment for CHB is associated with a substantial reduction in mortality from cirrhosis and HCC—with comparative studies showing a reduction in HCC risk of 50% overall within a few years of treatment and 80% reduction in those without cirrhosis.10 Without a drastic scale‐up in treatment for CHB, however, attributable mortality will continue to rise.11
In response to increasing international recognition of the imperative to address viral hepatitis, in 2016 the World Health Organization (WHO) released the Global Health Sector Strategy on Viral Hepatitis 2016‐2021 (GHSS).11 The GHSS includes specific prevention, diagnosis, and treatment targets (hereafter referred to as the WHO 2030 targets)—90% coverage of infant hepatitis B vaccination together with other prevention methods, 90% of people living with viral hepatitis diagnosed, and 80% of those eligible for treatment receiving it—with the goal of achieving a 90% reduction in incident infections and a 65% reduction in attributable mortality by 2030. These reductions in incidence and mortality are defined in the GHSS as representing elimination of viral hepatitis as a public health concern.11 The first Global Hepatitis Report assessing progress toward the WHO 2030 targets12 emphasized the very substantial gaps in all populations regarding strategic information and surveillance data, plus all elements in the cascade of care through diagnosis, monitoring, and treatment.
In Australia, the 3rd National Hepatitis B Strategy 2018‐202213 aims, by 2022, to achieve and maintain 95% infant hepatitis B vaccination coverage; increase the proportion of people living with CHB who have been diagnosed to 80%; increase the proportion in care to 50%; increase the proportion of people receiving antiviral treatment to 20%; and reduce CHB attributable mortality by 30% (hereafter referred to as the National 2022 targets).
Australia has developed successive National Hepatitis B Strategies since 2010 intended to guide cross‐sectoral responses to CHB, with significant progress being achieved over this period. Through the national health care system, Australians have universal access to monitoring and treatment through the Medicare Benefits Scheme (MBS) and Pharmaceutical Benefits Scheme (PBS), with hepatitis B antivirals subsidized through this system since the late 1990s. However, Australia is still struggling to reach the majority of those affected and engage them in appropriate care and monitoring.
The epidemiology of CHB in countries like Australia is complex, with a low background CHB prevalence in most communities, but higher prevalence among Aboriginal and Torres Strait Islander people, and from the second half of the 20th century to the present time, high net inward migration from countries with intermediate and high CHB prevalence. Accurate estimation of the disease burden requires consideration of the multiple modes of transmission of hepatitis B and consequent diverse risk populations, the impact of age of infection on progression to chronic infection, differing prevalence by country of birth (COB), and the impact of multiple possible interventions, including vaccination and antiviral treatment.
Mathematical modeling is a valuable tool to use available data to simulate complex systems and population‐wide health impacts of communicable and noncommunicable diseases. It can inform health policy in a range of ways, including establishing an evidence base for strategic service delivery targets to achieve desired population health impacts, and for tracking progress toward these targets at the subnational, national, and global level. Mathematical models can also explore the impact of uncertainty in data inputs, helping to direct research efforts toward obtaining stronger data to inform these influential parameters.
This article presents a mathematical model simulating CHB in the Australian population for the period 1970‐2030, accounting for diversity in prevalence and impact of overseas migration, incorporating detailed disease phase dynamics, and examining the impact of domestic and overseas vaccination programs, together with the impact of antiviral treatment on mortality attributable to CHB at a population level.
Materials and Methods
Model Overview
We constructed a deterministic, age‐structured, mathematical model for the natural history of hepatitis B in Australia building on previous work.14, 15 In the model, the Australian population is divided up into hepatitis B–related health states, including susceptible, immunized, acute hepatitis B infection, various phases of CHB infection, and resolved infection (Fig. 1). Modeled chronic infection states are immune tolerance, immune clearance (+/‐ cirrhosis), immune control (+/‐ cirrhosis), immune escape (+/‐ cirrhosis), decompensated cirrhosis (DC), and HCC. All states where antiviral treatment may be indicated are stratified into those receiving treatment and those not on treatment (Fig. 1). The modeled population is dynamic, increasing because of births and immigration, and decreasing because of deaths (hepatitis B–related and all‐cause) and emigration.
Figure 1.
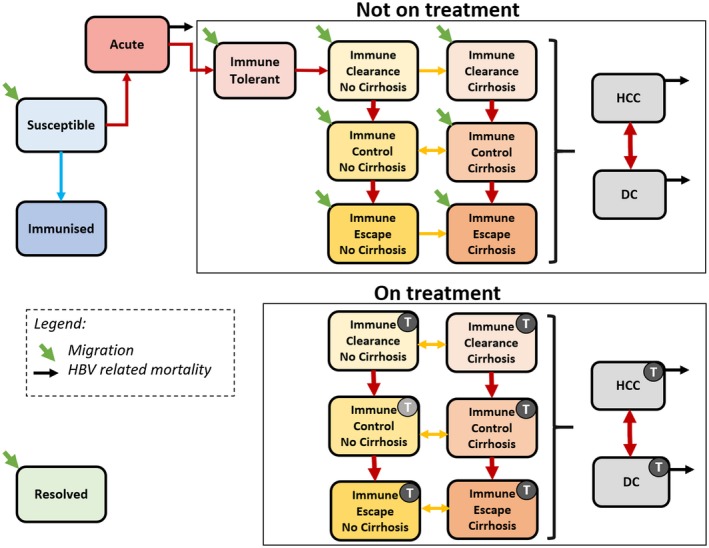
Schematic diagram of the mathematical model describing the progression of hepatitis B infection and indicating key transitions. CHB phases are within the boxes. Phases with a “T” indicate individuals in that phase receiving treatment. Light gray treatment icon indicates those who have transitioned into this phase while on treatment. Colored arrows represent transitions between states. Each health state is stratified by age. Resolution of infection is possible from acute infection and from CHB phases and results in the transition into the resolved state. Abbreviation: HBV, hepatitis B virus.
Individuals within the susceptible state can transition into the immunized state upon vaccination, or into acute hepatitis B if they acquire infection, either through vertical transmission during childbirth or infection later in life. Individuals with acute infection that progress to chronicity transition into the first phase of CHB infection (immune tolerance), from which they can progress into subsequent states. Possible routes of progression through phases of CHB are illustrated in Fig. 1. Individuals migrating to Australia already living with CHB may enter into any one of the untreated CHB states (indicated by the green diagonal arrows in Fig. 1). In the model, the risk of developing DC or HCC relates to age, phase of CHB, and treatment status. Hepatitis B attributable mortality occurs through acute infection, or through the DC or HCC health states.
Current guidelines recommend antiviral therapy initiation only for those in an immune active phase of CHB (immune clearance and immune escape) or those living with cirrhosis with detectable hepatitis B replication irrespective of phase (Fig. 1).10 In the model, treatment uptake therefore varies according to phase of CHB and age. For those eligible, treatment reduces the risk of progression to cirrhosis and/or HCC, which leads to differential transition rates between phases of CHB for those on treatment compared to those who are not receiving treatment. People living with CHB who develop cirrhosis have a higher risk of developing advanced liver disease, including DC and HCC, reflected in model transition rates.
Model Inputs
Population Demographics
The Australian Bureau of Statistics (ABS) provided the majority of the demographic data used in the model. This included total population numbers,16, 17 births,16 deaths and life tables used to derive age‐group mortality rates,16, 18, 19, 20 and migration.21, 22, 23 In the model, the population is stratified into 18 age groups (5‐year categories for those aged 0‐84 and an 85+ age group), which allowed for incorporation of the differential risks in hepatitis B acquisition and disease progression by age.
Disease Transitions
Disease progression and transitions between each health state, including the impact of any antiviral treatment (including pegylated interferon and nucleoside/nucleotide analogues) on these, were generated based predominantly on a review of published and gray literature. The impact of treatment for HCC transitions was modeled separately and includes potentially curative interventions, including liver transplantation. Refer to Supporting Information Table S1 for further details.
Migration
In addition to Australian demographic data, incoming migration by age and COB were incorporated. Data regarding net overseas migration (NOM) produced by the ABS provided the total number of people entering the population from 1951 to 2017 as well as projections of future NOM from 2018 to 2050. Age and country of birth distributions within were calculated using different sources dependent on time period and data availability. Further details are provided in the Supporting Information.
Prevalence
Baseline prevalence in the model incorporates the population of Australia in 1951, preceding the onset of substantial migration from intermediate and high CHB populations. Whereas baseline prevalence includes both Aboriginal and Torres Strait Islander Australians (who have a significantly higher prevalence of CHB24) and non‐Indigenous Australians, specific modeling of CHB in Indigenous Australians was not included. The number of people living with CHB migrating to Australia each year was derived using the estimated prevalence of CHB according to COB. To account for changing source population prevalence over time and by age group attributed predominately to universal infant vaccination programs, we derived varying prevalence estimates across different time periods and applied these to migration data according to age group and year of arrival for COB for the majority of migrants to Australia.
Prevalence for China, Vietnam, Philippines, and Taiwan—together estimated to represent over 45% of migrants living with CHB in Australia in 20163—was estimated separately with more specific regional data. Further details are provided in the Supporting Information.
Disease Phase Distribution
The proportion of individuals living with CHB in each disease phase (immune tolerant, immune clearance, immune control, and immune escape) by age group were derived according to region of birth using published data and expert opinion.25, 26, 27 All source countries were categorized into three world regions (Asia/Pacific, Africa, and Other) to account for broad differences in natural history of CHB infection in different populations.28
Treatment
Treatment data used to parameterize the model were obtained from Australia's universal medication subsidy program, the PBS. Data represent the number of individuals dispensed adefovir, entecavir, lamivudine, pegylated interferon alfa‐2a, telbivudine, or tenofovir for the treatment of CHB between 2000 and 2017. These data exclude individuals prescribed lamivudine or tenofovir for HIV infection. Refer to the Supporting Information for details on fitting modeled treatment uptake to PBS data.
Model Outputs
The model simulates the number of people in each health state by age group over time during the period 1970‐2030. Key derived outputs include prevalence of CHB by age; the proportion of people living with CHB who are eligible to receive treatment; the proportion of people living with CHB who have cirrhosis; the number of deaths attributable to DC and HCC; the impact of current treatment on the burden of disease attributable to CHB; and the projected impact of future treatment scale‐up.
We also utilize model outputs combined with relevant data to estimate the proportion of people living with CHB who have been diagnosed and the proportion of people receiving treatment. The proportion diagnosed was derived using the modeled number of people who have ever lived with CHB, including those who subsequently died,1 as the denominator and the cumulative number of notifications of CHB from 1971 to 2017 as the numerator. Notifications represent a positive diagnosis of CHB and were obtained from the National Notifiable Diseases Surveillance System (NNDSS).29
The proportion of people receiving treatment through the PBS during the period 2000‐2017 was derived by dividing the total number of people receiving treatment through the PBS by the total number of people living with CHB.
Uncertainty and Sensitivity Analysis
Uncertainty analysis was undertaken by assigning probability distributions around key parameter estimates using Latin hypercube sampling (LHS).30 Sensitivity analysis was also performed on key modeled outputs to determine which input parameters had the most influence on the modeled outputs (refer to the Supporting Information for further details).
Future Projection Assumptions
To model the projected underlying Australian population during 2018‐2030, estimates of future births, deaths, and NOM derived by the ABS were used. The age and COB distribution of incoming migrants during 2018‐2030 was assumed to be the average of recent years (see the Supporting Information for further details).
Three separate scenarios with differing levels of future treatment uptake were modeled to assess the projected impact on the prevalence of cirrhosis and deaths attributable to DC and HCC (see Table 1 and the Supporting Information for details). The baseline treatment scenario assumes that the treatment uptake proportion for those in eligible phases remains constant at the level in 2017 for 2018‐2030. The intermediate and optimistic treatment scenarios assume that the rate of treatment uptake for those in eligible phases increases over time. The uptake rate for the intermediate scenario was chosen to meet the WHO 2030 treatment target, and the uptake rate in the optimistic scenario was chosen to meet the National 2022 and WHO 2030 treatment targets. In the following sections, when we refer to the average annual increase, it is important to note that this was derived from the modeled average proportion receiving treatment between 2018 and 2030 and therefore does not represent a linear increase.
Table 1.
Impact of Treatment Scale‐up on Projected Proportion of People Living With CHB Receiving Treatment and Impact on Mortality Attributable to CHB
| Treatment Scale‐up Scenario | 2022 | 2030 | ||||||
|---|---|---|---|---|---|---|---|---|
| Proportion Receiving Treatment | Reduction in HBV Mortality Since 2015 | Proportion Receiving Treatment | Reduction in HBV Mortality Since 2015 | |||||
| Estimate | Target | Estimate | Target | Estimate | Target | Estimate | Target | |
| Baseline | 11.2% | 20% | 14.8% | 30% | 12.9% | 25.9%* | 5.7% | 65% |
| Intermediate | 13.2% | 20% | 19.9% | 30% | 26.5% | 25.0%* | 40.0% | 65% |
| Optimistic | 20.9% | 20% | 38.3% | 30% | 32.3% | 24.3%* | 49.3% | 65% |
The WHO 2030 target is 80% of those eligible receiving treatment, which changes over time as the number or people eligible for treatment changes over time. Therefore, the target presented here is 80% of the modeled proportion who are eligible to receive treatment.
To model the proportion of people living with CHB diagnosed from 2018 to 2030, we assumed that the cumulative number of notifications would increase linearly in line with recent trends. The modeled output of the number of people who have ever lived with CHB between 2018 and 2030 derived under the baseline treatment scenario (Table 1) was used as the denominator for the projected proportion diagnosed.
Results
Prevalence
In 2017, an estimated 221,420 people (plausible range [PR], 186,912‐277,706) were living with CHB in Australia. This has increased over time, with an additional 75,556 people living with CHB in 2017 when compared to 2000. Following current trends, including migration, historical and current vaccination uptake both in Australia and overseas, and treatment uptake, an estimated 246,673 (PR, 215,160‐290,429) people will be living with CHB in Australia by 2030 (Fig. 2). Prevalence of CHB nearly doubled from 0.6% in 1970 to 0.9% in 2017, with substantial variation across age groups (Fig. 3).
Figure 2.
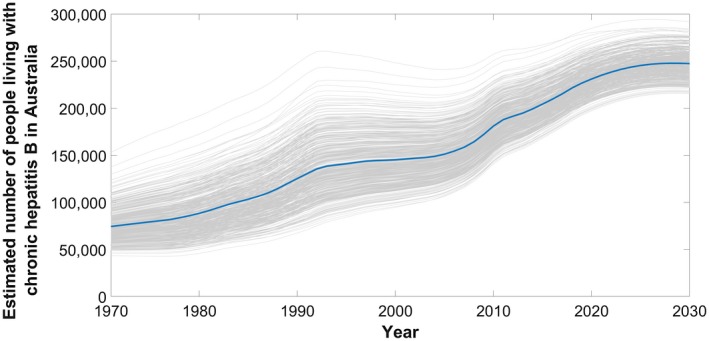
Estimated number of people living with CHB in Australia over time, 1970‐2030. Highlighted mean estimate (solid line) generated from 1,000 simulations (shown in gray) taking into account uncertainty in input parameters; refer to methodology and Supporting Information.
Figure 3.
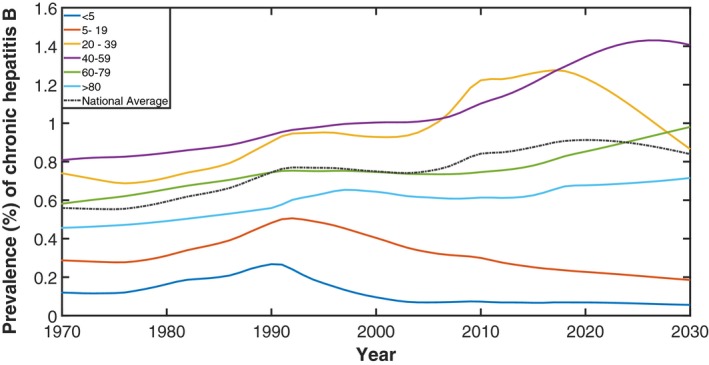
Estimated prevalence of CHB in Australia by age group, 1970‐2030. Dashed line represents prevalence in the whole population.
Diagnosis and Treatment
In 2017, an estimated 149,746 people living with CHB in Australia had been diagnosed, representing 68% (PR, 49%‐84%) of the total. Modeled trends show modest improvements in the proportion diagnosed, increasing from 63% in 2011 to 68% in 2017 (Fig. 4). If the current average annual increase of 0.78% since 2011 in proportion diagnosed were to continue, Australia will not reach the 80% target until 2033. To reach the National 2022 target of 80% diagnosed, the proportion would need to increase by 2.48% every year to reach 192,954 people diagnosed in 2022, representing an additional 43,208 people living with CHB being diagnosed. Furthermore, to reach the WHO 2030 target of 90% diagnosed, the proportion would need to increase by 1.72% every year to reach 222,006 people diagnosed in 2030, representing an additional 72,260 people living with CHB being diagnosed.
Figure 4.
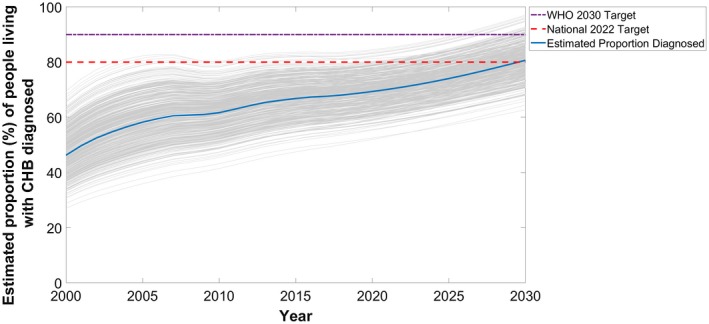
Estimated mean proportion of people living with CHB in Australia who have been diagnosed over time, 2000‐2030. Projections generated from 1,000 simulations (shown in gray) and assume cumulative number of notified cases of CHB continue to increase linearly and baseline treatment uptake scenario (see Table 1 and Supporting Information for details).
During 2017, 19,358 people were dispensed drugs for the treatment of hepatitis B through the PBS, which represents 8.7% (PR, 7.0%‐10.4%) of those estimated to be living with CHB. Modeled trends between 2011 and 2017 show an ongoing modest increase (average increase, 0.93% per year) in this proportion (Fig. 5). For Australia to meet the National 2022 targets of 20% of people living with CHB on treatment by 2022, an additional 28,880 people will need to be receiving antiviral treatment. This would require an average annual increase of 2.3%, which is 2.4 times the average annual increase of 0.93% per year since 2011. Under the baseline (representing current trends from 2017 onward), intermediate, and optimistic treatment scenarios, the modeled average annual increase in proportion receiving treatment between 2017 to 2030 was 0.33%, 1.4%, and 1.8%, respectively. Table 1 compares the estimated proportion receiving treatment in 2022 and 2030 for each scenario.
Figure 5.
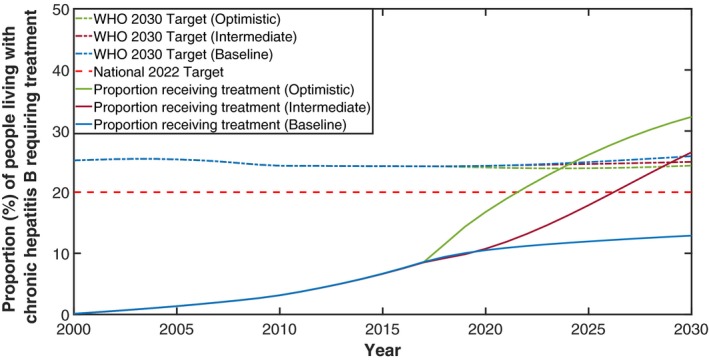
Estimated proportion of people living with CHB in Australia receiving treatment, 2000‐2030. Treatment scenario indicated in brackets; see Table 1 for details. WHO 2030 targets under each scenario represents 80% of those eligible for treatment over time. National 2022 Target is Australia's treatment target for 2022.
By modeling the transitions between phases of CHB, the model is used to estimate the proportion of people eligible for treatment for CHB (those in immune clearance, immune escape, and all people with cirrhosis)—see Fig. 1. The model estimates that 30.3% of all people living with CHB in Australia were eligible for antiviral treatment in 2017. The proportion eligible for treatment varies according to age with 17.1% of people aged <20 years, 20.3% aged 20‐40, and 39% aged >40 years eligible for treatment in 2017. The WHO treatment target for CHB is 80% of those eligible being on treatment by 2030. Under the baseline treatment scenario, by 2030 an estimated 32.4% of people will be eligible for antiviral treatment in Australia (higher than the current proportion attributable to aging in the population living with CHB over time). Therefore, by 2030, 63,858 Australians will need to be receiving antivirals for CHB to meet the WHO 2030 target, an additional 44,500 people compared to 2017.
Hepatitis B–Related Morbidity and Mortality
The number of people living with cirrhosis attributable to CHB has been increasing between 2000 and 2017 (Fig. 6). In 2017, an estimated 12,193 people aged >40 years were living with cirrhosis. In 2022, the number of people living with cirrhosis aged >40 years was approximately 13,126, 12,974, and 11,908 under the baseline, intermediate, and optimistic treatment scenarios, respectively. Furthermore, in 2030, these numbers were approximately 15,235, 12,956, and 11,624, respectively, highlighting the impact treatment scale‐up can have on morbidity in addition to mortality (Supporting Fig. S4 and Fig. 6).
Figure 6.
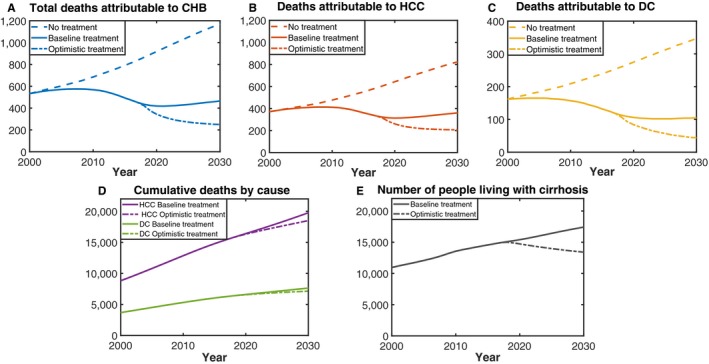
(A‐C) Deaths attributable to CHB under different treatment scenarios. (D) Cumulative deaths attributable to HCC and DC under baseline and optimistic treatment scenarios. (E) Number of people living with cirrhosis under baseline and optimistic scenarios.
In 2017, an estimated 452 (PR, 316‐713) people died because of CHB in Australia. The total number of estimated attributable deaths has changed over time, increasing from 407 in 1991 to a peak of 575 deaths in 2007 followed by a gradual decline (Fig. 6). Deaths attributed to CHB in the model are caused by the development of DC and/or HCC. In Australia, the majority of estimated deaths because of CHB were attributable to HCC, which were responsible for 333 (PR, 238‐520) deaths in 2017, whereas 119 (PR, 78‐193) people died because of DC. Deaths attributable to both causes have decreased over the last decade; however, the decline has been more pronounced for DC (28% reduction, from the peak of 165 in 2004; Fig. 6) than for HCC (19% reduction, from the peak of 413 in 2008). The model is parameterized using Australian cancer registry data regarding HCC deaths, ensuring the outputs reflect current clinical outcomes.
If treatment uptake continues to increase at the current rate, there will only be a 5.7% reduction in deaths in 2030 compared to 2015. Furthermore, under the intermediate and optimistic treatment scenarios, the WHO 2030 target of a 65% reduction in hepatitis B–related mortality is not met (Table 1). Figure 6 illustrates the impact on mortality attributable to CHB over time under different treatment scenarios considered. An additional 1,768 deaths will be prevented between 2017 and 2030 if Australia reaches the 2022 and 2030 targets under the optimistic treatment scenario compared to if continuing at the baseline treatment.
Discussion
This study presents a comprehensive model of CHB incorporating the complex natural history and epidemiology of hepatitis B in a country where migration is the key driver of new cases of CHB entering the population to generate estimates of burden of disease, the effect of treatment on adverse outcomes with projections toward the National 2022 and WHO 2030 targets. CHB is the most prevalent blood‐borne virus in Australia, and the number of people living with CHB will continue to rise through to 2030. Our modeling shows that Australia is not currently on track to meet the National 2022 targets (of 80% of people living with CHB diagnosed, 20% on treatment, and a 30% reduction in CHB‐related mortality by 2022) or the WHO 2030 targets (of 90% of people living with CHB diagnosed, and 80% of those eligible being on antiviral treatment).
To meet these targets, the number of people living with CHB diagnosed and the number receiving treatment will need to substantially increase. Increases of the required magnitude will require innovative disruptions of the current status quo to be realized. In 2015, the liberalization of antiviral prescribing to allow general practitioners in Australia to treat those affected, rather than restricting this to specialist physicians, improved the accessibility of treatment. However, in 2017, the majority (>85%) of CHB treatment is still provided by specialists, and access is demonstrably lower outside of major cities.2 These disparities must be addressed. Under the intermediate and optimistic treatment scale‐up scenarios considered, both reached the WHO 2030 target for treatment; however, only the optimistic scenario also reached the National 2022 treatment target. Only the optimistic scenario achieved the National 2022 target of a 30% reduction in mortality attributable to CHB. Despite the optimistic scenario reaching the WHO 2030 treatment target, the target of a 65% reduction in attributable mortality was not achieved.
This emphasizes the importance of having national strategy targets to strive for on the way to the global 2030 targets. Furthermore, it indicates the importance of ensuring that people affected are engaged in care and have access to relevant treatment earlier in order to achieve a higher reduction in attributable mortality by 2030. Although access to treatment remains well below local and global targets, current treatment uptake levels have been associated with a substantial reduction in deaths attributable to CHB since 2008. The decrease in estimated deaths over the last decade in particular is attributable to the introduction and scaling up of effective antiviral treatment in Australia, and the resulting reduction in CHB‐associated mortality in those most at risk of adverse outcomes. Additionally, modeled outcomes indicate the impact of treatment scale‐up on the number of people living with cirrhosis, underscoring that appropriate antiviral treatment can substantially reduce progression to cirrhosis and also reverse established cirrhosis in people living with CHB (as illustrated in Fig. 6). Whereas substantial focus should remain on increasing diagnosis, focusing on improving treatment uptake and enhancing care for those affected is also essential. This is consistent with previous research that highlights the levels of engagement in care are well below where they need to be.2
It is important to note that any future changes to birth dose uptake are unlikely to have a substantive impact on the model outputs given that approximately 95% of new CHB infections in the model are in people born outside of Australia.The changes in CHB prevalence by age in Australia over time highlights the achievements of hepatitis B vaccination uptake among infants born both in Australia, and especially overseas in high hepatitis B prevalence settings (illustrated by the decrease in prevalence from 1991 in those aged <20 years). The impact of these programs will extend into older age groups over time. The majority of people living with CHB in Australia were born overseas and acquired hepatitis B in their country of origin, and therefore changes in the size, country of origin, and age distribution of Australia's migrant population will profoundly affect the epidemiology and future projections of hepatitis B in Australia. For example, the shift in prevalence in the year 2000 of those aged 20‐39 shows the impact of recently arrived migrants from countries with increasing levels of infant vaccination coverage, whereas the slow increase in prevalence of those aged >40 years shows the impact of the aging population living with CHB.
This analysis shows the utility of the complex model constructed to address other key questions, including the proportion of people living with CHB estimated to be eligible for treatment and the impact of overseas vaccination on the future burden of CHB in Australia. Further details regarding these and other analyses will be the subject of subsequent work. This model could readily be adapted for use in other settings, especially in other generally low‐prevalence populations where there is significant migration from endemic areas. The model presented here has also been used to estimate inequities in diagnosis, treatment uptake, and attributable burden of CHB at subnational levels.31 Because of the nature of the routine data sources that were utilized to parameterize our model, such as population demographic data, published literature, serosurveys, and local surveillance data, including notifications, vaccination rates, and treatment uptake, this approach could be readily replicated in other settings where similar data sources are available.
Limitations to the model arise where there is unavailability of, or uncertainty in, source data. This particularly applied to prevalence estimates by age for priority populations, including Aboriginal and Torres Strait Islander peoples.24 Work to establish more rigorous estimates, and to apply these together with specific natural history and treatment coverage data to a dedicated model simulating CHB in Aboriginal and Torres Strait Islander Australians, is ongoing.
Furthermore, a lack of natural history information (particularly relating to distributions of phases for CHB by age group in different populations), and surveillance of sequelae of chronic infection other than HCC (such as DC), limits the capacity to benchmark model outputs against real‐world data. The sensitivity analysis highlighted that the key drivers of the number of people living with CHB and attributable deaths because of HCC and DC were the prevalence of source countries and the proportion of people living with cirrhosis migrating into the population.
In conclusion, mathematical modeling is a useful technique for determining and assessing progress toward national, regional, and global service coverage indicators for chronic diseases such as CHB and the projected results of different levels of access to these services (such as antiviral treatment) on impact targets, including attributable morbidity and mortality. We demonstrate here a model able to capture a complicated epidemiological setting that demonstrates that Australia is not currently on track to meet our own National Hepatitis B Strategy targets for CHB diagnosis and treatment, nor the GHSS targets every member state in the WHO has committed to achieve by 2030. However, while striving to increase service delivery to meet these objectives, it should be remembered that many lives have already been saved from existing levels of treatment and care. Appropriate application of carefully developed and consistently refined modeling simulations will not only help monitor the impact of increasing treatment access, but also can inspire further action.
Author Contributions
KM carried out the modeling, analyzed results and drafted the manuscript. NR carried out literature review, data collection and reviewed the manuscript. JM analyzed results and reviewed the manuscript. NA analyzed results and reviewed the manuscript. BC conceived the project, analyzed results and reviewed the manuscript.
Supporting information
Acknowledgment
We acknowledge the following national and jurisdictional organizations for the provision of the data used in preparing the statistics contained in this article: Australian Bureau of Statistics, Australian Government Department of Health, Australian Government Department of Human Services, and Department of Social Services. We would also like to acknowledge the members of the WHO Collaborating Centre for Viral Hepatitis Epidemiology, Public Health Research Advisory Group, and the Cascades Reference Group of the Kirby Institute for their advice, and Kelly Hosking, Geoff Stuart and Jane Davies from Hepatitis B Sero‐coding Project, Northern Territory Government for providing Aboriginal and Torres Strait Islander specific data and context. We would also like to thank experts who provided data regarding transition estimates based on clinical experience which helped us to generate phase distribution of migrants by region of birth which was used in our model.
Supported by the Blood Borne Viruses and Sexually Transmissible Infections Surveillance and Research Programme–Surveillance for Hepatitis B Indicators (H1516G021), Australian Department of Health. While the Australian Department of Health provides financial support for this project, the material contained, or the views expressed in this resource, should not be taken to represent the views of the Australian Department of Health.
Potential conflict of interest: Nothing to report.
References
- 1. MacLachlan J, Allard N, Carville K, Haynes K, Cowie B. Mapping progress in chronic hepatitis B: geographic variation in prevalence, diagnosis, monitoring and treatment, 2013–15. Aust N Z J Public Health 2018;42:62‐68. [DOI] [PubMed] [Google Scholar]
- 2. MacLachlan JH, Thomas LA, Cowie BC. Viral Hepatitis Mapping Project: Geographic diversity in chronic hepatitis B and C prevalence, management and treatment—National Report 2017. Darlinghurst, NSW, Australia: Australasian Society for HIV, Viral Hepatitis and Sexual Health Medicine (ASHM); 2019. Report No.: ISBN: 978‐1‐921850‐30‐1. Accessed April 1, 2019. [Google Scholar]
- 3. MacLachlan JH, Cowie BC. Cultural and linguistic diversity of people living with chronic hepatitis B in 2011–2016: changing migration, shifting epidemiology. Aust N Z J Public Health 2018;42:441‐443. [DOI] [PubMed] [Google Scholar]
- 4. WHO . Hepatitis B Control Through Immunisation: A Reference Guide. Manila: World Health Organisation Regional Office for the Western Pacific; 2014. [Google Scholar]
- 5. WHO . Hepatitis B Immunisation Dashboards World Health Organisation Regional Office for the Western Pacific 2019. https://hiip.wpro.who.int/portal/HealthThemes/Immunization/Immunizationsubthemes/TabId/169/ArtMID/905/ArticleID/189/Default. [Google Scholar]
- 6. Brown CR, Allard NL, MacLachlan JH, Cowie BC. Deaths from liver cancer continue to rise in Australia: is elimination by 2030 possible? Intern Med J 2017;47:604‐605. [DOI] [PubMed] [Google Scholar]
- 7. Global Burden of Disease Liver Cancer C, Akinyemiju T, Abera S, Ahmed M, Alam N, Alemayohu MA, et al. The Burden of Primary Liver Cancer and Underlying Etiologies From 1990 to 2015 at the Global, Regional, and National Level: Results From the Global Burden of Disease Study 2015. JAMA Oncol 2017;3:1683‐1691. [DOI] [PMC free article] [PubMed] [Google Scholar]
- 8. Fitzmaurice C, Akinyemiju TF, Al Lami FH, Alam T, Alizadeh‐Navaei R, Allen C, et al. Global, regional, and national cancer incidence, mortality, years of life lost, years lived with disability, and disability‐adjusted life‐years for 29 cancer groups, 1990 to 2016: a systematic analysis for the Global Burden of Disease Study. JAMA Oncol 2018;4:1553‐1568. [DOI] [PMC free article] [PubMed] [Google Scholar]
- 9. Stanaway JD, Flaxman AD, Naghavi M, Fitzmaurice C, Vos T, Abubakar I, et al. The global burden of viral hepatitis from 1990 to 2013: findings from the Global Burden of Disease Study 2013. Lancet 2016;388:1081‐1088. [DOI] [PMC free article] [PubMed] [Google Scholar]
- 10. Terrault NA, Bzowej NH, Chang KM, Hwang JP, Jonas MM, Murad MH. AASLD guidelines for treatment of chronic hepatitis B. Hepatology 2015. [DOI] [PMC free article] [PubMed] [Google Scholar]
- 11. Global Health Sector Strategy on Viral Hepatitis, 2016‐2021. Geneva: World Health Organization; 2016. [Google Scholar]
- 12. Global Hepatitis Report, 2017. Geneva: World Health Organization; 2017. [Google Scholar]
- 13. Australian Government Department of Health . Third National Hepatitis B Strategy 2018‐2022. Canberra: Australian Government Department of Health; 2018. http://www.health.gov.au/internet/main/publishing.nsf/Content/ohp-bbvs-1/$File/Hep-B-Third-Nat-Strategy-2018-22.pdf. Accessed February 11, 2019. [Google Scholar]
- 14. Cowie BC. Novel approaches to an improved understanding of the epidemiology and control of hepatitis B virus infection in Australia. Melbourne: University of Melbourne; 2009. [Google Scholar]
- 15. MacLachlan JH, Allard N, Towell V, Cowie BC. The burden of chronic hepatitis B virus infection in Australia, 2011. Aust N Z J Public Health 2013;37:416‐422. [DOI] [PubMed] [Google Scholar]
- 16. Australian Historical Population Statistics (Cat. No. 3105.0.65.001). Canberra: Australian Bureau of Statistics, Commonweath of Australia; 2014. [Google Scholar]
- 17. Australian Demographic Statistics (Cat. No. 3101). Canberra: Australian Bureau of Statistics, Commonweath of Australia; 2017. [Google Scholar]
- 18. Deaths in Australia, 1997 to 2007. (Cat. No. 3302.0). Canberra: Australian Bureau of Statistics, Commonweath of Australia; 2008. [Google Scholar]
- 19. Deaths in Australia, 2004 to 2014. (Cat. No. 3302.0). Canberra: Australian Bureau of Statistics, Commonweath of Australia; 2015. [Google Scholar]
- 20. Life Tables, States, Territories and Australia. 2009 to 2016. (Cat. No. 3302.0.55.001). Canberra: Australian Bureau of Statistics, Commonweath of Australia; 2016. [Google Scholar]
- 21. Australian Bureau of Statistics. Net Overseas Migration 2004 onwards . http://stat.data.abs.gov.au/Index.aspx?DatasetCode=NETOVERSEASMIGRATION_CY. Accessed November 20, 2018. [Google Scholar]
- 22. Migration, Australia, 2005‐2006 (Cat. No. 3412.0). Canberra: Australian Bureau of Statistics, Commonweath of Australia; 2007. [Google Scholar]
- 23. Migration, Australia, 2016‐2017 (Cat. No. 3412.0). Canberra: Australian Bureau of Statistics, Commonweath of Australia; 2018. [Google Scholar]
- 24. Graham S, MacLachlan JH, Gunaratnam P, Cowie BC. Chronic hepatitis B prevalence in Australian Aboriginal and Torres Strait Islander people before and after implementing a universal vaccination program: a systematic review and meta‐analysis. Sex Health 2019;16:201‐211. [DOI] [PubMed] [Google Scholar]
- 25. Di Bisceglie AM, Lombardero M, Teckman J, Roberts L, Janssen HLA, Belle SH, et al. Determination of hepatitis B phenotype using biochemical and serological markers. J Viral Hepat 2017;24:320‐329. [DOI] [PMC free article] [PubMed] [Google Scholar]
- 26. Spradling PR, Xing J, Rupp LB, Moorman AC, Gordon SC, Teshale ET, et al. Distribution of disease phase, treatment prescription and severe liver disease among 1598 patients with chronic hepatitis B in the Chronic Hepatitis Cohort Study, 2006‐2013. Aliment Pharmacol Ther 2016;44:1080‐1089. [DOI] [PubMed] [Google Scholar]
- 27. Shimakawa Y, Lemoine M, Njai HF, Bottomley C, Ndow G, Goldin RD, et al. Natural history of chronic HBV infection in West Africa: a longitudinal population‐based study from The Gambia. Gut 2016;65:2007‐2016. [DOI] [PubMed] [Google Scholar]
- 28. Fattovich G, Bortolotti F, Donato F. Natural history of chronic hepatitis B: special emphasis on disease progression and prognostic factors. J Hepatol 2008;48:335‐352. [DOI] [PubMed] [Google Scholar]
- 29. National Notifiable Diseases Surveillance System . Canberra: Australian Government Department of Health , Comonwealth of Australia; 2019. http://www.health.gov.au/internet/main/Publishing.nsf/Content/cda-surveil-nndss-nndssintro.htm. Accessed May 6, 2019. [Google Scholar]
- 30. Marino S, Hogue IB, Ray CJ, Kirschner DE. Review: A methodology for performing global uncertainty and sensitivity analysis in systems biology. J Theor Biol 2008;254:178‐196. [DOI] [PMC free article] [PubMed] [Google Scholar]
- 31. Romero N, McCulloch K, Allard N, MacLachlan JH, Cowie BC. National Surveillance for Hepatitis B Indicators: Measuring the progress towards the targets of the National Hepatitis B Strategy ‐ Annual Report 2017. Melbourne, Australia: WHO Collaborating Centre for Viral Hepatitis, The Doherty Institute; 2019. [Google Scholar]
Associated Data
This section collects any data citations, data availability statements, or supplementary materials included in this article.
Supplementary Materials