Abstract
Clear‐cell renal cell carcinoma (ccRCC) presents challenges to clinical management because of late‐stage detection, treatment resistance, and frequent disease recurrence. Metabolically, ccRCC has a well‐described Warburg effect utilization of glucose, but how this affects complex carbohydrate synthesis and alterations to protein and cell surface glycosylation is poorly defined. Using an imaging mass spectrometry approach, N‐glycosylation patterns and compositional differences were assessed between tumor and nontumor regions of formalin‐fixed clinical ccRCC specimens and tissue microarrays. Regions of normal kidney tissue samples were also evaluated for N‐linked glycan‐based distinctions between cortex, medullar, glomeruli, and proximal tubule features. Most notable was the proximal tubule localized detection of abundant multiantennary N‐glycans with bisecting N‐acetylglucosamine and multziple fucose residues. These glycans are absent in ccRCC tissues, while multiple tumor‐specific N‐glycans were detected with tri‐ and tetra‐antennary structures and varying levels of fucosylation and sialylation. A polycystic kidney disease tissue was also characterized for N‐glycan composition, with specific nonfucosylated glycans detected in the cyst fluid regions. Complementary to the imaging mass spectrometry analyses was an assessment of transcriptomic gene array data focused on the fucosyltransferase gene family and other glycosyltransferase genes. The transcript levels of the FUT3 and FUT6 genes responsible for the enzymes that add fucose to N‐glycan antennae were significantly decreased in all ccRCC tissues relative to matching nontumor tissues. These striking differences in glycosylation associated with ccRCC could lead to new mechanistic insight into the glycobiology underpinning kidney malignancies and suggest the potential for new therapeutic interventions and diagnostic markers.
Keywords: clear‐cell renal cell carcinoma, fucosylation, MALDI imaging, N‐glycosylation, polycystic kidney disease
1. INTRODUCTION
Renal cell carcinoma derived from epithelial tubular cells represents 90% of kidney cancers, and clear‐cell renal cell carcinoma (ccRCC) is the most prevalent subtype comprising 70% to 80% of cases.1, 2 Typically, ccRCC is detected at advanced stages and, in general, is highly resistant to standard chemotherapy and radiotherapy treatments leading to high rates of recurrence and mortality.2, 3 The histopathological hallmark of ccRCC is a clear cytoplasm appearance, because of accumulation of multiple lipids and glycogen, associated with Warburg effect metabolism.4, 5 For most ccRCC, the Warburg metabolism is associated with mutations of the von Hippel‐Lindau tumor suppressor gene,6, 7 leading to stabilization of hypoxia‐inducible factor 1α (HIF1A) and hypoxia‐inducible factor‐2α.8, 9 This stabilization of HIF1A leads to downstream changes resulting in an oncologic shift in increased glucose uptake and increased glycolytic flux in the pentose phosphate pathway associated with the Warburg effect.10 Multiple TCGA studies of ccRCC have confirmed many Warburg effect–related changes at the genomic/transcript level and correlated changes with stage and survival.11, 12
Previous collaborative genomic and proteomic studies from our groups reported the use of paired ccRCC tissues representing nontumor and tumor stages 1 to 4.13, 14, 15 These studies identified multiple transcriptomic and proteomic changes in tumors associated with a fundamental Warburg effect type metabolism of glucose utilization. A research area that has not been evaluated is the effects that increased glucose and glutamine utilization have on complex carbohydrate metabolism and cell surface glycosylation in ccRCC tissues. Metabolically, the precursors for complex carbohydrate biosynthesis of the sugar components of glycoproteins, proteoglycans, and glycolipids are integrally linked with glucose and glutamine metabolism. Changes in cell surface glycosylation during cancer progression are well described and impact multiple cellular functions including cell‐cell adhesion, signal transduction, and immune recognition.16, 17 Inherent in these changes in glycosylation is the impact on potential therapeutic responses, and for ccRCC, this is particularly critical in that vascular endothelial growth factor–targeted therapies and immunotherapies are the primary treatment options.1, 18 Few studies have evaluated the changes in glycosylation in ccRCC, which is thus the focus of the current paper.
The N‐glycome represents the structural composition of N‐linked glycans attached to asparagine residues on protein carriers in a given cell or tissue. In this report, the N‐glycome of multiple human kidney tissues and tissue microarrays (TMAs) representing normal, polycystic kidney disease and multiple ccRCC stages was determined using a matrix‐assisted laser desorption/ionization (MALDI) imaging mass spectrometry approach that allows spatial mapping of N‐glycans in frozen or formalin‐fixed tissues.19, 20, 21, 22 Colocalization of different glycan structural classes to specific tubule and glomeruli regions is also demonstrated. For comparison, a non‐cRCC polycystic kidney disease tissue was also analyzed. Multiple N‐glycans were identified that were increased in ccRCC, as well as a significant decrease in multifucosylated N‐glycans normally associated with proximal tubules. Correlative changes in the transcript levels of glycan biosynthetic genes are also presented.
2. MATERIALS AND METHODS
2.1. Reagents
High‐performance liquid chromatography–grade acetonitrile, ethanol, methanol, xylene, and water were obtained from Fisher Scientific (Pittsburg, PA, USA). Citraconic anhydride for antigen retrieval was obtained from Thermo Scientific (Bellefonte, PA, USA). Alpha‐cyano‐4‐hydroxycinnamic acid (CHCA) and Trifluoroacetic acid (TFA) were obtained from Sigma‐Aldrich (St. Louis, MO, USA). Recombinant PNGaseF Prime was obtained from N‐Zyme Scientifics (Doylestown, PA, USA). Hematoxylin and Eosin (H&E) stains were obtained from Cancer Diagnostics (Durham, NC, USA).
2.2. Tissue samples
All ccRCC tissue samples were obtained from the Mayo Clinic biorepository as previously described.13, 14 Briefly, samples were part of an IRB‐approved study begun in 2003 to obtain discarded tissues from any patient with sporadic conventional RCC who underwent nephrectomy and gave informed consent. The tissue samples are linked to the Nephrectomy Registry database, and collections of pathological specimens occurred in such a manner that subjects could not be identified. Samples were collected from surgical resections, snap frozen in liquid nitrogen, and stored at −80°C. A centralized pathology review on all tumor samples was performed to confirm tumor histologic classification and tumor lymph node metastases (TNM) stage and grade. The following definitions were used: Stage 1 is localized ccRCC with tumor less than 7 cm; stage 2 is localized ccRCC with tumor greater than 7 cm; stage 3 is invasive ccRCC into Gerota fascia; stage 4 ccRCC is metastatic disease to a distal organ. Corresponding nontumor tissues from each donor were collected from distal locations. Tissue microarray slides representing stages 1 to 4 ccRCC were prepared from these collected sample sets. Three pairs of frozen stage 4 ccRCC and matching nontumor tissue sections were fixed in formalin and paraffin‐embedded for subsequent use in the current study. The nontumor tissue with the best cross section of the different regions of the kidney was used as the representative tissue pair of this group. A formalin‐fixed paraffin‐embedded (FFPE) tissue representative of human polycystic kidney disease and a human ccRCC Fuhrman nuclear grade 2/4 tissue, both deidentified to donor, were obtained from the biorepository at Medical University of South Carolina.
2.3. Tissue preparation and PNGase F digestion
Tissue slides were processed and digested with PNGase F Prime enzyme using a standardized protocol.21 Briefly, tissue slides were dewaxed in xylenes and then rehydrated in a gradation of ethanol and water washes prior to antigen retrieval with citraconic anhydride buffer as previously descriibed.20, 21 Using an M3 TMSprayer (HTX Technologies LLC, Chapel Hill, NC), 15 passes of PNGase F at 0.1 μg/μL were then sprayed onto the slides followed by a 2‐hour digest at 37°C in a prewarmed humidity chamber. After desiccation, 10 passes of 7‐mg/mL CHCA matrix in 50% acetonitrile 0.1% TFA was applied at 0.1 mL/min with a 2.5 mm offset and a velocity of 1300 at 80°C and 10 psi using the TMSprayer.21 Slides were stored in a desiccator until analysis.
2.4. MALDI–Fourier transform ion cyclotron resonance analysis of N‐glycans
A Solarix dual‐source 7T MALDI–Fourier transform ion cyclotron resonance mass spectrometer (MALDI‐FTICR MS) (Bruker Daltonik, Bremen, Germany) equipped with a 2000‐Hz SmartBeam II MALDI laser with a laser spot size of 25 μm was used to detect released N‐glycan ions. A total of 200 laser shots per pixel with a step size of 150 μm between pixels were collected as previously described.21 After MS data acquisition, spectrums were uploaded to FlexImaging 4.0 software (Bruker Daltonik) for analysis of the mass range m/z 500 to 4000. FlexImaging‐generated glycan images normalized to total ion current were then searched using accurate mass against a database of known glycans generated using GlycoWorkbench. Glycan structures annotated in this paper are compositionally accurate as determined by mass as well as prior structural characterizations by MALDI‐FTICR MS, or MALDI–time‐of‐flight mass spectrometry (MALDI‐TOF MS), and liquid chromatography‐MS/MS.23, 24, 25 A key to monosaccharide unit symbols used to construct depictions of glycan structures is provided in Figure S1. SCiLS Lab 2019c imaging software (Bruker Daltonik) was used in concert with FlexImaging to generate comparisons of glycan intensity and segmentation analyses. SCiLS Lab was also used to generate area under the peak (AUP) intensity values for TMAs and tissue slices after normalizing glycan intensity values to total ion current, which were subsequently exported to Microsoft Excel for analysis. Glycan structures detected and intensity data for the nontumor and ccRCC 4 tissue and stage 1 tissue microarray are provided in Figure S1. Log2 fold change (FC) was calculated by comparing individual glycan intensities between normal and tumor tissues on a patient by patient basis. Multiple Experiment Viewer software was used to generate hierarchical clustering analyses from calculated FC values. To determine statistically significant changes in glycan expression, AUP values were evaluated using a two‐sample t test assuming unequal variance to generate their P values.
2.5. Gene array data
A previously published gene array dataset for paired normal and ccRCC tumors (stages 1‐4) was derived from Affymetrix Human Genome U133 Plus 2.0 Array chip expression analysis.13, 15
3. RESULTS
3.1. N‐Glycan analysis of ccRCC tissues
The initial assessment of the human kidney N‐glycome was done using FFPE tissues representing different grades and stages of ccRCC. Tissues were antigen retrieved, sprayed with PNGaseF, and released N‐glycans detected by MALDI‐FTICR MS using a standardized protocol.21 Shown in Figure 1 is the N‐glycan profiling of a representative ccRCC tissue selected because it had both tumor (Fuhrmann grade 2) and nontumor sections separated by a fibrillar capsule. There was a particular structural theme associated with the nontumor region, involving glycans with a bisecting N‐acetylglucosamine (GlcNAc) and multiple fucose residues with bi‐, tri‐ and tetra‐antennary branches (Figure 1B). Fucosylated, bisecting GlcNAc N‐glycan structures representing m/z = 2158, 2304, and 2816 have been reported in mouse kidney studies by both MALDI‐TOF and ESI‐LC MS/MS analysis.26 High mannose glycans were mainly detected in nontumor regions but were also present in the tumor region (Figure 1C). Glycans in the fibrillar capsule were primarily represented by a biantennary core fucosylated N‐glycan (Hex5HexNAc4Fuc1) and a mono‐sialylated version (Hex5HexNAc4Fuc1NeuAc1). An overlay image of these regions is shown in Figure 1A, along with a tetra‐antennary tumor glycan (Hex7HexNAc6Fuc1) and fucosylated bisecting GlcNAc glycan (Hex6HexNAc6Fuc2).
Figure 1.
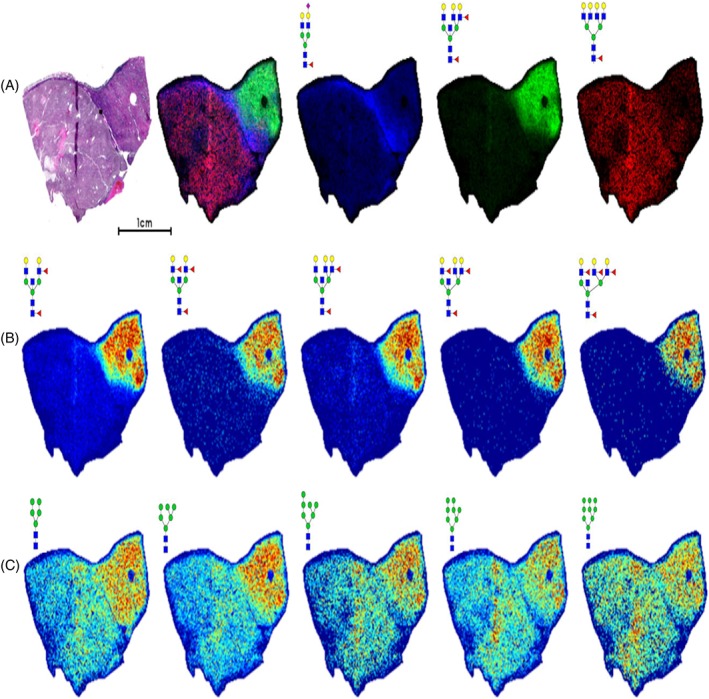
N‐glycan imaging MS of a representative ccRCC tissue. A Furhmann grade 2 ccRCC tissue was analyzed for N‐glycan distribution by MALDI‐FTICR imaging MS. A, H&E stain shown with an overlay image of three glycans in specific regions: fibrillar (blue; m/z = 2122.7245, Hex5HexNAc4Fuc1NeuAc1), nontumor (green; m/z = 2523.9088, Hex6HexNAc6Fuc2), and tumor (red; m/z = 2539.9037, Hex7HexNAc6Fuc1). B, Multiple N‐glycans with bisecting GlcNAc and multiple fucosylated residues localized to the nontumor region. C, Distribution of high‐mannose N‐glycans
Because of the structural feature of tumor separated from nontumor by the fibrillar capsule, a higher spatial resolution analysis of 50‐μm step size was done for a smaller subsection of tissue that encompassed the three features. As shown in Figure 2, glomeruli and tubules are evident in the nontumor region. Doing an overlay of N‐glycan images with the H&E, it is clear that the bisecting GlcNAc structures are associated with the proximal tubules (Figure 2A,B). The fibrillar core fucosylated biantennary glycan was evident (Figure 2C). Although not detected as intensely, there were also clear glomeruli specific glycans that had tetra‐antennary structures, Hex7HexNAc6Fuc1 and Hex7HexNAc6Fuc1NeuAc1 (Figure 2D,E). These are glycans that are also abundant in the tumor region (see also Figure 1A). Not shown were glycans with related structures in the glomeruli, a sulfated species (Hex7HexNAc6Fuc2S) and one with an N‐acetylglucosamine‐galactose (LacNAc) extension (Hex8HexNAc7Fuc1). An overlay image of three glycans representative of each region is shown in Figure 2F.
Figure 2.
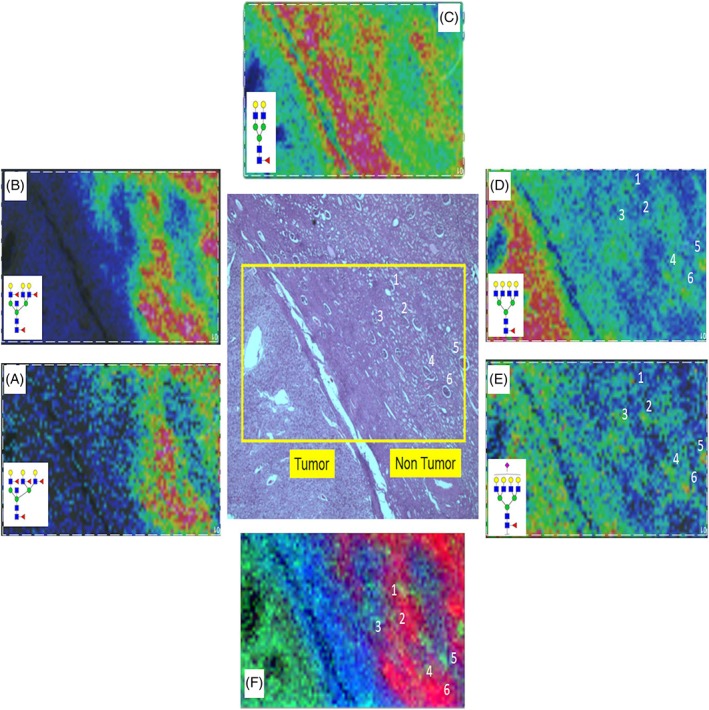
N‐glycan profiles at the fibrillar interface between tumor and nontumor regions. Higher spatial resolution MALDI‐FTICR imaging MS of a highlighted region of the ccRCC Fuhrmann grade 2 tissue is shown. A,B, Bisecting GlcNAc structures (m/z = 2669.9667, Hex6HexNAc6Fuc3; m/z = 2816.0246, Hex6HexNAc6Fuc4) are associated with the proximal tubules. C, Detection of bi‐antennary glycan (m/z = 1809.6393, Hex5HexNAc4Fuc1) in fibrillar core. D,E, Weak but clear detection of glomeruli (annotations 1‐6) via tetra‐antennary glycans (m/z = 2539.9037, Hex7HexNAc6Fuc1; m/z = 2853.9983, Hex7HexNAc6Fuc1NeuAc1). Specific glomeruli are numbered in the H&E‐stained tissue for comparison with the N‐glycan images. F, Overlay of three N‐glycans showing clear distinctions between glomeruli, tubules, and fibrillar regions
Two additional kidney FFPE tissues were evaluated for their particular clinical features. A pair of tissues from the same donor representing a distal nontumor section and a stage 4 ccRCC section were compared. A summary table of the N‐glycans detected in these tissues and others in this report is provided in Figure S1. An initial analysis of the nontumor section alone was done, as shown in the segmentation analysis of 79 N‐glycans in Figure 3A. There are clear distinctive layers of different glycans structures associated with the different cortex and medullar regions of this kidney tissue. An overlay image of four individual glycans is shown in Figure 3B, correlating well with the segmentation image and the histopathology of the H&E‐stained tissue. Additional glycans and their localization to specific regions of this tissue are shown in Figure S2. The fucosylated bisecting GlcNAc N‐glycans localize to the cortex, as well as the high mannose structures. The predominant structural features of medullar glycans were basic biantennary and tri‐antennary structures with a single fucose modification. There is also a unique glycomic structure pattern associated at the interface between cortex and medulla represented by multifucosylated glycans that lack the bisecting GlcNAc (Figures 3 and S2).
Figure 3.
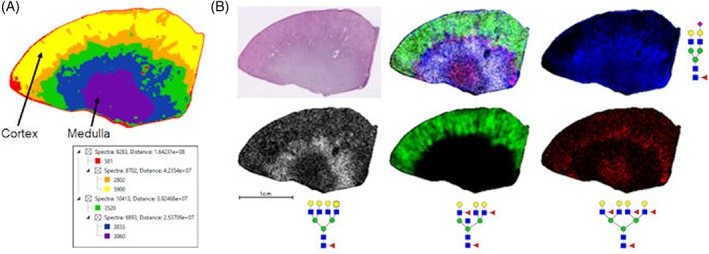
N‐glycan profile of representative N‐glycans in a cortex and medulla cross section. A, Segmentation analysis of 19 696 spectra in six nodes of 79 N‐glycans showing specific layers of glycan organization in different tissue regions. The structures and m/z values of these 79 N‐glycans are provided in Figure S1. B, Individual cortex (green; m/z = 2523.9088, Hex6HexNAc6Fuc2), medulla (blue; m/z = 2122.7245, Hex5HexNAc4Fuc1NeuAc1 +2Na), and interface (white; m/z = 2581.9336, Hex6HexNAc7Fuc1; red; m/z = 2978.0774, Hex7HexNAc6Fuc4) glycans along with overlay and representative H&E staining. A terminal N‐acetylgalactosamine structure is present in the m/z = 2581.9336 glycan (in white). Additional N‐glycan images are shown in Figure S2
In Figure 4, the segmentation analysis of 79 glycans is shown (Figure 4B). Glycan images in Figure 4C highlight the differential detection of the fucosylated bisecting GlcNAc tubule glycans in the nontumor sections with minimal to no detection in the tumor tissue. The majority of the glycans detected above m/z = 2500 are tumor associated (in purple, Figure 4B), and these are noted in a column in Figure S1. In Figure 4D, the main tumor glycan structures are shown relative to the nontumor tissue and predominantly consist of tetra‐antennary glycans with multiple fucose residues but not structures with bisecting GlcNAc.
Figure 4.
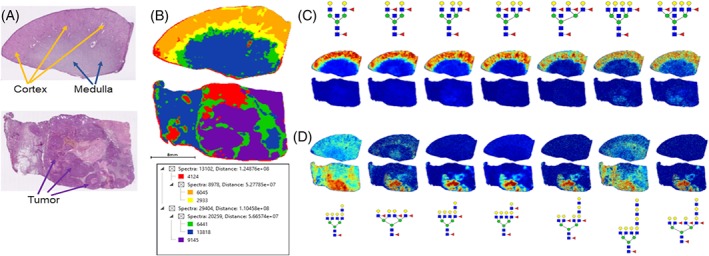
Comparative N‐glycan profiles of patient matched normal and stage 4 ccRCC tissues. A, H&E staining of patient matched distal normal kidney (top) and stage 4 ccRCC (bottom) tissues. Tissue regions of cortex, medulla, and tumor are highlighted by arrows. B, Segmentation analysis of 42 506 spectra and six nodes for 79 N‐glycans in both tissues. C, Normal kidney cortex region defined by glycans with bisecting GlcNAc residues and multiple fucosylated residues, which are absent in ccRCC tissues. D, ccRCC localized N‐glycans that lack bisecting GlcNAc and show increased fucosylation and poly‐LacNAc modification. Differential glycan peak intensities detected between the tumor and normal tissues is provided in Figure S5
3.2. N‐Glycan imaging MS of a polycystic kidney disease tissue
While not a tumor tissue, the striking pathology of a polycystic kidney disease tissue (Figure 5A) was evaluated for N‐glycan distribution. Segmentation of the 79 N‐glycans was grouped into three distinct groupings as shown in Figure 5B. An overlay image of three glycans from each region illustrates the structural theme, notably the reduced amount of fucosylated bisecting GlcNAc structures (in green, Figure 5C). A distinct structural theme for the other N‐glycans detected tracked primarily with the presence or absence of a core fucose residue. As shown in Figure 5D, glycans present in the cyst fluid regions lacked fucose, while the same structures with a fucose localized to the tissue regions.
Figure 5.
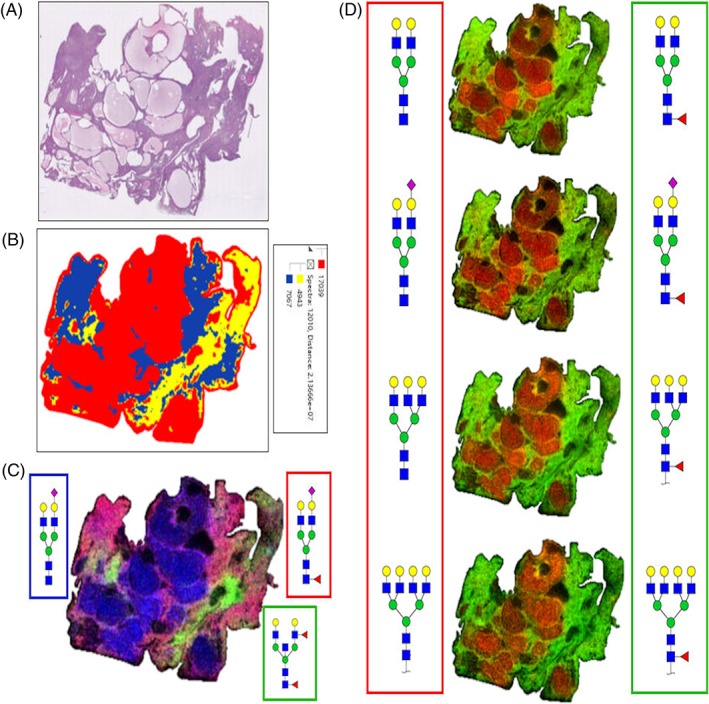
Representative N‐glycan profiles in a polycystic kidney disease tissue. A, H&E‐stained polycystic kidney disease tissue. B, Segmentation analysis of 39 049 spectra in three nodes of 79 N‐glycan structures showing distinctions between tissue and cyst fluid regions. C, Overlay of N‐glycan images representing three regions, cyst (blue; m/z = 1976.6666, Hex5HexNAc4NeuAc1 +2Na), tubule associated (green; m/z = 2158.7766, Hex5HexNAc5Fuc2), and tissue (red; m/z = 2122.7245, Hex5HexNAc4Fuc1NeuAc1 +2Na). D, Localization comparisons of bi‐, tri‐ and tetra‐antennary N‐glycans without core fucose residues localized to cyst fluid regions (red, left side), compared with these same structures with a core fucose modification localized to tissue regions (green, right side)
3.3. N‐Glycan imaging of TMAs for stages 1 to 4 ccRCC
A series of TMAs representing over 150 subjects and tumor stages 1 to 4 were evaluated by N‐glycan imaging MS. Each TMA contained four tissue cores per donor, two from distal nontumor regions and two from the tumor regions. An example glycan image from a stage 1 ccRCC TMA of the most abundant tetra‐antennary tumor glycan (Hex7HexNAc6Fuc1, in red) overlaid with a fucosylated bisecting GlcNAc glycan (Hex6HexNAc6Fuc2, in green) is shown in Figure 6A. This same image overlay of these two glycans is shown for the ccRCC TMAs for stage 1, stages 2 and 4, and stage 3 samples in Figure S3. As shown in Figure 6B, the pattern of fucosylated bisecting GlcNAc tubule glycans present in nontumor tissues and mostly absent in tumor cores is clear. Using SCiLS Lab software, the differential intensities of detected N‐glycans were compared for normal and tumor pairs where all four cores from a patient donor were present. The log2 ratios of each glycan intensity in the nontumor and tumor pairs were assessed to determine the most differential tumor and nontumor glycans detected in the TMAs. These data are provided for the stage 1 ccRCC TMA, as well as representative box and whisker plots of several tumor glycans, as shown in Figure S4. Similar data tables comparing N‐glycan intensities for the stage 4 ccRCC/nontumor tissue pair are provided in Figure S5. The cumulative data in the tumor samples highlight the fundamental loss of the fucosylated bisecting GlcNAc glycans normally present in tubules. Tumor‐associated glycans were primarily tri‐ and tetra‐antennary structures with 1 to 2 fucose residues, LacNAc extensions, or sialic acids.
Figure 6.
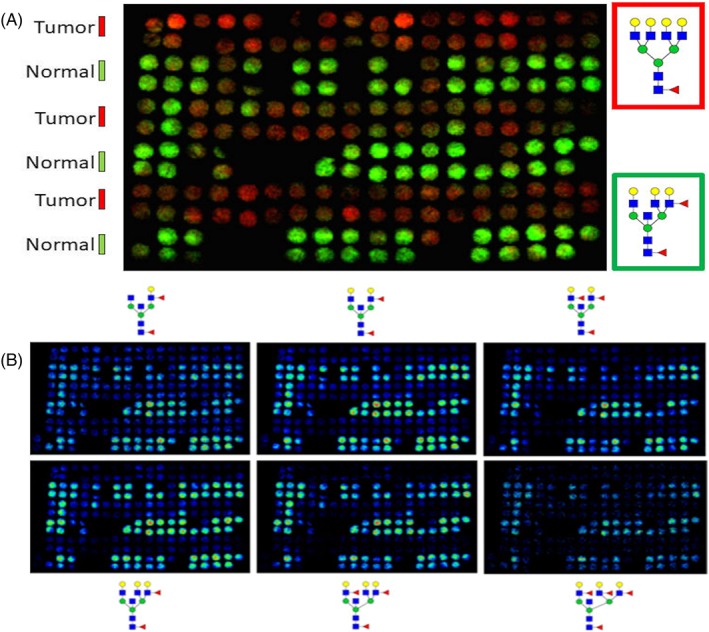
N‐glycan profiling of patient matched normal and tumor pairs for Stage 1 ccRCC. Patient match tumor and distal normal tumor cores, 2 per region, n = 58 donors, were assembled into a tissue microarray. A, Overlay of representative N‐glycan images between normal (green, m/z = 2523.9088, Hex6HexNAc6Fuc2) and tumor (red, m/z = 2539.9037, Hex7HexNAc6Fuc1) tissues. B, Normal samples from stage 1 ccRCC TMA show an abundance of bisecting GlcNAc and multifucosylated N‐glycans (Hex5HexNAc5Fuc1‐3, top panel; Hex6HexNAc6Fuc1‐3, bottom panel). Detection of these structures is generally absent in matched tumor samples. Additional data comparing the intensities of detected N‐glycans between tumor and normal tissues are provided in Figure S4
3.4. Gene array data correlates
Using previously published proteogenomic studies in a ccRCC cohort of matched tumor and normal tissues from our group,13, 14, 15 transcriptomic gene array data were assessed for the glycosyltransferase family of fucosyltransferases, FUT1 to FUT11. These enzymes are responsible for the presence or absence of the multifucosylated structures detected in the tubule and tumor regions. The transcriptomic data were originally obtained from a panel of ccRCC tissues with matched nontumor and tumor tissues for stages 1 to 4 tumors, analogous to the TMA constructs assessed in Figure 6. As shown in Figure 7, four sentinel fucosyltransferase transcript levels are shown for FUT3, FUT6, FUT8, and FUT11. There is a notable decrease in FUT3 and FUT6 transcript levels in the tumor samples from all stages. The FUT3 and FUT6 enzymes are known to transfer fucose residues to glycan antennae. The FUT8 gene is responsible for core fucosylation of the GlcNAc residue that would be attached to the Asn residue on the glycoprotein carrier. FUT8 expression was not significantly different across the stages. This FUT8 expression pattern was similar for other FUT genes tested (FUT1, FUT2, FUT4, FUT5, FUT7, FUT9, and FUT10; data not shown). 13 The FUT11 gene was the only gene increased in tumors, and it is known to be involved in O‐glycosylation addition of fucose residues to glycoproteins. It has been reported previously to be a potential biomarker of ccRCC [26]. The transcript levels for the glucosaminyltransferases responsible for the bisecting GlcNAc structure, MGAT3, and antennae branching, MGAT5, were not differentially expressed between the matched tumor stage and nontumor samples.13
Figure 7.
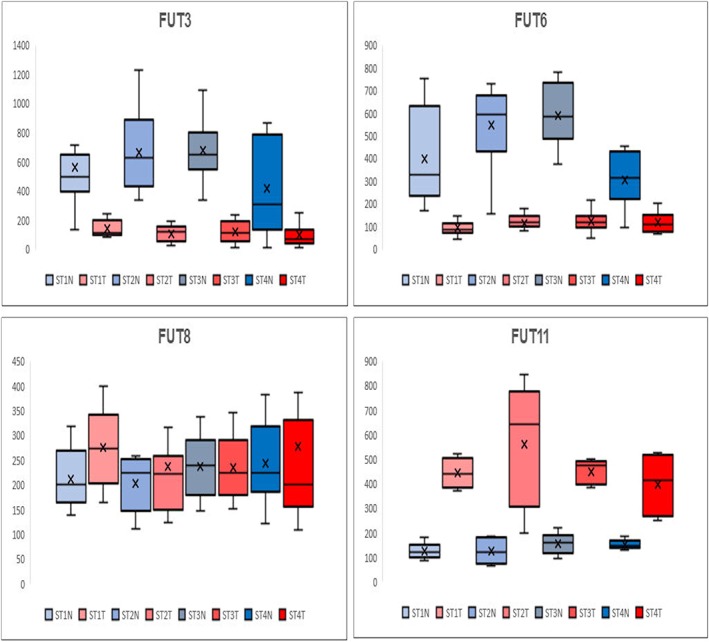
Gene expression analysis of fucosyltransferase genes in stages 1 to 4 ccRCC. Previously published gene expression analyses13, 15 for patient matched tumor and distal normal tissue pairs were assessed for differences in gene expression of representative fucosyltransferases. For each stage, Afflymetrix array intensity data for each gene is shown for five pairs of tissues per stage in box and whisker plots. Shown are normal (N, blue) and tumor (T, red) distribution values for each stage. FUT3 and FUT6 genes encode the enzymes that add fucose residues to N‐glycan antennae; the FUT8 encodes the enzyme responsible for core fucosylation; FUT11 is a fucosyltransferase involved in fucosylation of O‐linked glycans27
4. CONCLUSION
In the kidney tissues evaluated by N‐glycan imaging MS, the predominant feature determined was the presence and overall abundance of the fucosylated and bisecting GlcNAc N‐glycan structures associated with the proximal tubules. As ccRCC is known to develop in the cortex epithelium, the cumulative data highlight the all or nothing glycan presence detected in the cortex regions for nontumor and tumor samples (Figures 1, 4, and 6). The presence of the bi‐, tri‐, and tetra‐antennary fucosylated and bisecting GlcNAc structures have been reported in multiple mouse kidney studies.26, 28, 29 Using a monoclonal antibody recognizing anti‐Lewis x structures (Galβl‐ 4(Fucα1‐3)GlcNAc) in kidney tissue from control and FUT9 knock‐out mice, a clear staining of proximal tubules was evident in control tissues but not present in FUT 9 KO tissues.28, 29 This is consistent with the colocalization of these structures in the proximal tubules detected in the human kidney tissues (Figures 1, 2, 3, 4). In the study of Noro et al,28 glycoprotein carriers of the Lewis x antigen were identified and included cadherin‐16, integrin beta‐1, neprilysin, meprin‐A, and 20 other glycoproteins. A previous N‐glycan MALDI imaging study of mouse kidney tissues also reported the cortex localization of the fucosylated‐bisecting GlcNAc glycans.26 In unpublished studies in rat and mouse kidneys from our group, the same structural patterns and localization have also been observed. The localization of these glycans to the proximal tubules in human kidney cortex regions, as reported herein, is thus likely conserved across many species. Another novel finding was the glycomic structure pattern at the interface between cortex and medulla regions in the nontumor tissue (Figures 3 and S2). Several N‐glycans were also shown to be enriched in glomeruli (Figure 2) and structurally were tetra‐antennary glycans with fucose, sialic acid, and sulfated constituents. It has been difficult to define these glomeruli glycans by MALDI imaging approaches because of multiple factors. This includes their small size and lower abundance relative to tubules and their high mass range >2500 m/z, glycans. Combined with the much larger detected ion intensities from the adjacent tubule glycans throughout the same high mass range, the glomeruli signals are minimized in intact tissues. Current studies are ongoing to target identification of sialylated N‐glycans in the glomeruli using a chemical amidation approach that stabilizes their detection for MALDI imaging analysis.30
In summary, the results indicate the important role that fucosylated N‐linked glycans have in kidney histopathologies. The profound differences in glycan structures detected in the polycystic kidney disease tissue (Figure 5) highlight this. In addition to ccRCC and other renal tumor subtypes, analysis of the changes in fucosylation is warranted for other kidney diseases like diabetes and lupus nephritis. N‐linked glycosylation is only one component of the complex glycan functions in normal and diseased kidneys that include many roles for O‐linked glycans, glycosaminoglycans, and glycolipids.31 Because of the critical need to improve outcomes for promising immunotherapy and angiogenesis targeted treatments for ccRCC that work in subsets of patients,2, 3, 32 continued evaluation of N‐linked glycosylation and other glycan classes in this context could provide new therapeutic and diagnostic assay leads.
Supporting information
Figure S1. Summary table of compositions, m/z values and structural representaions of N‐glycans cumulatively detected in the analyzed tissues. For tissues analyzed in Figures 1‐6, a cumulative list of 81 glycans is shown. This includes a composition, m/z value and a representative structure. The representative structures do not account for many possible isomeric structures that could be present, especially for the larger mass N‐glycans with multiple fucose and sialic acid modifications. A key to the glycan colors and identities is shown in the panel on the right. . Within the data, some glycan species are highlighted to indicate their localization in different analyzed tissues, which include light green for proximal tubule N‐glycans, rose for stage 1 ccRCC TMA tumor glycans, and light red for tumor glycans from the Stage 4 ccRCC tissue. See also the data tables in Supplemental Figures 4 and 5
Figure S2. Representative examples of N‐glycan localization to specific cortex and medulla regions in a normal kidney tissue. An H&E stain of the tissue is shown with regions cortex and medullar regions highlighted. 1 st row, tri‐ and tetra‐antennary N‐glycans with bisecting GlcNAc and multiple fucose residues localized to the cortex; 2 nd row, high‐mannose glycans localized to the cortex; 3 rd row, bi‐ and tri‐antennary structures without bisecting GlcNAc localized to the medulla. 4 th row, cortex‐medullary interface glycans characterized by tri‐ and tetra‐antennary N‐glycans with multiple fucose residues (and no bisecting GlcNAc).
Figure S3. Comparison of detection of a tubule specific N‐glycan versus a tumor N‐glycan in Stage 1‐4 ccRCC TMAs. The bisecting GlcNAc tri‐antennary N‐glycan Hex6HexNAc6Fuc2 (m/z 2523.9088) was detectable at high levels in normal samples across all 4 stages. Detection of the tetra‐antennary N‐glycan Hex7HexNAc6Fuc1 (m/z 2539.9037) was specific to tumor samples across all 4 stages. The H&E stains for each TMA are also included.
Figure S4. Tumor and non‐tumor specific N‐glycans in the Stage 1 ccRCC TMA. A. Area under the peak intensity values for the Stage 1 ccRCC/normal TMA tissue cores were obtained using SCiLS Lab software. Log2FC transformation was done for the averaged peak values, comparing tumor (positive numbers) versus normal (negative numbers). For the stage 1 TMA, values were used only for samples where all four tissue cores were present. Light green color highlights the proximal tubule glycans, and rose color highlights tumor associated glycans. B. Box and whisker plots of representative tumor‐associated N‐glycans are shown
Figure S5. Tumor specific N‐glycans in the Stage 4 and non‐tumor paired tissues. Area under the peak intensity values for the ccRCC/normal Stage 4 tissue pair were obtained using SCiLS Lab software. Log2FC transformation was done for the averaged peak values. A. N‐glycans primarily associated with increased detection in tumor regions (positive numbers). B. N‐glycans primarily associated with increased detection in non‐tumor regions (negative numbers). Light green color highlights the proximal tubule glycans, and light red color highlights the high mass tumor associated glycans.
ACKNOWLEDGEMENTS
This research was supported by R21CA186799 (RRD) and the South Carolina SmartState Centers of Economic Excellence (RRD). This research was supported by R01CA104505 (JAC) and R01CA104505‐05S1 (JAC); a generous gift from the David & Lois Stulberg Endowed Fund for Kidney Cancer Research (JAC); Mr and Mrs Ompal Chauhan Research Fund (JAC); Kidney Cancer Research at Mayo Clinic in Florida (JAC); Scheidel Foundation (JAC); Betty G. Castigliano Fund in Cancer Research Honoring S. Gordon Castigliano, MD (JAC); Francis and Miranda Childress Foundation Fund for Cancer Research (JAC); John A. and Bette B. Klacsmann Fund for Cancer Research at Mayo Clinic in Florida (JAC); and Susan A. Olde, OBE, Fund in Kidney Cancer Research (JAC).
Drake RR, McDowell C, West C, et al. Defining the human kidney N‐glycome in normal and cancer tissues using MALDI imaging mass spectrometry. J Mass Spectrom. 2020;55:e4490 10.1002/jms.4490
REFERENCES
- 1. Rini BI, Campbell SC, Escudier B. Renal cell carcinoma. Lancet. 2009;373(9669):1119‐1132. [DOI] [PubMed] [Google Scholar]
- 2. Hsieh JJ, Purdue MP, Signoretti S, et al. Renal cell carcinoma. Nat Rev Dis Primers. 2017;3(1):17009 10.1038/nrdp.2017.9 [DOI] [PMC free article] [PubMed] [Google Scholar]
- 3. Makhov P, Joshi S, Ghatalia P, Kutikov A, Uzzo RG, Kolenko VM. Resistance to systemic therapies in clear cell renal cell carcinoma: mechanisms and management strategies. Mol Cancer Ther. 2018;17(7):1355‐1364. [DOI] [PMC free article] [PubMed] [Google Scholar]
- 4. Bianchi C, Meregalli C, Bombelli S, et al. The glucose and lipid metabolism reprogramming is grade‐dependent in clear cell renal cell carcinoma primary cultures and is targetable to modulate cell viability and proliferation. Oncotarget. 2017;8:113502‐113515. [DOI] [PMC free article] [PubMed] [Google Scholar]
- 5. Frew IJ, Moch H. A clearer view of the molecular complexity of clear cell renal cell carcinoma. Ann Rev Pathology. 2015;10(1):263‐289. [DOI] [PubMed] [Google Scholar]
- 6. Sato Y, Yoshizato T, Shiraishi Y, et al. Integrated molecular analysis of clear‐cell renal cell carcinoma. Nat Genet. 2013;45(8):860‐867. [DOI] [PubMed] [Google Scholar]
- 7. Nickerson ML, Jaeger E, Shi Y, et al. Improved identification of von Hippel‐Lindau gene alterations in clear cell renal tumors. Clin Cancer Res. 2008;14(15):4726‐4734. [DOI] [PMC free article] [PubMed] [Google Scholar]
- 8. Gossage L, Eisen T, Maher ER. VHL, the story of a tumour suppressor gene. Nat Rev Cancer. 2015;15(1):55‐64. [DOI] [PubMed] [Google Scholar]
- 9. Gordan JD, Lal P, Dondeti VR, et al. HIF‐α effects on c‐Myc distinguish two subtypes of sporadic VHL‐deficient clear cell renal carcinoma. Cancer Cell. 2008;14(6):435‐446. [DOI] [PMC free article] [PubMed] [Google Scholar]
- 10. Semenza GL. HIF‐1 mediates the Warburg effect in clear cell renal carcinoma. J Bioenerg Biomembr. 2007;39(3):231‐234. [DOI] [PubMed] [Google Scholar]
- 11. The Cancer Genome Atlas Research N . Comprehensive molecular characterization of clear cell renal cell carcinoma. Nature. 2013;499:43‐49. [DOI] [PMC free article] [PubMed] [Google Scholar]
- 12. Ricketts CJ, De Cubas AA, Fan H, et al. The cancer genome atlas comprehensive molecular characterization of renal cell carcinoma. Cell Rep. 2018;23:3698. [DOI] [PubMed] [Google Scholar]
- 13. von Roemeling CA, Marlow LA, Radisky DC, et al. Functional genomics identifies novel genes essential for clear cell renal cell carcinoma tumor cell proliferation and migration. Oncotarget. 2014;5:5320‐5334. [DOI] [PMC free article] [PubMed] [Google Scholar]
- 14. Neely BA, Wilkins CE, Marlow LA, et al. Proteotranscriptomic analysis reveals stage specific changes in the molecular landscape of clear‐cell renal cell carcinoma. PLoS ONE. 2016;11(4):e0154074 10.1371/journal.pone.0154074 [DOI] [PMC free article] [PubMed] [Google Scholar]
- 15. Tun HW, Marlow LA, von Roemeling CA, et al. Pathway signature and cellular differentiation in clear cell renal cell carcinoma. PLoS ONE. 2010;5(5):e10696. [DOI] [PMC free article] [PubMed] [Google Scholar]
- 16. Varki A. Biological roles of glycans. Glycobiology. 2017;27:3‐49. [DOI] [PMC free article] [PubMed] [Google Scholar]
- 17. Rodrigues JG, Balmaña M, Macedo JA, et al. Glycosylation in cancer: selected roles in tumour progression, immune modulation and metastasis. Cell Immunol. 2018. Nov;333:46‐57. [DOI] [PubMed] [Google Scholar]
- 18. Heidegger I, Pircher A, Pichler R. Targeting the tumor microenvironment in renal cell cancer biology and therapy. Front Oncol. 2019;9:490. [DOI] [PMC free article] [PubMed] [Google Scholar]
- 19. Powers TW, Jones EE, Betesh LR, et al. Matrix assisted laser desorption ionization imaging mass spectrometry workflow for spatial profiling analysis of N‐linked glycan expression in tissues. Anal Chem. 2013;85(20):9799‐9806. [DOI] [PMC free article] [PubMed] [Google Scholar]
- 20. Powers TW, Neely BA, Shao Y, et al. MALDI imaging mass spectrometry profiling of N‐glycans in formalin‐fixed paraffin embedded clinical tissue blocks and tissue microarrays. PLoS ONE. 2014;9(9):e106255. [DOI] [PMC free article] [PubMed] [Google Scholar]
- 21. Drake RR, Powers TW, Norris‐Caneda K, Mehta AS, Angel PM. In situ imaging of N‐glycans by MALDI imaging mass spectrometry of fresh or formalin‐fixed paraffin‐embedded tissue. Curr Protoc Protein Sci. 2018;94(1):e68. [DOI] [PubMed] [Google Scholar]
- 22. Drake RR, Powers TW, Jones EE, Bruner E, Mehta AS, Angel PM. MALDI mass spectrometry imaging of N‐linked glycans in cancer tissues. Adv Cancer Res. 2017;134:85‐116. [DOI] [PMC free article] [PubMed] [Google Scholar]
- 23. West CA, Wang M, Herrera H, et al. N‐Linked glycan branching and fucosylation are increased directly in Hcc tissue as determined through in situ glycan imaging. J Proteome Res. 2018;17(10):3454‐3462. [DOI] [PMC free article] [PubMed] [Google Scholar]
- 24. Scott DA, Casadonte R, Cardinali B, et al. Increases in tumor N‐glycan polylactosamines associated with advanced HER2‐positive and triple‐negative breast cancer tissues. Proteomics Clin Appl. 2019;13:e1800014. [DOI] [PMC free article] [PubMed] [Google Scholar]
- 25. Holst S, Belo AI, Giovannetti E, van Die I, Wuhrer M. Profiling of different pancreatic cancer cells used as models for metastatic behaviour shows large variation in their N‐glycosylation. Sci Rep. 2017;7(1):16623. [DOI] [PMC free article] [PubMed] [Google Scholar]
- 26. Gustafsson OJ, Briggs MT, Condina MR, et al. MALDI imaging mass spectrometry of N‐linked glycans on formalin‐fixed paraffin‐embedded murine kidney. Anal Bioanal Chem. 2015;407(8):2127‐2139. [DOI] [PMC free article] [PubMed] [Google Scholar]
- 27. Zodro E, Jaroszewski M, Ida A, et al. FUT11 as a potential biomarker of clear cell renal cell carcinoma progression based on meta‐analysis of gene expression data. Tumour Biol. 2014;35(3):2607‐2617. [DOI] [PMC free article] [PubMed] [Google Scholar]
- 28. Noro E, Togayachi A, Sato T, et al. Large‐scale identification of N‐glycan glycoproteins carrying Lewis x and site‐specific N‐glycan alterations in Fut9 knockout mice. J Proteome Res. 2015;14(9):3823‐3834. [DOI] [PubMed] [Google Scholar]
- 29. Comelli EM, Head SR, Gilmartin T, et al. A focused microarray approach to functional glycomics: transcriptional regulation of the glycome. Glycobiology. 2006;16(2):117‐131. [DOI] [PubMed] [Google Scholar]
- 30. Holst S, Heijs B, de Haan N, et al. Linkage‐specific in situ sialic acid derivatization for N‐glycan mass spectrometry imaging of formalin‐fixed paraffin‐embedded tissues. Anal Chem. 2016;88(11):5904‐5913. [DOI] [PubMed] [Google Scholar]
- 31. Reily C, Stewart TJ, Renfrow MB, Novak J. Glycosylation in health and disease. Nat Rev Nephrol. 2019;15(6):346‐366. [DOI] [PMC free article] [PubMed] [Google Scholar]
- 32. Topalian SL, Hodi FS, Brahmer JR, et al. Five‐year survival and correlates among patients with advanced melanoma, renal cell carcinoma, or non‐small cell lung cancer treated with nivolumab. JAMA Oncol. 2019, 5(10):1141‐1420 Jul 25. doi: 10.1001 [DOI] [PMC free article] [PubMed] [Google Scholar]
Associated Data
This section collects any data citations, data availability statements, or supplementary materials included in this article.
Supplementary Materials
Figure S1. Summary table of compositions, m/z values and structural representaions of N‐glycans cumulatively detected in the analyzed tissues. For tissues analyzed in Figures 1‐6, a cumulative list of 81 glycans is shown. This includes a composition, m/z value and a representative structure. The representative structures do not account for many possible isomeric structures that could be present, especially for the larger mass N‐glycans with multiple fucose and sialic acid modifications. A key to the glycan colors and identities is shown in the panel on the right. . Within the data, some glycan species are highlighted to indicate their localization in different analyzed tissues, which include light green for proximal tubule N‐glycans, rose for stage 1 ccRCC TMA tumor glycans, and light red for tumor glycans from the Stage 4 ccRCC tissue. See also the data tables in Supplemental Figures 4 and 5
Figure S2. Representative examples of N‐glycan localization to specific cortex and medulla regions in a normal kidney tissue. An H&E stain of the tissue is shown with regions cortex and medullar regions highlighted. 1 st row, tri‐ and tetra‐antennary N‐glycans with bisecting GlcNAc and multiple fucose residues localized to the cortex; 2 nd row, high‐mannose glycans localized to the cortex; 3 rd row, bi‐ and tri‐antennary structures without bisecting GlcNAc localized to the medulla. 4 th row, cortex‐medullary interface glycans characterized by tri‐ and tetra‐antennary N‐glycans with multiple fucose residues (and no bisecting GlcNAc).
Figure S3. Comparison of detection of a tubule specific N‐glycan versus a tumor N‐glycan in Stage 1‐4 ccRCC TMAs. The bisecting GlcNAc tri‐antennary N‐glycan Hex6HexNAc6Fuc2 (m/z 2523.9088) was detectable at high levels in normal samples across all 4 stages. Detection of the tetra‐antennary N‐glycan Hex7HexNAc6Fuc1 (m/z 2539.9037) was specific to tumor samples across all 4 stages. The H&E stains for each TMA are also included.
Figure S4. Tumor and non‐tumor specific N‐glycans in the Stage 1 ccRCC TMA. A. Area under the peak intensity values for the Stage 1 ccRCC/normal TMA tissue cores were obtained using SCiLS Lab software. Log2FC transformation was done for the averaged peak values, comparing tumor (positive numbers) versus normal (negative numbers). For the stage 1 TMA, values were used only for samples where all four tissue cores were present. Light green color highlights the proximal tubule glycans, and rose color highlights tumor associated glycans. B. Box and whisker plots of representative tumor‐associated N‐glycans are shown
Figure S5. Tumor specific N‐glycans in the Stage 4 and non‐tumor paired tissues. Area under the peak intensity values for the ccRCC/normal Stage 4 tissue pair were obtained using SCiLS Lab software. Log2FC transformation was done for the averaged peak values. A. N‐glycans primarily associated with increased detection in tumor regions (positive numbers). B. N‐glycans primarily associated with increased detection in non‐tumor regions (negative numbers). Light green color highlights the proximal tubule glycans, and light red color highlights the high mass tumor associated glycans.


