Abstract
Background
The pathogens responsible for chronic prostatitis/chronic pelvic pain syndrome (CP/CPPS; NIH category III) are not currently known. the present study utilized high‐throughput next‐generation sequencing to screen for potential pathogens associated with NIH category III CP (CP III).
Methods
This study included 33 patients with CP III and 30 healthy men, from which one sample each of urethral secretions and expressed prostatic secretion (EPS) was collected. High‐throughput next‐generation sequencing was performed to detect the sequence variations and the relative abundance of the bacterial 16S ribosomal variable region and fungal internal transcribed spacer region in all samples. Bioinformatics software and databases were used for data analysis, and differences with P < .05 were considered statistically significant.
Results
Unweighted pair group method with arithmetic mean (UPGMA) cluster analysis, principal component analysis (PCA), and Spearman's rank correlation showed that the microbial compositions of the urethral secretions and EPS collected from the same subject were essentially the same.
Conclusions
No potential pathogens were identified in diagnosed patients with CP III. The EPS may be free from bacteria before and after infection. Changes in the urinary tract microbiome may disrupt the microecological balance of the urinary system, thereby leading to CP III. Conversely, the true pathogens of CP III may not be prokaryotic or eukaryotic microorganisms, Future research may involve the evaluation of noncellular microbes.
Keywords: chronic prostatitis, infection, microbiota, pelvic pain
1. INTRODUCTION
According to the classification criteria established by the U.S. National Institutes of Health (NIH), prostatitis is divided into the following four categories: acute bacterial prostatitis, chronic bacterial prostatitis, chronic prostatitis/chronic pelvic pain syndrome (CP/CPPS), and asymptomatic prostatitis. CP/CPPS reportedly has a significant negative impact on the quality of life. 1 , 2 CP/CPPS accounts for 80% to 90% of prostatitis cases, 3 but its etiology and pathogenesis remain poorly understood.
The pathogens isolated from global cases of acute and CP primarily include Escherichia coli, Staphylococcus aureus, Staphylococcus epidermidis, Klebsiella, Proteus spp., Enterococcus spp., Pseudomonas aeruginosa, and Corynebacterium. 4 , 5 Chronic bacterial prostatitis may also be caused by anaerobic bacteria, the most common of which are Streptococcus sanguis and Bacteroides. Studies have also shown that sexually transmitted microorganisms, such as mycoplasma, Chlamydia trachomatis, Neisseria gonorrhoeae, human papillomavirus, and Trichomonas vaginalis, are among the most common pathogens of CP. 3 , 6
There have been few studies on prostatitis in which the normal microbiota in the male urethra was extensively investigated. Expressed prostatic secretions (EPS) and urine are excreted through the male urethra and consequently are inevitably mixed with urethra‐colonizing microbiota. Therefore, testing EPS and urine for the presence of bacteria must exclude the urethra‐colonizing microbiota and the bacteria contaminating the urethral opening, and neither should be regarded as prostatitis‐causing pathogens. By examining and comparing the microorganisms in the urethral secretions before prostate massage and those in the EPS after the prostate massage, the presence of pathogenic bacteria in the EPS can be determined. Presently, there is no cure for CP III, even after long‐term treatment, because the true pathogen or the pathogenesis of the disease has not been established. Considering that the identification of microorganisms using microbial cultures can be affected by many factors, the present study utilized high‐throughput next‐generation sequencing to screen for potential pathogens of CP III.
2. MATERIALS AND METHODS
2.1. Study population
Between October 2016 and June 2018, a total of 33 male patients with CP III and 30 healthy men who visited the Department of Urology of the Eighth Affiliated Hospital of Sun Yat‐Sen University and the Shenzhen Seventh People's Hospital in China were selected in strict accordance with the classification criteria for prostatitis established by the NIH. The subjects were aged between 18 and 54 years. This study was approved by the Shenzhen Seventh People's Hospital ethics committee, and informed consent was obtained from the subjects.
2.2. Selection criteria
The inclusion criteria were as follows: patients with CP Symptom Index of ≥10 points, persistent symptoms of CP for more than 3 months, reduction or disappearance of lecithin bodies in EPS during routine testing, and white blood cell count more than 10 cells per high‐power magnification field. Patients with urethritis, cystitis, orchitis, epididymitis, diabetes, inflammation of the vas deferens and ejaculatory duct, seminal vesiculitis, and cowperitis were excluded. Former patients explicitly diagnosed with type III CP and with previous negative bacterial cultures. All examined parameters were normal, and no clinical signs of prostatitis were observed in the control group of healthy men.
2.3. Sample collection
Before sample collection, the urethral opening was cleaned with sterile saline, and the bladder of all subjects was voided. The residual liquid in the urethral opening was cleaned with sterile gauze. One sample of urethral secretions before prostate massage and one sample of EPS after prostate massage were collected aseptically.
2.4. Library construction
DNA was extracted from the 126 samples of urethral secretion and EPS. The V4 hypervariable region of the bacterial 16S ribosomal RNA (rRNA) gene and the fungal internal transcribed spacer (ITS) 1 region were amplified from the DNA samples (Table 1). Magnetic beads were used to isolate the amplicons of interest. Finally, the libraries were sequenced. The high‐quality data obtained were used for bioinformatics analyses. Every batch of samples was subjected to DNA extraction and high‐throughput sequencing with the Illumina HiSeq 2500 platform; the quality control (Q30) was set to no less than 80%. Water was used as a negative control for polymerase chain reaction (PCR) because it produces no PCR products on the Agilent 2100 platform and therefore indicates the quality of the sequencing data.
Table 1.
Primers for the V4 region of the 16S rRNA gene and the fungal ITS1 region
| Target region | Primer | Nucleotide sequence |
|---|---|---|
| V4 | Forward | GTGCCAGCMGCCGCGGTAA |
| Reverse | GGACTACHVGGGTWTCTAAT | |
| ITS1 | Forward | CTTGGTCATTTAGAGGAAGTAA |
| Reverse | GCTGCGTTCTTCATCGATGC |
Abbreviation: ITS1, internal transcribed space 1.
2.5. Data analysis
High‐quality data were obtained and overlapped with tags using FLASH software. The USEARCH (v9.1) software was used to cluster the tags into operational taxonomic units (OTUs) using the identity threshold of 97%. Representative sequences of OTUs were obtained and compared against the Greengene database using the RDP Classifier (v2.2) software for taxonomic annotations. The confidence threshold was set to 0.5. OTUs were classified at six taxonomic levels by comparison against the database. Bar charts and histograms for the taxonomic profiling of each sample were constructed. Samples with less than 10% phylum, class, order, and species abundances were categorized as “others”. Samples with less than 20% family and genus abundances were also categorized as “others”.
2.6. Abundance analysis, rarefaction analysis, significance analysis of intergroup differences, and linear discriminant effect size (LEfSe) analysis
Heatmap cluster analysis was initiated at the genus level, and all taxa with an abundance of less than 20% in a sample were grouped as others. Histograms were constructed for all taxa at the phylum, class, order, family, genus, and species levels. Heatmap analysis was performed based on the relative abundance of each taxon within a sample. The heatmaps were generated using the gplots package in R (v3.1.1). Euclidean distances were calculated, and a complete clustering method was used. α‐Diversity analysis was performed for a single sample, and the following indices were analyzed: observed species, Chao, Ace, Shannon, Simpson, and Coverage. The α‐diversity values of the samples were calculated using the Mothur (v1.31.2) software, and the corresponding rarefaction curves were generated using the R (v3.1.1) software. Intergroup differences in alpha‐diversity indices were presented as box plots. β‐Diversity among samples was measured using Bray–Curtis, weighted UniFrac, unweighted UniFrac, and Pearson indices. β‐Diversity heatmaps were generated using a heatmap in the NMF package of the R (v3.1.1) software. Cluster analysis was performed using the QIIME (v1.80) software. An iterative algorithm was used to perform sampling of 75% of the sequences in a sample with the least number of sequences using weighted and unweighted taxon abundance data, respectively. The final statistical results were obtained by analyzing the overall statistics after 100 iterations. Clustering trees were then drawn using R (v3.1.1). The clustering method used was the unweighted pair group method with arithmetic mean (UPGMA). Spearman's rank correlation analysis was performed using R (v3.1.1) software. The significance of intergroup differences was analyzed using the R software rank‐sum test. Adjustment of P‐values was performed using p.adjust in the R (v3.1.1) package, and the Benjamini–Hochberg adjustment method was used.
3. RESULTS
A total of 314 5091 tags were obtained from the valid data in 96 samples. The mean number of tags per sample was 35 814 ± 2196. After clustering the merged tags, 1852 OTUs were obtained based on the 16S rRNA data, and 242 OTUs were obtained based on the ITS region data. There was one unique OTU based on the 16S rRNA sequence, shared among different groups.
3.1. OTU abundance analysis
Principal component analysis (PCA) was performed based on the OTU abundance. Sequence libraries were successfully constructed and the urethral secretions and EPS collected from the same subject for both specimens for 19 cases in the patient group and 9 cases in the control group. The microbiota in the urethral secretions and EPS was relatively similar in the patient group (Figure 1A) and in the control group (Figure 1D). Two specimens of the same study are very close in the figure, and some points almost overlapped. In addition, the microbiome structure of the urethral secretions was similar to that of the EPS in all patients (Figure S1), and the urethral secretions in all control subjects were similar to the microbiome structure in the EPS (Figure S2). However, there were significant differences between the patient and control groups in the microbiota compositions of the EPS (Figure 1B) and urethral secretions (Figure 1C). The bacterial community structure of the patient group showed an obvious clustering phenomenon, with most of them clustered to the left and only a few to the right.
Figure 1.
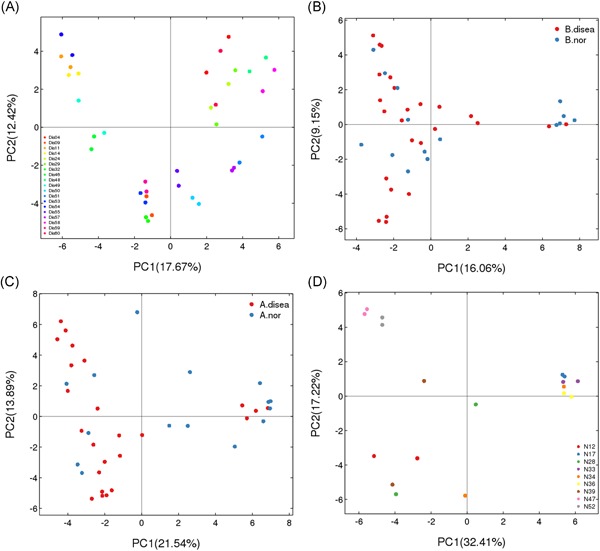
Principal component analysis based on operational taxonomic units abundance (description). X‐axis, 1st principal component and Y‐axis, 2nd principal component. Number in brackets represents contributions of principal components to differences among samples. A dot represents each sample, and different colors represent different groups. Two points of the same color represent the urethral secretion and expressed prostatic secretion of each individual in the patient group (Figure 1A) and the control group (Figure 1D). B. disea denotes the expressed prostatic secretion samples from the patient group, and B. nor denotes those from the control group in Figure 1B. A. disea denotes the urethral secretion samples from the patient group, and A. nor denotes those from the control group in Figure 1C [Color figure can be viewed at http://wileyonlinelibrary.com]
3.2. Spearman's rank correlation
Correlation analysis was performed between the genus‐level bacterial flora in all urethral secretions and the genus‐level bacterial flora in all EPS samples (Figure 2). A significant correlation between the two groups was observed; that is, the bacterial content concomitantly increased or decreased in both groups. At the genus level, Spearman's rank correlation showed that the urethral secretions (Figure S3) and EPS (Figure S4) in the patient and control groups demonstrated a consistent trend of microbiota structural changes; thus a similar strong positive correlation was observed (P < .01).
Figure 2.
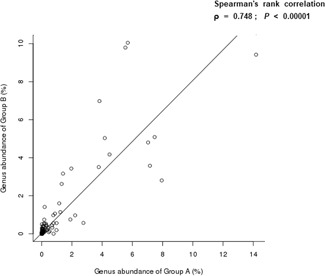
Spearman's rank correlation. P < .01 indicated a significant linear relationship between the two groups. Ρ is positive when two groups show a positive correlation. A is urethra secretion. B is expressed prostatic secretion
3.3. Analysis of taxonomic annotations
Comparison of OTUs against the database at the phylum, class, order, family, genus, and species levels resulted in the annotation of the 16S rRNA sequence‐based OTUs to 7 phyla (Figure S5), 12 classes (Figure S6), 16 orders (Figure S7), 20 families (Figure S8), 22 genera (Figure 3), and 16 species (Figure S9), whereas the ITS region sequence‐based OTUs were annotated to 3 phyla, 11 classes, 22 orders, 27 families, 42 genera, and 50 species.
Figure 3.

The taxonomic composition distribution in samples by Genus‐level [Color figure can be viewed at http://wileyonlinelibrary.com]
3.4. Heatmap analysis
Heatmap clustering analyses were performed at the phylum, class, order, family, genus (Figure 4), and species levels. The top 10 most abundant bacterial species, based on the 16S rRNA sequences, were, in descending order of Streptococcus infantis, E. coli, Acinetobacter guillouiae, Bacillus cereus, Rahnella aquatilis, Clostridium perfringens, Flavobacterium frigidarium, Carnobacterium viridans, Streptococcus agalactiae, and Pseudomonas fragi. The top 10 most abundant fungal species, based on the ITS1 sequences, were, in descending order, Verticillium leptobactrum, Malassezia globosa, Malassezia restricta, Emericella sp. d01, Engyodontium album, Rhodotorula minuta, Davidiella tassiana, Fusarium oxysporum f. sp. melonis, Cladosporium sp. agrAR069, and Peniophora sp. JY 035.
Figure 4.
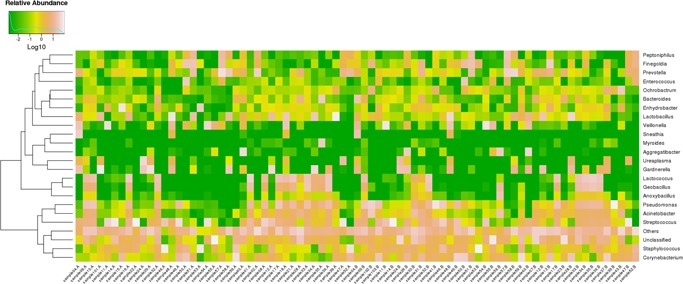
16S rRNA gene Log‐scaled percentage heat map by Genus‐level [Color figure can be viewed at http://wileyonlinelibrary.com]
3.5. Sample‐based rarefaction analysis
α‐Diversity analysis showed that the samples had high degrees of species richness. The rarefaction curves of the different α‐diversity indices for a single sample showed that the sequencing depth essentially covered all species in the sample (Figure S10). Analysis of the Shannon and Simpson indices, based on 16S rRNA, showed significant intergroup differences in species diversity (P < .05), while that based on the ITS region, showed no significant differences (P > .05) (Table 2). Figure 5 shows the box plots of α‐diversity indices in different groups. α‐Diversity analysis further demonstrated significant differences in the Shannon and Simpson diversity of EPS bacterial flora between the patient and control groups (P < .05) (Figure S11). However, there was no statistical difference observed in the urethral secretions between the two groups (Figure S12).
Table 2.
Comparison of α‐diversity results among the groups
| α‐Diversity index | Sequences | Mean ± SD | Mean ± SD | Mean ± SD | Mean ± SD | P‐value |
|---|---|---|---|---|---|---|
| (A. disea) | (A. nor) | (B. disea) | (B. nor) | |||
| Shannon | 16S rRNA | 2.34270 ± 0.86606 | 3.08387 ± 1.06011 | 1.86512 ± 0.91149 | 2.24508 ± 0.56943 | .00258 |
| ITS | 1.53688 ± 1.64732 | 0.67787 ± 0.72904 | 1.14260 ± 0.84047 | 1.02977 ± 0.00000 | .90564 | |
| Simpson | 16S rRNA | 0.25626 ± 0.20864 | 0.16209 ± 0.18342 | 0.34841 ± 0.20854 | 0.25247 ± 0.16038 | .00580 |
| ITS | 0.51862 ± 0.46046 | 0.72142 ± 0.31135 | 0.49228 ± 0.21728 | 0.45105 ± 0.00000 | .86935 |
Note: A. disea, urethra secretion samples from prostatitis patients; A. nor, urethra secretion samples from controls; B. disea, expressed prostatic secretion samples from prostatitis patients; B. nor, expressed prostatic secretion samples from controls.
Abbreviations: ITS, internal transcribed space; SD, standard deviation.
Figure 5.
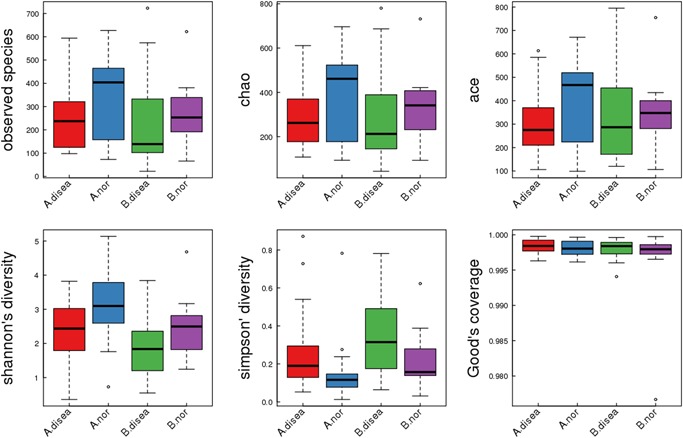
16S rRNA gene α diversity indices boxplot among groups (description) [Color figure can be viewed at http://wileyonlinelibrary.com]
3.6. Cluster analysis of species compositions in different samples
Cluster analysis showed that the species compositions of the two specimens collected from the same subject were quite similar (Figure 6).
Figure 6.
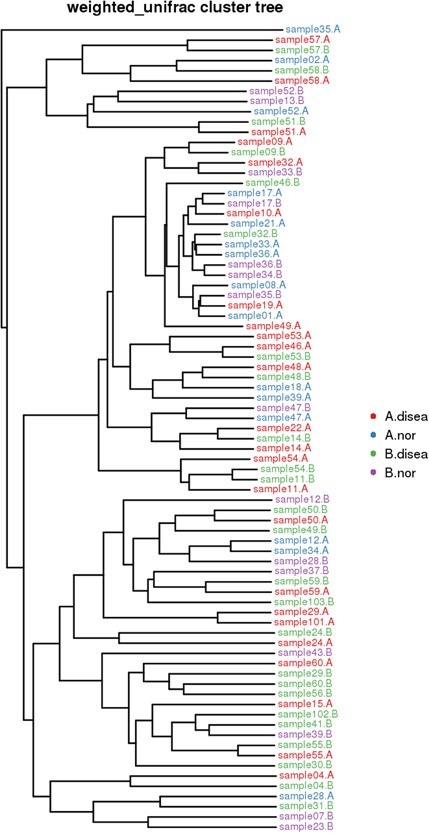
Samples Clustering result (Description, weighted_unifrac). The same color represents the samples in the same group. Short distance between samples represents high similarity. A. disea denotes the urethra secretion samples from the patient group, A. nor denotes the urethra secretion samples from the control group. B. disea denotes the expressed prostatic secretion samples from the patient group, B. nor denotes the expressed prostatic secretion samples from the control group [Color figure can be viewed at http://wileyonlinelibrary.com]
3.7. Significance analysis of intergroup differences
Significance analysis of intergroup differences revealed that 17 bacterial species in the urethral secretions were significantly different between the CP III and control groups (all P < .05). These species were Myroides odoratimimus, A. guillouiae, E. coli, G. vulcani, A. kestanbolensis, C. viridans, Arthrobacter psychrolactophilus, Methylobacterium adhaesivum, S. agalactiae, Flavobacterium frigidarium, Psychrobacter sanguinis, P. veronii, Pseudomonas stutzeri, Clostridium bifermentans, Clostridium perfringens, Morganella morganii, and Brevundimonas diminuta. In addition, 14 bacterial and fungal species in the EPS were significantly different between the CP III and control groups (all P < .05). These species were Stappia indica, E. coli, Clostridium hathewayi, Methylotenera mobilis, Alistipes indistinctus, Crenothrix polyspora, Clostridium bifermentans, Clostridium methylpentosum, Ceriporia lacerata, Fusarium sp. CCN3, Malassezia sp. M9959, Rhodotorula aurantiaca, Sistotremastrum guttuliferum, and Trametes orientalis.
3.8. LEfSe analysis
The LEfSe analysis showed that the microorganisms that were differentially significant in the urethral secretions from healthy men belonged to the family Flavobacteriaceae, order Flavobacteriales, classes Flavobacteriia, Sebacinales, Thelephoraceae, Thelephorales, Basidiobolaceae, Basidiobolales, and Incertae sedis, and that those that were differentially significant in the EPS belonged to Microbacteriaceae, Caulobacteraceae, Caulobacterales, Brucellaceae, Methylobacteriaceae, Rhizobiales, Alphaproteobacteria, Comamonadaceae, Pseudomonadaceae, Xanthomonadaceae, Xanthomonadales, and Tremellomycetes. The microorganisms that were differentially significant in the EPS from patients with CP III were Micrococcaceae (Figure 7) and Nectriaceae (Figure 8).
Figure 7.
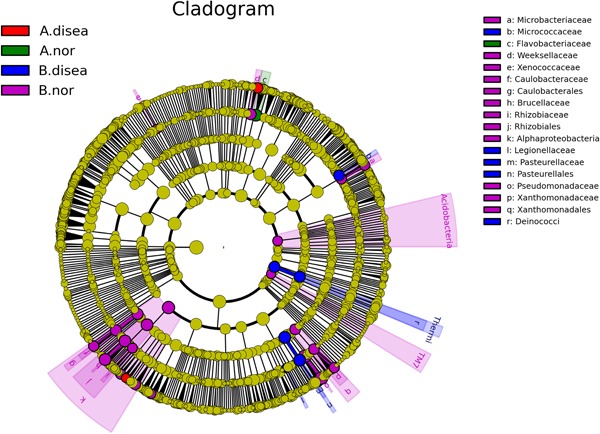
Linear discriminant effect size cluster tree for 16S rRNA analysis. Different colors indicate different groups. Colored notes represent a group, color shading over the notes indicate the significant microbe biomarker in the group causing a significant difference in abundance, and the biomark name is listed in the upper right corner. The yellow notes represent the biomarkers that do not show significant differences in abundance in the groups. A. disea denotes the urethra secretion samples from the patient group, A. nor denotes the urethra secretion samples from the control group. B. disea denotes the expressed prostatic secretion samples from the patient group, B. nor denotes the expressed prostatic secretion samples from the control group [Color figure can be viewed at http://wileyonlinelibrary.com]
Figure 8.
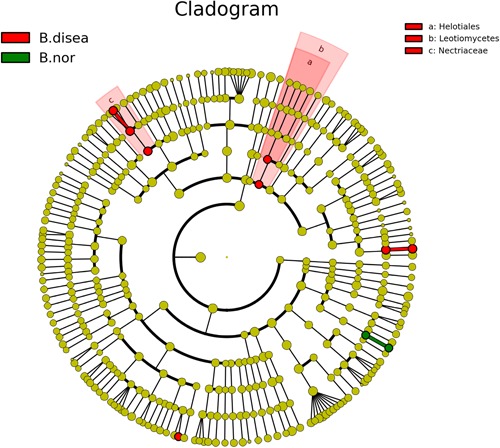
Linear discriminant effect size cluster tree for internal transcribed space sequence analysis. Different colors indicate different groups. Colored notes represent a group, color shading over the notes indicate the significant microbe biomarker in the group causing significant difference in abundance, and the biomark name is listed in the upper right corner. The yellow notes represent the biomarkers that do not show significant differences in abundance in the groups. B. disea denotes the expressed prostatic secretion samples from the patient group, B. nor denotes the expressed prostatic secretion samples from the control group [Color figure can be viewed at http://wileyonlinelibrary.com]
4. DISCUSSION
Prostatitis is the third most common disease of the genitourinary system. Chronic bacterial prostatitis is usually associated with repeated urinary tract infections or recurrent infections of the prostate by the same bacterial strain, while there is no evidence that CPPS is caused by bacteria. 7 , 8 In the present study, we were unable to identify the pathogenic bacteria that cause CP III either.
Propionibacterium acnes was isolated at a higher frequency from prostate tissue samples from patients with prostate cancer than from the control and were the most prevalent microorganism in prostatic tissue. 9 Lee 10 found E. faecalis in three patients with chronic bacterial prostatitis. Our present study showed that P. acnes and Enterococcus existed in both healthy subjects and patients with CP III, and there were no significant differences between the two groups. Therefore, P. acnes and Enterococcus may represent resident microbiota or opportunistic pathogenic bacteria. Irajian et al 11 studied 200 prostate tissue samples and detected seven Ureaplasma urealyticum‐positive cases. Although primary infections may not be the cause of persistent symptoms, some people believe that infection may be a predisposing factor. Many organisms are possible sources of undocumented infections, such as M. hominis, T. vaginalis, Candida species, U. urealyticum, C. trachomatis, herpes simplex virus, and even parasites. Such an infection may serve as an inciting factor rather than the ongoing cause that leads to the development of a clinical syndrome. 2 Jang et al 12 infected the prostates of mice with T. vaginalis and observed pathological changes, mast cell infiltration, and C–C motif chemokine ligand 2 elevation, providing evidence that T. vaginalis causes prostatitis. The detection rates of the above microorganisms were very low in the patients with CP III enrolled in our study. In fact, most of the pathogens were not even detected, confirming that they are not the true pathogens of prostatitis.
Delcaru et al 13 found that uropathogenic E. coli was the most frequent bacterial strain isolated from patients with benign prostatic hyperplasia (BPH), followed by Enterococcus spp., Enterobacter spp., Klebsiella spp., Proteus spp., P. aeruginosa, and Serratia marcescens. Mishra et al 14 isolated 66 strains of pathogenic bacteria from urine cultures of patients with BPH and CP, and the eight most frequently detected were E. coli (31.8%), Klebsiella spp. (28.8%), S. aureus (16.7%), P. aeruginosa (10.6%), Proteus spp., Enterococcus spp., Acinetobacter spp., and Citrobacter spp. Based on these results, E. coli and Klebsiella were the main pathogens among Gram‐negative bacteria, and S. aureus was the main pathogen among Gram‐positive bacteria. 14 We found in the present study that most of the above‐mentioned microorganisms were detected in the urethral secretions of healthy subjects. Therefore, they are not true pathogens of BPH and CP.
Simons et al 15 mimicked a typical prostate infection in men with the retrograde urethral installation of E. coli CP1. Their study confirmed that prostatitis accelerated prostate cancer progression, indicating that inflammation‐induced changes in the microenvironment may accelerate tumor initiation or progression. Our study showed that there were significant differences in the microbiome found in the urethral secretions and EPS between healthy subjects and patients with CP III. According to the results of PCA, there was a notable clustering phenomenon toward the left side of the plot corresponding to the EPS bacterial community structure of the patient group, with only a few on the right, which may have been caused by individual differences. Significance analysis of intergroup differences between the CP III patients and the control group showed a significant difference in the detection frequency of Methylobacterium and Methylotenera mobilis. However, these species are likely contaminants and should be eliminated. Spearman's rank correlation showed a significant positive correlation in the bacterial community structure of urethral secretions and EPS in both the patient group and the control group. Therefore, we believe that there is a considerable correlation between the imbalance of the urinary tract microbiome and CP III. It remains to be elucidated whether CP III is caused by the imbalance in the urinary tract microbiome, which leads to changes in the urethral microenvironment, or by inflammatory stimulation, which induces the secretion of bacteriostatic substances and lysozyme and leads to changes in the urinary tract microbiome.
Regarding α‐diversity analysis, we found that the relative abundance of Veillonella, Atopobium, and Gemella in EPS in the patient group was greater than that in the control group. In contrast, the relative abundance of Arthrobacter, Escherichia, and Novosphingobium was lower in the patient group than in the control group. Among them, Veillonella had the highest relative abundance and displayed the most significant difference in the samples from the patients, indicating that it may be a key species involved in the etiology and/or pathogenesis of CP III. Thus, its significance warrants further study.
Nickel et al 16 believe that the increased risk of CP/CPPS is not associated with inflammation; however, chronic inflammation can predict the risk of aggravation of clinical symptoms in men with confirmed CP/CPPS. Our study found prominent changes in the urinary tract microbiome in CP III patients with significant clinical symptoms compared with that in healthy subjects. Shoskes et al 17 found that the gut microbiome was significantly less diversified and was characterized by lower counts of Prevotella in patients with CPPS than in the control, suggesting that Prevotella isolation might serve as a potential biomarker for CPPS and that the gut microbiome might serve as a potential therapeutic target for CPPS. Our study shows that Prevotella is ubiquitously present in the urinary tract of healthy subjects and patients with CP III. Furthermore, many species of Prevotella exist, indicating that it is not a specific biomarker for CCPS.
Shah et al 18 incidentally found cryptococcosis during a prostate biopsy in a patient with prostate adenocarcinoma. Fungal infections of the prostate are rare and primarily occur in immunocompromised patients. Sutcliffe et al 19 suggested that to screen for fungi in prostate specimens and explore their mechanism of action, future research should consider using rapidly advancing molecular techniques. Therefore, we used high‐throughput next‐generation sequencing technology to detect the gene sequences of all eukaryotic microorganisms in the specimens. Our analysis showed that the fungi that might play an important role in the EPS of patients with CP III belonged to Nectriaceae. Meanwhile, we also noted that considerable amounts and types of fungi were present in the urethra of healthy subjects.
Smelov et al 20 detected large amounts of various viruses in four patients with prostate cancer, including Merkel cell polyomavirus, John Cunningham polyomavirus, and human papillomavirus. They believed that the understanding of the biology of the prostate may be advanced through the detection of metagenomic sequences of DNA viruses in cells shed from the prostate and into EPS. Our present high‐throughput sequencing analysis did not cover noncellular microbes potentially present in the samples. As the true pathogens of CP III remain to be discovered, future research may attempt to evaluate noncellular microbes.
Our intergroup difference and LEfSe analyses revealed that Flavobacteriaceae, Pseudomonadaceae, Micrococcaceae, Microbacteriaceae, Caulobacteraceae, Brucellaceae, Rhizobiales, Alphaproteobacteria, Xanthomonadaceae, Helotiales, Leotiomycetes, and Nectriaceae might play critical roles in the balance of the urinary tract microbiome and might correlate, to a certain extent, with CP III. Because Methylobacteriaceae and Rhizobiales are known bacterial contaminants, these two species must be excluded. UPGMA cluster analysis, PCA, and Spearman's rank correlation showed that the microbial compositions of the urethral secretions and EPS collected from the same subject were essentially the same. We speculate that the EPS may be free from bacteria before and after infection. The bacteria detected in the EPS may be the resident microbiota or opportunistic pathogenic bacteria of the urethra, which contaminated the EPS as it passed through the urethra, rather than pathogenic bacteria in the prostate. They may also be microorganisms from the external surface of the prostate gland.
5. CONCLUSIONS
No potential pathogens were identified in diagnosed patients with CP III. The EPS may be free from bacteria before and after infection. Changes in the urinary tract microbiome may disrupt the microecological balance of the urinary system, thereby leading to CP III. Conversely, the true pathogens of CP III may not be prokaryotic or eukaryotic microorganisms. Future research may involve the evaluation of noncellular microbes.
CONFLICT OF INTERESTS
The authors declare that there are no conflict of interests.
Supporting information
Supporting information
Supporting information
Supporting information
Supporting information
Supporting information
Supporting information
Supporting information
Supporting information
Supporting information
Supporting information
Supporting information
Supporting information
ACKNOWLEDGMENTS
The authors are grateful to Shenzhen Seventh People's Hospital Uropoiesis Surgical Department director Xianwen Li and Dr. Fengsheng Yang for their help. The authors thank Lu Gao in BGI (Shenzhen, China) for the data analysis. The authors thank Editage for polishing the language of this manuscript. The authors are grateful to Shenzhen Yantian District Science and Technology Innovation Bureau for the fund support (No. 20160202).
Wu Y, Jiang H, Tan M, Lu X. Screening for chronic prostatitis pathogens using high‐throughput next‐generation sequencing. The Prostate. 2020;80:577–587. 10.1002/pros.23971
REFERENCES
- 1. Rees J, Abrahams M, Doble A, Cooper A. Diagnosis and treatment of chronic bacterial prostatitis and chronic prostatitis/chronic pelvic pain syndrome: a consensus guideline. BJU Int. 2015;116:509‐525. [DOI] [PMC free article] [PubMed] [Google Scholar]
- 2. Arora HC, Eng C, Shoskes DA. Gut microbiome and chronic prostatitis/chronic pelvic pain syndrome. Ann Transl Med. 2017;5:30. [DOI] [PMC free article] [PubMed] [Google Scholar]
- 3. Videčnik ZJ, Matičič M, Jeverica S, et al. Diagnosis and treatment of bacterial prostatitis. Acta Dermatovenerol Alp Pannonica Adriat. 2015;24:25‐29. [DOI] [PubMed] [Google Scholar]
- 4. Krieger JN, Thumbikat P. Bacterial prostatitis: bacterial virulence, clinical outcomes, and new directions. Microbiol Spectr. 2016;4, 10.1128/microbiolspec.UTI-0004-2012 [DOI] [PubMed] [Google Scholar]
- 5. Heras CV, Gutiérrez SB, Serrano GML, et al. [Chronic bacterial prostatitis. Clinical and microbiological study of 332 cases] Med Clin (Barc). 147, 2016:144‐147. [DOI] [PubMed] [Google Scholar]
- 6. Papeš D, Pasini M, Jerončić A, et al. Detection of sexually transmitted pathogens in patients with chronic prostatitis/chronic pelvic pain: a prospective clinical study. Int J STD AIDS. 2017;28:613‐615. [DOI] [PubMed] [Google Scholar]
- 7. Khan FU, Ihsan AU, Khan HU, et al. Comprehensive overview of prostatitis. Biomed Pharmacother. 2017;94:1064‐1076. [DOI] [PubMed] [Google Scholar]
- 8. Bowen DK, Dielubanza E, Schaeffer AJ. Chronic bacterial prostatitis and chronic pelvic pain syndrome. BMJ Clin Evid. 2015;1802. 1802. [PMC free article] [PubMed] [Google Scholar]
- 9. Davidsson S, Mölling P, Rider JR, et al. Frequency and typing of Propionibacterium acnes in prostate tissue obtained from men with and without prostate cancer. Infect Agent Cancer. 2016;11:26. [DOI] [PMC free article] [PubMed] [Google Scholar]
- 10. Lee G. Chronic prostatitis: a possible cause of hematospermia. World J Mens Health. 2015;33:103‐108. [DOI] [PMC free article] [PubMed] [Google Scholar]
- 11. Irajian G, Sharifi M, Mirkalantari S, Mirnejad R, Jalali Nadoushan MR, Ghorbanpour N. Molecular detection of Ureaplasma urealyticum from prostate tissues using PCR‐RFLP, Tehran, Iran. Iran J Pathol. 2016;11:138‐143. [PMC free article] [PubMed] [Google Scholar]
- 12. Jang KS, Han IH, Lee SJ, et al. Experimental rat prostatitis caused by Trichomonas vaginalis infection. Prostate. 2019;79:379‐389. [DOI] [PubMed] [Google Scholar]
- 13. Delcaru C, Podgoreanu P, Alexandru I, et al. Antibiotic resistance and virulence phenotypes of recent bacterial strains isolated from urinary tract infections in elderly patients with prostatic disease. Pathogens. 2017;6:E22. [DOI] [PMC free article] [PubMed] [Google Scholar]
- 14. Mishra PP, Prakash V, Singh K, Mog H, Agarwal S. Bacteriological profile of isolates from urine samples in patients of benign prostatic hyperplasia and or prostatitis showing lower urinary tract symptoms. J Clin Diagn Res. 2016;10:DC16‐DC18. [DOI] [PMC free article] [PubMed] [Google Scholar]
- 15. Simons BW, Durham NM, Bruno TC, et al. A human prostatic bacterial isolate alters the prostatic microenvironment and accelerates prostate cancer progression. J Pathol. 2015;235:478‐489. [DOI] [PMC free article] [PubMed] [Google Scholar]
- 16. Nickel JC, Freedland SJ, Castro‐Santamaria R, Moreira DM. Chronic prostate inflammation predicts symptom progression in patients with chronic prostatitis/chronic pelvic pain. J Urol. 2017;198:122‐128. [DOI] [PubMed] [Google Scholar]
- 17. Shoskes DA, Wang H, Polackwich AS, Tucky B, Altemus J, Eng C. Analysis of gut microbiome reveals significant differences between men with chronic prostatitis/chronic pelvic pain syndrome and controls. J Urol. 2016;196:435‐441. [DOI] [PubMed] [Google Scholar]
- 18. Shah SI, Bui H, Velasco N, Rungta S. Incidental finding of Cryptococcus on prostate biopsy for prostate adenocarcinoma following cardiac transplant: case report and review of the literature. Am J Case Rep. 2017;18:1171‐1180. [DOI] [PMC free article] [PubMed] [Google Scholar]
- 19. Sutcliffe S, De Marzo AM, Sfanos KS, Laurence M. MSMB variation and prostate cancer risk: clues towards a possible fungal etiology. Prostate. 2014;74:569‐578. [DOI] [PMC free article] [PubMed] [Google Scholar]
- 20. Smelov V, Bzhalava D, Arroyo Mühr LS, et al. Detection of DNA viruses in prostate cancer. Sci Rep. 2016;6:25235. [DOI] [PMC free article] [PubMed] [Google Scholar]
Associated Data
This section collects any data citations, data availability statements, or supplementary materials included in this article.
Supplementary Materials
Supporting information
Supporting information
Supporting information
Supporting information
Supporting information
Supporting information
Supporting information
Supporting information
Supporting information
Supporting information
Supporting information
Supporting information


