

Abstract
A variety of enzymes can be easily incorporated and overexpressed within Escherichia coli cells by plasmids, making it an ideal chassis for bioelectrosynthesis. It has recently been demonstrated that microbial electrosynthesis (MES) of chiral alcohols is possible by using genetically modified E. coli with plasmid‐incorporated and overexpressed enzymes and methyl viologen as mediator for electron transfer. This model system, using NADPH‐dependent alcohol dehydrogenase from Lactobacillus brevis to convert acetophenone into (R)‐1‐phenylethanol, is assessed by using a design of experiment (DoE) approach. Process optimization is achieved with a 2.4‐fold increased yield of 94±7 %, a 3.9‐fold increased reaction rate of 324±67 μm h−1, and a coulombic efficiency of up to 68±7 %, while maintaining an excellent enantioselectivity of >99 %. Subsequent scale‐up to 1 L by using electrobioreactors under batch and fed‐batch conditions increases the titer of (R)‐1‐phenylethanol to 12.8±2.0 mm and paves the way to further develop E. coli into a universal chassis for MES in a standard biotechnological process environment.
Keywords: biocatalysis, cofactors, electrochemistry, enantioselectivity, microbial electrosynthesis
Powered up to implementation: Design of experiments and response surface methodology boosts the yields and efficiency of the enantioselective microbial electrosynthesis of (R)‐1‐phenylethanol by using resting Escherichia coli. Subsequent scale‐up to a 1 L electrobioreactor system, as well as fed‐batch operation, is a further important step towards commercial application.

Introduction
The increasing availability of renewable electric energy from intermittent sources such as wind turbines and solar panels is driving the development of Power‐to‐X technologies.1 Electrobiotechnology constitutes a platform for Power‐to‐Chemicals, which stores inexpensive/excess electrical energy in chemical bonds by combining electrochemistry and biotechnology and offers a plethora of applications.2 Among these, microbial electrosynthesis (MES) that uses microorganisms as bio(electro)catalysts targets the production of fine and bulk chemicals as demonstrated for, for example, acetic acid, 1,3‐propanediol, and α‐humulene.3, 4, 5 Recently, we described a universal chassis for the enantioselective MES of chiral alcohols from cheap ketones by using resting Escherichia coli whole‐cell biocatalysts (Figure 1).6
Figure 1.
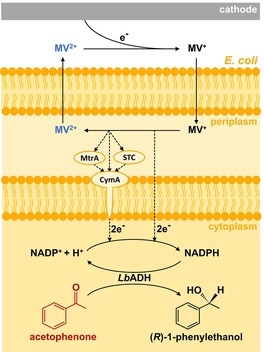
Microbial electrosynthesis of chiral alcohols by using resting E. coli: The enantioselective reduction of acetophenone to (R)‐1‐phenylethanol takes place in the cytoplasm via the alcohol dehydrogenase from Lactobacillus brevis (LbADH) using NADPH. The cytoplasmatic NADPH pool is linked to the cathode by extracellular electron transfer through methyl viologen (MV) as mediator and putatively the heterologous proteins MtrA, STC, and CymA. The factors examined by the design of experiments approach in this study are highlighted in color, namely concentrations of acetophenone in red, MV in blue, and E. coli cells in orange.
E. coli is an ideal biocatalytic chassis for the production of a variety of chiral alcohols and other fine chemicals, as various enzymes can be easily incorporated and overexpressed by plasmids.7, 8, 9 The successful genetic incorporation of extracellular electron transfer (EET) proteins like c‐type cytochromes from Shewanella oneidensis for enhanced electroactivity renders E. coli excellent for MES.10, 11, 12 In particular, the utilized E. coli strain JG622 LbADH expresses cytochromes MtrA, CymA, and STC from S. oneidensis for EET, heme exporter proteins ccmA‐H for cytochrome maturation, as well as an alcohol dehydrogenase from Lactobacillus brevis (LbADH).6, 13, 14, 15 LbADH is a NADPH‐dependent oxidoreductase, which catalyzes the enantioselective reduction of bulky ketones to (R)‐alcohols.15 As a proof of concept, we showed the successful MES of the chiral alcohol (R)‐1‐phenylethanol from acetophenone by using methyl viologen (MV) as mediator for electron transfer for NADPH‐regeneration with maximum yields of 39.4±5.7 % at a coulombic efficiency (CE) of 50.5±6.0 % with an enantiomeric excess >99 % at a reaction rate of 83.5±13.9 μm h−1. Further investigation of oxic and anoxic expression conditions, as well as different concentrations of methyl viologen gave the first hints about the parameters influencing rate and yield.6
To optimize MES, explorative statistical methods, for example, design of experiments (DoE), may be used. These have been successfully applied in other fields of biosynthesis, for example, for optimization of fermentation media16 and operating conditions of complex bioreaction systems.17, 18 DoE serves to systematically study the effect of various operating variables, termed factors, and their interactions on one or several process performance metrics, termed responses, by using a minimum number of statistically planned experiments. Although microbial fuel cells (MFCs) have been intensively studied by statistical methods,19, 20, 21, 22, 23, 24 we are only aware of one DoE study in the vicinity of MES.25 Here, with the aid of a DoE approach, Sydow et al. optimized a minimal medium for the electroautotrophic growth of Cupriavidus necator.25
MES is mainly performed in lab‐scale reactors, most often using H‐cell reactors, which are comprised of two glass chambers connected by flanges and separated by an ion exchange membrane to preserve an ionic connection. Owing to this construction, transport near and through the membrane is often insufficient, resulting in high internal resistance, and scale‐up to the pilot‐ or industrial‐scale cannot currently be performed.26 To overcome these limitations, various types of two‐chamber bioelectrochemical reactors have been developed, and empirical scale‐up strategies have been applied.27, 28, 29 However, thus far, mostly microbial electrolysis (MEC) and MFCs were scaled‐up to pilot‐ or even industrial‐scale, but to our knowledge there is only one example of the MES process using pure cultures.30 Enzmann et al. developed a two‐chamber bubble column reactor (1 L working volume) derived from a MFC, which was used for the production of methane by MES using Methanococcus maripaludis.30 This lack of scaled‐up examples of MES using pure cultures can be attributed to the fact that most of them still have to be further optimized to secure economical scale‐up.31
Beyond DoE, another important strategy for optimizing microbial biosynthesis processes is the feeding strategy. Fed‐batch processes, where substrates are supplied to the bioreactor during operation, may prevent side product formation, limit negative effects of substrate inhibition, as well as enable a precise control of the process parameters, such as the growth rate.32 Several MFC as well as MES processes have already been described to benefit from these advantages.33, 34, 35
MES using resting E. coli whole‐cell biocatalysts is a promising approach for the production of chiral alcohols.6 However, the overall performance of this system in terms of yield (Y), total coulombic efficiency (CEt), and rate (r) is currently inferior to enzymatic electrosynthesis.36 To gain a better understanding of the system and subsequently enhance the key performance indicators (Y, CEt, r) by process engineering approaches, this study aimed at optimizing the above‐described E. coli‐based model reaction system by a DoE approach. To overcome limitations resulting from the reactor set‐up and to narrow the gap to application, the process performance in 1 L electrobioreactors was assessed, and fed‐batch operation investigated.
Results and Discussion
Statistical design of experiments for optimization of reaction conditions
During proof‐of‐concept, we revealed that the performance of the methyl viologen mediated microbial electrosynthesis of (R)‐1‐phenylethanol using E. coli‐whole cell biocatalysts in H‐cell reactors is strongly influenced by the mediator concentration, whereas the electrode surface area seemed not to be a limiting factor.6 Further influencing factors might be the concentration of the substrate acetophenone, as well as the bio(electro)catalyst, that is, the concentrations of enzyme and NADP+/NADPH and consequently cells. The overexpression of the enzyme LbADH, as well as the cytochromes MtrA, STC, and CymA in the E. coli cells was confirmed by SDS‐page (sodium dodecyl sulfate–polyacrylamide gel electrophoresis; see the Supporting Information, Section A10). The NAD(P)H content was investigated by their intrinsic fluorescence (see the Supporting Information, Section A11).
To investigate the impact of these factors on the responses Y, r, and total coulombic efficiency (CEt; see the Supporting Information, Section A3), experiments were planned by using a DoE approach (see the Experimental Section for details). DoE resulted in nine experiments without replicates (n=1) with acetophenone concentrations of 5 mm, 15 mm, and 25 mm limited by its solubility, methyl viologen concentrations of 0.5 mm, 2.75 mm, and 5 mm limited by its toxicity, and E. coli JG622_LbADH concentrations of 2 g L−1, 6 g L−1, and 10 g L−1. Two additional experimental sets with replicates were chosen for model validation (n=2; n=3; see the Supporting Information, Table S1). All of these experiments were performed in 250 mL H‐cell reactors at 21 °C.
The corresponding reaction progress curves, that is, the concentrations of substrate and product over time, and chronoamperograms are shown in Figures S5–S7. The data has been analyzed for Y, r, and CEt. Throughout all experiments, (R)‐1‐phenylethanol formation finished before full conversion of acetophenone between 15 and 100 h. The initially high cathodic current densities decreased along with the slowdown of the reaction rate.
Response surface methodology allows analysis of the relationships between operating factors and one or more responses. The surface response plots in Figure 2 show how the factors concentrations of acetophenone and methyl viologen, as well as cell concentration, affect the responses Y, r, and CEt of the MES. It is worth mentioning that the enantiomeric excess (ee) exceeded 99 % in all cases. Y was determined by the highest measured (R)‐1‐phenylethanol concentration in each experiment (see the Supporting Information, Section A2). The regression analysis of the experimental Y with a non‐linear polynomial regression model (see the Supporting Information, Section A6) provides an excellent model fit (R 2=0.98) and precise prediction (Q 2=0.95). Within the stipulated conditions, Y appears to be exclusively determined by concentrations of acetophenone and cells, not by changes in concentration of methyl viologen. The highest Y of 90.2 % was achieved at the highest cell concentration of 10 g L−1 but at the lowest acetophenone concentration of 5 mm. The negative effect of increasing acetophenone concentration on Y could suggest that too high acetophenone concentration or increasing concentration of the product (R)‐1‐phenylethanol are limiting. As acetophenone is hydrophobic, damage, for example, to the cell membrane is likely.37 Based on these response surface plots, we concluded that the methyl viologen concentration was not limiting Y, underlining the effective constant regeneration by the cathode.
Figure 2.
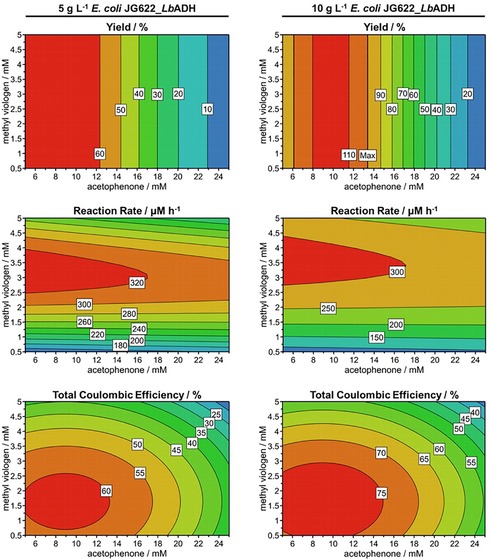
Response surface plots illustrating the relationship between the factors concentrations of methyl viologen and acetophenone at two different E. coli JG622_LbADH cell concentrations (5 g L−1 and 10 g L−1) for the responses yield, reaction rate, and total coulombic efficiency. Red: high values, blue: low values. The underlying data set is provided in Table S1.
The reaction rate, r, describes how fast the substrate acetophenone was converted into the product (R)‐1‐phenylethanol (see the Supporting Information, Section A2). The regression analysis of the experimental r with a non‐linear polynomial regression model (see the Supporting Information, Section A6) provides an excellent model fit (R 2=0.99) and a good prediction (Q 2=0.85). In contrast to Y, r seems to be affected mostly by the concentrations of methyl viologen and cells. The highest r of 341.3 μm h−1 and 275.0 μm h−1 were observed at medium to high methyl viologen concentration (2.75 mm and 5 mm) and high cell concentration (6 g L−1 and 10 g L−1). The positive effect of high cell concentrations could be expected, as these serve as bio(electro)catalysts harboring high LbADH and NADP+/NADPH concentrations. The fact that a low methyl viologen concentration has a negative effect on r, could suggest that its transfer from the medium into the cytoplasm and/or the transfer of electrons from methyl viologen to NADP+ is rate limiting. Unfortunately, it still needs to be deciphered how the electrons are transferred exactly at the subcellular level.38 Besides the incorporated cytochromes from Shewanella oneidensis in the utilized E. coli strain JG622, oxidoreductases like nitrate reductases or alcohol dehydrogenases within the periplasm might be responsible for transferring the electrons from methyl viologen onto NADP+ for NADPH regeneration.13 The cathode solution turns violet within the first 5 min and stays violet for the whole duration of the experiment, showing that there is enough reduced methyl viologen in the system for the duration of the experiment. Hence, in line with our proof‐of‐concept study, methyl viologen regeneration at the cathode can be excluded as a rate‐limiting step.
CEt is a measure of the electron yield in the product (see the Supporting Information, Section A3). The regression analysis of CEt with a non‐linear polynomial regression model (see the Supporting Information, Section A6) provides a reasonable model fit (R 2=0.86) and prediction (Q 2=0.79). CEt is affected by all three investigated factors. Although high cell concentration has a positive effect, increasing methyl viologen and acetophenone concentrations affect the CEt negatively. However, oxygen most likely has the biggest influence on CEt. Oxygen intake, for example, during sampling is visible as an increase in current density in the chronoamperograms (Figures S5–S7). As oxygen is an excellent electron acceptor, one may assume that it is reduced to hydrogen peroxide (H2O2) at the cathode at the applied potential or by the produced methyl viologen cation radicals.39, 40 As CEt is the quotient of the theoretical and actual consumed charge, the increase of actual consumed charge owing to oxygen reduction has a negative impact on this measure.
Utilizing the collected data from the response surface methodology, we predicted optimal reaction conditions to maximize the three examined performance parameters Y, r, and CEt. As industrial processes are often benchmarked on their productivity, special focus was set on optimizing r. The reaction conditions that are optimal for the highest r were predicted by DoE to be 7.58 mm acetophenone, 3.26 mm methyl viologen, and 8.97 g L−1 E. coli cells, which should lead to a r of 342.5 μm h−1, a Y of 98.4 %, and a CEt of 69.7 %. Experiments were performed in triplicate to verify the predicted optimal conditions (Figure 4 A). Figure 3 A illustrates the resulting CEt of 68.4±7.3 %, Y of 94.1±6.9 %, and r of 324.4±66.8 μm h−1 in relation to the prediction. The experimentally achieved results match the prediction almost perfectly (only a deviation of 2–6 %), confirming the excellent prediction precision. It needs to be stressed that the DoE optimization resulted in a 2.4‐fold increased Y and a 3.9‐fold increased r in comparison to the non‐optimized conditions.6
Figure 4.
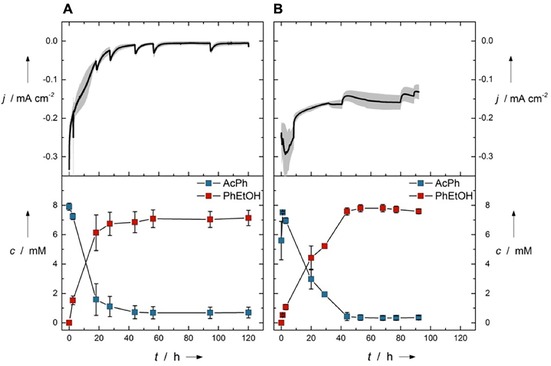
Chronoamperograms and acetophenone (AcPh) and (R)‐1‐phenylethanol (PhEtOH) concentrations in A) 250 mL H‐cell reactor and B) 1 L electrobioreactor. Conditions: 7.58 mm acetophenone, 3.26 mm methyl viologen, 8.97 g L−1 E. coli JG622 LbADH, TEA buffer (pH 7.5), −0.7 V. Values are average±standard deviation, calculated from three independent biological replicates (n=3).
Figure 3.
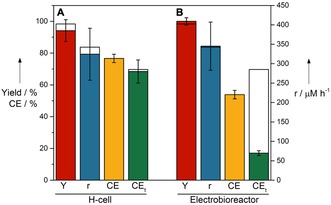
Predicted (white) and actual (color filled) values of the optimized batch reaction in A) 250 mL H‐cell reactors (n=3) and B) in the 1 L electrobioreactor (n=2). Conditions: 7.58 mm acetophenone, 3.26 mm methyl viologen, 8.97 g L−1 E. coli JG622_LbADH, TEA buffer (pH 7.5), −0.7 V. Yield (Y): red; reaction rate (r): blue; coulombic efficiency (CE): yellow; total coulombic efficiency (CEt): green (see the Supporting Information, Section A3 for CE and CEt calculation details). Values are average±standard deviation (±range in the electrobioreactor case), calculated from independent biological replicates.
Upscaling to 1 L electrobioreactors
For H‐cell reactors, scale‐up is limited, but for transfer of MES to industrial production processes a scalable reaction system is necessary that fits into a biotechnological process environment. To this end, we recently introduced an upgrade kit to turn conventional bioreactors into electrobioreactors, which enable standard process engineering and can be scaled systematically.29, 41, 42 Utilizing the 1 L electrobioreactors as a platform, combined with the results and information derived from the DoE optimization, MES of (R)‐1‐phenylethanol was performed. Figure 4 shows the resulting averaged chronoamperograms as well as the concentration profiles of acetophenone and (R)‐1‐phenylethanol by using the 250 mL H‐cell reactors and 1 L electrobioreactors, respectively. The resulting Y, r, CEt, and CE of the MES in the electrobioreactor are shown in Figure 3 B. It can be seen that Y (100±2.3 %) and r (372.2±62.2 μm h−1) achieved in the electrobioreactors are superior to those obtained in the H‐cell reactors (Y=85.0±2.1 % and r=308.0±18.4 μm h−1), which is possibly due to an enhanced mass transfer. When using the optimized conditions, however, the CEt is inferior in the electrobioreactors compared with the H‐cell reactors (CEt=17.0±1.5 % vs. CEt=53.9±2.7 %). The drop of CEt to 17 % in the bioelectroreactors was surprising. When comparing the CE only in the interval of product formation (which is of interest for future bioproduction), the H‐cell reactors still show a higher CE than the bioelectroreactors (76.7±2.6 % vs. 53.2±7.5 %), but the drop is not as pronounced (please see Supporting Information Section A3 for the definition of CE). The differences in CE and CEt in H‐cell reactors is negligible, which is not the case for the electrobioreactors. This is due to higher amounts of oxygen infiltrating into the scaled‐up systems (see the Supporting Information, Section A9). Although the H‐cell reactors are strictly gastight and oxygen inflow only happens during sampling, the electrobioreactors are not as gastight owing to the overhead space at the top of the reactors, where a high number of sampling/sensor ports are connected, which are needed for process monitoring and future process control. Also, owing to the high vapor pressure of both acetophenone and (R)‐1‐phenylethanol, the 1 L reactors were run closed, without sparging of nitrogen gas, not even in the overhead space, to minimize substrate and product losses, which in turn amplified the oxygen intrusion problem (see the Supporting Information, Section A9). Nevertheless, the results illustrate the suitability of the electrobioreactor for successful scaling‐up MES using resting E. coli cells.
Fed‐batch microbial electrosynthesis
The response surface plots from the DoE experiments (Figure 2) suggested a possible negative effect of high concentrations of acetophenone and/or (R)‐1‐phenylethanol on Y. To mitigate the potentially negative effects of the substrate acetophenone and simultaneously enhance Y, fed‐batch experiments were set up in 1 L electrobioreactors. The feeding rate of acetophenone was set in accordance with the observed reaction rate under optimized conditions to 370 μm h−1, to keep the acetophenone concentration in the electrobioreactor low.
Figure 5 shows the concentration progress of acetophenone and (R)‐1‐phenylethanol (Figure 5 A) as well as the chronoamperogram during the fed‐batch MES (Figure 5 B). Thereby, the r of 303.7±74.9 μm h−1 is slightly lower than the r observed during the batch experiment, which was to be expected as it is limited by the acetophenone feed (370 μm h−1). The production of (R)‐1‐phenylethanol stagnates after approximately 40 h, resulting in an absolute titer of 12.8±2.0 mm, which is higher in comparison to the 7.6±0.2 mm achieved in the batch process. CEs of the fed‐batch and batch MES in the electrobioreactor were 63.3±12.2 % and 53.9±2.7 %, respectively (please also refer to Supporting Information Section A9). The overall results indicate that feeding of acetophenone and hence keeping its concentration low had a positive impact.
Figure 5.

A) Chronoamperogram, B) concentration of acetophenone and (R)‐1‐phenylethanol, as well as C) the concentration of proteins in the supernatant over time during the fed‐batch microbial electrosynthesis. Acetophenone starting concentration: 0.37 mm; feeding rate of acetophenone: 370 μm h−1; 3.26 mm methyl viologen, 8.97 g L−1 E. coli JG622_LbADH, TEA buffer (pH 7.5), −0.7 V. Yellow points: experimental substrate mass balance; dotted line: theoretical mass balance based on substrate feeding rate. Values are average±standard deviation, calculated from three independent biological replicates (n=3).
However, product formation stagnates after approximately 40 h. To elucidate the reasons for this stagnation, we investigated other possible scenarios for this occurrence: potential cathode‐mediated side reactions as well as potential solvent effects of the substrate and product. Of note, CE remains relatively low in the 1 L reactors, owing to high background currents. Oxygen is an excellent electron acceptor and can be reduced to water or to hydrogen peroxide with or without the cross‐reaction with methyl viologen cation radicals39, 40, 43 at the applied cathodic potentials. High hydrogen peroxide formation and related cell damage could explain the stagnation of product formation.44 Controls regarding hydrogen peroxide formation showed minimal hydrogen peroxide accumulation in both H‐cells and 1 L electrobioreactors (maximum 0.08 mm and 0.06 mm, respectively). Thus, these cannot be correlated to the very high background currents measured in the 1 L electrobioreactors. Here, we speculate that the low measured H2O2 concentrations, even in the occurrence of high peroxide formation rates, can be assigned to its quick degradation inside the reactor to water or cross‐reaction with triethanolamine from the buffer.45
As the pH is also important for the enzymatic reaction, a control fed‐batch experiment with on‐line pH measurement and one with pH control were performed. Both experiments demonstrated a slight change in pH during the course of the experiment, which we could not correlate with a negative effect on the product formation (Figure S11).
As already shown above, a reduced concentration of acetophenone improved the productivity. As organic solvents can have a destabilizing effect on cell membranes,46 the cell membrane of E. coli might get harmed when acetophenone enters the cell, which could eventually lead to cell membrane disruption and thus, cell lysis. Determination of the protein concentration (Figure 5 C) in the reaction medium suggests complete cell lysis after approximately 40 h, which is in agreement with no observable colony forming units (CFU) on antibiotic‐LB‐agar plates after this duration (data not shown).47 To further investigate the reasons for cell lysis and to determine the possible product inhibition, a batch experiment starting with 7.58 mm (R)‐1‐phenylethanol in addition to the usual 7.58 mm acetophenone, 3.26 mm methyl viologen, and 8.97 g L−1 E. coli cells was performed. The results of these control experiments showed no significant negative impact of (R)‐1‐phenylethanol formation at this already high concentration (Figure S10). We further confirmed the electrochemical reversibility of the mediator for the used conditions by using cyclic voltammetry (Figure S13).
To overcome limitations of the reaction system owing to cell lysis, integration of membrane porins as OprF from Pseudomonas aeruginosa might facilitate the passage of the substrate acetophenone, the product (R)‐1‐phenylethanol, and methyl viologen and, thereby, reduce cell stress.48, 49 Further, addition of a carbon source for cell maintenance might also be an option to consider,50 although this needs a delicate adjustment so as not to sacrifice product purity. Furthermore, comprehensive analysis and engineering of the bio(electro)catalyst, for example, in regards to the electron transfer mechanism might give insights for future improvements.
Nevertheless, the overall mass balance, which considers only the conversion of acetophenone into (R)‐1‐phenylethanol, closes perfectly (100 %) despite that both acetophenone and (R)‐1‐phenylethanol are highly volatile (Figure 5 B). Further, the anoxic reaction system, which is sensitive to oxygen, does not seem to be impacted by the addition of the feeding system. This is, for instance, evident from the constant deep‐violet coloring, as well as from the chronoamperograms (Figure 5 A), where the final background current density remained at a similar level (ca. −0.15 mA cm−2). This further underlines the excellent suitability of the electrobioreactor for the purpose of fed‐batch MES.
Conclusions
MES of the chiral alcohol (R)‐1‐phenylethanol was improved in terms of r, Y, and CEt as a function of the concentrations of mediator, cells, and substrate by a DoE approach. The complex interactions between the investigated factors enabled the optimization resulting in a Y value of up to 94.1±6.9 %, r of 324.4±66.8 μm h−1, and CEt of 68.4±7.3 %, while maintaining an excellent ee of >99 %. Subsequent scale‐up from a 250 mL H‐cell reactor to a 1 L electrobioreactor was successful and resulted in an increased Y (100.0±2.3 %) and r (372.2±62.15 μm h−1), while maintaining a high CE (53.9±2.7 %). Further, we were able to increase the overall product titer from 7.6±0.2 mm to 12.8±2.0 mm by establishing a fed‐batch process. Performing MES of a high‐value product at 1 L scale, a size already of relevance as a starting point for transfer to industrial application, is demonstrated for the first time.
To overcome limitations of the bio(electro)catalyst owing to cell lysis, integration of membrane porins as OprF from Pseudomonas aeruginosa 48 or addition of glucose as a carbon source for cell maintenance might be options to consider. As acetophenone is highly hydrophobic, alternative substrates might not have the same impact on the cell membrane. Nevertheless, a nearly perfect mass balance illustrates the potential of utilizing 1 L electrobioreactors for fed‐batch controlled MES reactions.
We are confident that this work paves the way to further develop E. coli as a universal chassis for MES of chiral building blocks in a biotechnologically relevant process environment and using a scalable reactor platform. This includes, for instance, the asymmetric reduction of imines or the design of multi‐enzymatic cascades within the E. coli whole cell chassis involving the expensive NAD(P)H cofactor.51, 52
Experimental Section
Chemicals, electrode potentials, plasmids, and bacterial strains
All chemicals were of at least analytical grade and were obtained from Sigma–Aldrich (Deisenhofen, Germany), Carl‐Roth GmbH & Co.KG (Karlsruhe, Germany), or VWR International GmbH (Darmstadt, Germany). For preparation of all solutions, de‐ionized water (Millipore, Darmstadt, Germany) was used.
All potentials provided in this study refer to the Ag/AgCl sat. KCl reference electrode (+197 mV vs. standard hydrogen electrode, SHE).
Escherichia coli JG622 strain was used for all experiments. The E. coli strain JG622 (genotype: E. coli DH5αZ1 frd:Ptet cymA mtrA; attP21:pAH95_kanR_Para stc) containing pEC86 plasmid for cytochrome maturation was kindly provided by the Institute for Applied Biology, Department of Applied Biology (Prof. Dr. J. Gescher), Karlsruhe Institute of Technology (Karlsruhe, Germany).13
A pASK‐IBA5plus plasmid encoding LbADH with C‐terminal strep‐tag was kindly provided by the Department of Chemistry, Organic, and Bioorganic Chemistry (Prof. Dr. W. Kroutil), University of Graz (Graz, Austria).
Design of experiments
Design of experiments (DoE) was performed by using the Umetrics MODDE Pro 12.1 software (Sartorius Stedim Data Analytics AB, Göttingen, Germany). Analysis of variance (ANOVA) was used to analyze the model fit. In particular, the coefficient of determination (R 2) and the estimate of future prediction precision (Q 2) were used to assess the quality of the model fit to the measured data.53
A two‐level full factorial design matrix was determined by MODDE Pro software. Response surface methodology was used to investigate the influence of three independent factors (concentration of methyl viologen, acetophenone, and E. coli cells) on the response parameters Y (max=100 %), CEt (max=100 %), and r (no maximum). The operational windows were determined in accordance with the toxicity of methyl viologen (LD50 oral, rat: 100 mg kg−1) and water solubility of acetophenone (38 mm at 25 °C) and were set to: 0.5–5.0 mm for methyl viologen, 5–25 mm acetophenone, and 2–10 g L−1 E. coli cells.54, 55 A two‐level full factorial design matrix was complemented by one center point experiment to investigate the influences of the aforementioned factors on the response parameters. This results in eight boundary point experiments with one central experiment (Table S1). All experiments were performed by using E. coli JG622_LbADH in 250 mL H‐cell reactors by using TEA buffer (triethanolamine, pH 7.5) at an applied working potential of −0.7 V provided like all potentials in this article vs. Ag/ AgCl sat. KCl (being 0.197 V vs. SHE).
Biocatalyst preparation
Glycerol stocks (30 % v/v glycerol in LB medium (10 g L−1 tryptone, 5 g L−1 yeast extract, 5 g L−1 NaCl)) were used for storage at −80 °C and inoculation of the JG622 strain containing pASK‐IBA5plus plasmid encoding LbADH. JG622 was always cultivated in LB medium containing 100 μg mL−1 ampicillin, 30 μg mL−1 chloramphenicol, and 10 μg mL−1 kanamycin, and sterile cultivation conditions were applied.6
Inoculation train for cultivation of E. coli JG622
The conditions of E. coli JG622 cultivation differ slightly for subsequent MES in either H‐cell reactors or electrobioreactors. To increase readability, the conditions for the H‐cell reactors are provided and modifications for electrobioreactors are stated in square brackets. E. coli cells were initially grown aerobically overnight at 37 °C, 250 min−1 [220 min−1] shaking frequency, and 50 mm [25 mm] shaking diameter in 10 mL [150 mL] LB medium, which was supplemented with the aforementioned antibiotics, namely 100 μg mL−1 ampicillin, 30 μg mL−1 chloramphenicol, and 10 μg mL−1 kanamycin. Subsequently, 1 mL [25 mL] of the cell suspension was used to inoculate 20 mL [500 mL] of fresh LB medium (supplemented with the aforementioned antibiotics), and incubated for 7 h at 37 °C, 250 min−1, and 50 mm shaking diameter [25 mm]. Cells were then separated from the medium by centrifugation (4000×g, 4 °C, 15 min) and resuspended in 50 mL [1000 mL] phosphate‐buffered medium as described by Golitsch et al.56 (2.7 mm KCl, 1.76 mm KH2PO4, 137 mm NaCl, 10 mm Na2HPO4, 9 mm (NH4)2SO4, 1 mm Mg2SO4, 0.1 mm CaCl2) supplemented with 0.1 g L−1 yeast extract, 40 mm KNO3, 20 mm glucose, and trace elements (5 μm CoCl2, 0.2 μm CuSO4, 57 μm H3BO3, 5.4 μMFeCl2, 1.3 μm MnSO4, 67.2 μm Na2‐EDTA, 3.9 μm Na2MoO4, 1.5 μm Na2SeO4, 5 μm NiCl2, and 1 μm ZnSO4). Further, 0.43 μm anhydrotetracycline was added for the induction of protein expression of LbADH, cymA, and mtrA, and 1 mm arabinose for the induction of protein expression of STC. Serum bottles with a net volume of 100 mL [Schott flasks with a net volume of 2000 mL] were filled with 50 mL [2000 mL] of culture broth each and flushed with N2 for 20 min. Bottles were then sealed with butyl stoppers [Schott flask plastic lids equipped with Teflon septa], and proteins were expressed at 30 °C, 180 min−1 shaking frequency, and 25 mm shaking diameter for 16–18 h. Finally, the cells were harvested by centrifugation at 4000×g and 4 °C for 15 min. The cell pellets were washed twice by resuspending in TEA buffer (50 mm triethanolamine⋅HCl, pH 7.5, 1 mm MgCl2), weighed, and finally resuspended in TEA buffer, which was later used for inoculation.
MES in H‐cell reactors
Experiments were conducted in batch bioelectrochemical H‐cell reactors (Adams&Chittenden Scientific Glass, Berkeley, CA, USA) with two chambers connected by 40 mm glass flanges, each having two sampling ports and one port for placing the Ag/AgCl‐sat. KCl reference electrode (SE11, Xylem Analytics Germany Sales GmbH&Co/Sensortechnik Meinsberg, Waldheim, Germany; sat. KCl, 0.197 V vs. SHE; Figure S2). The two chambers were separated by a cation exchange membrane (fumasep® FKS‐PET‐130, Fumatech, Bietigheim‐Bissingen, Germany) and contained 260 mL TEA buffer (50 mm triethanolamine⋅HCl, pH 7.5, 1 mm MgCl2) each. The solution in the working electrode, that is, cathode, chamber was supplemented with acetophenone, methyl viologen, and E. coli JG622_LbADH cells. Concentrations varied and are in the range discussed for setting up the DoE and specified Table S1 and are indicated in the Results and Discussion section. Both working and counter electrode were 5 cm long graphite rods with a diameter of 2.5 cm (CP‐3, CP‐Graphitprodukte GmbH, Wachtberg, Germany) with an insulated stainless‐steel wire (A2 steel, M 3, Adolf Würth GmbH & Co. KG, Künzelsau‐Gaisbach, Germany; insulated by heat‐shrink tubing) serving as current collector to the potentiostat (MPG‐2, Bio‐Logic Science Instruments, Claix, France). The geometric working electrode area used for calculations was 39.27 cm2. Reference electrodes were stored in a saturated KCl solution and cleaned with 70 % ethanol solution before insertion into the H‐cell reactors. Both chambers were sealed by butyl stoppers, which were secured by screw caps with apertures. The H‐cell reactors were kept at room temperature (21 °C) and were continuously stirred at 350 min−1 by magnetic stirrers. For oxygen removal, the working electrode chamber was sparged with N2 gas for 30 min. Subsequently, the potential of the working electrode was set at −0.7 V, acting as the cathode. MES was conducted over a period of five days. Samples of each (1.5 mL) were taken at regular intervals and immediately centrifuged at 15 700×g for 2 min. Cell pellets were discarded, and the supernatant was frozen at −20 °C until analysis by gas chromatography.
MES in 1 L electrobioreactor
Experiments were conducted in 1 L electrobioreactors based on bioreactor vessels (Infors Multifors, Infors AG, Bottmingen, Switzerland) equipped with the upgrade kit (Figure S3).29, 41, 42 The upgrade kit comprises a custom‐made lid and an inlay, which together create two chambers inside the glass bioreactor vessel, all parts made of polyetheretherketone (PEEK). The inlay contains three side openings displaying a cation exchange membrane with a total area of 21.48 cm2. A reinforced cation exchange membrane (fumasep® FKS‐PET‐130, Fumatech, Bietigheim‐Bissingen, Germany) was used to maintain the physical separation but allow ionic connection between the chambers, creating the working electrode chamber outside of the inlay, with a maximum working volume of 850 mL, and a counter electrode chamber (inside of the inlay) with a working volume of 150 mL. Working electrodes and counter electrodes were made from crystalline graphite rods (CP‐2200 quality, CP‐Handels GmbH, Wachtberg, Germany) with 10 mm diameter and 25 cm in length. The geometric working electrode area was 76.97 cm2, and can be assumed not to vary with time owing to sampling. Ag/AgCl sat. KCl reference electrodes (SE11, Xylem Analytics Germany Sales GmbH & Co/Sensortechnik Meinsberg, Waldheim, Germany; sat. KCl, 0.197 V vs. SHE) were used in the working chambers. Stirring of the outer working electrode chambers was achieved by using custom‐made magnetic stirrers placed in the bottom of the vessels, driven by the original magnetic drive of the reactor systems. The reactor lids were made as gastight as possible by introducing butyl rubber stoppers in all accessory inlets that were not in use (condenser, oxygen probe, pH probe). The counter electrode chambers were left open at the top, for simple gas exhaust and pressure relief. A substrate feeding system was installed in the reactors by using syringe pumps (kdScientific model 7891 100B, Holliston, MA, USA), equipped with 1 mL syringes (BD Plastipak, Eysins, Switzerland) and 0.15 mm internal diameter PEEK tubing and PEEK Luer fittings (GE Healthcare GmbH, Wuppertal, Germany). A five‐channel potentiostat (VSP, Bio‐Logic Claix, France) was used to maintain the potential of the working electrodes in the reactors at −0.7 V (chronoamperometry), sampling the current every 10 min.
The cell growth and induction trains before introduction into the MES reactors were performed in sterile conditions, but the MES reactor systems could not be run in in strict sterility as per definition.57 To assure almost sterile conditions, all of the MES equipment was washed and disinfected with Wofasteril E 400 (Kesla Hygiene AG, Bitterfeld‐Wolfen, Germany) followed by exhaustive rinsing with deionized water and drying. Reference electrodes were stored in a saturated KCl solution and dipped in a 70 % ethanol solution for 2 h before insertion in the reactors. TEA buffer (50 mm triethanolamine⋅HCl, pH 7.5, 1 mm MgCl2) was autoclaved and carefully poured into the reactor (750 mL into the working chamber and 150 mL into the counter electrode chamber) at a temperature of 70 °C before further cooling. The reactors were then closed, sparged with N2 at 1 sLpm (standard liter per minute at 0 °C and 100 kPa) and left to cool down. At this time, stirring at 600 rpm was initiated, and the temperature of the reactors was set to 25±1 °C. Addition of methyl viologen to the medium (see Results and Discussion for concentrations) was followed by start of the potentiostatic control of the working electrodes. The acetophenone was added/feeding started at this time (see Results and Discussion for concentrations/feeding rate). Only after the medium turned to dark violet (owing to reduction of the methyl viologen, ≈30 min) was 50 mL of E. coli cell concentrate added to reach the desired starting cell concentration. After the first sampling, the working electrode chambers were sealed and N2 sparging stopped. Overhead nitrogen sparging at 1 sLpm was activated for approximately 10 min every time the reactors were sampled. Samples of 2 mL were taken from the working chamber at regular intervals. Samples were immediately centrifuged at 11 000×g for 3 min. Cell pellets were discarded and the supernatant was frozen at −20 °C until analysis by gas chromatography.
Analysis of acetophenone, (R)‐1‐phenylethanol, protein, and hydrogen peroxide concentrations
To determine the transformation of acetophenone to (R)‐1‐phenylethanol, the sample (1.5 mL) obtained from biocatalytic experiments was centrifuged at 4 °C and 15 700×g for 3 min to separate the medium from the cells. Supernatant (1 mL) was transferred to a fresh reaction tube and extracted by addition of ethyl acetate (0.5 mL) and mixing at 1300 min−1 for 15 min and subsequent centrifugation (15 700×g, 10 min) at room temperature. The organic phase (2 μL) was analyzed by gas chromatography using a flame ionization detector (GC‐FID, HP 6890 Plus, Agilent Technologies, Waldbronn, Germany) equipped with a CP‐Chirasil‐DEX CB column (Agilent Technologies, Waldbronn, Germany; 25 m, 0.25 mm, 0.25 μm, 7 inch cage). Helium was used as carrier gas with a constant flow of 1.5 mL min−1. The temperature program was as follows: 110 °C (5 min), 110–125 °C (2 °C min−1), 125 °C (3 min). The extracellular protein concentration was determined by using a Roti‐Quant Bradford Assay (Carl‐Roth GmbH & Co. KG., Karlsruhe, Germany) with bovine serum albumin as a standard. The concentration of hydrogen peroxide was measured with the biochemical analyzer YSI 2900D (Kreienbaum Wissenschaftliche Meßsysteme, Langenfeld, Germany).
Conflict of interest
The authors declare no conflict of interest.
Supporting information
As a service to our authors and readers, this journal provides supporting information supplied by the authors. Such materials are peer reviewed and may be re‐organized for online delivery, but are not copy‐edited or typeset. Technical support issues arising from supporting information (other than missing files) should be addressed to the authors.
Supplementary
Acknowledgements
We are grateful to Prof. Dr. J. Gescher and S. Beblawy (both Department of Applied Biology, Karlsruhe Institute of Technology) for providing and advice on handling E. coli JG622. J.M. and A.S. acknowledge the funding by the Deutsche Forschungsgemeinschaft (DFG, German Research Foundation) under Germany's Excellence Strategy—EXC 2163/1‐ Sustainable and Energy Efficient Aviation—Project‐ID 390881007. F.H. acknowledges support by the Federal Ministry of Education and Research (Research Award “Next generation biotechnological processes–Biotechnology 2020+”) and the Helmholtz Association (Young Investigators Group). This work was supported by the Helmholtz Association within the Research Program Renewable Energies.
J. C. Mayr, L. F. M. Rosa, N. Klinger, J.-H. Grosch, F. Harnisch, A. C. Spiess, ChemSusChem 2020, 13, 1808.
Contributor Information
Prof. Dr. Falk Harnisch, Email: falk.harnisch@ufz.de.
Prof. Dr. Antje C. Spiess, Email: a.spiess@tu-braunschweig.de.
References
- 1. Varone A., Ferrari M., Renewable Sustainable Energy Rev. 2015, 45, 207–218. [Google Scholar]
- 2. Schröder U., Harnisch F., Angenent L. T. L. T., Energy Environ. Sci. 2015, 8, 513–519. [Google Scholar]
- 3. May H. D., Evans P. J., LaBelle E. V., Curr. Opin. Biotechnol. 2016, 42, 225–233. [DOI] [PubMed] [Google Scholar]
- 4. Zhou M., Freguia S., Dennis P. G., Keller J., Rabaey K., Microb. Biotechnol. 2015, 8, 483–489. [DOI] [PMC free article] [PubMed] [Google Scholar]
- 5. Krieg T., Sydow A., Faust S., Huth I., Holtmann D., Angew. Chem. Int. Ed. 2018, 57, 1879–1882; [DOI] [PubMed] [Google Scholar]; Angew. Chem. 2018, 130, 1897–1900. [Google Scholar]
- 6. Mayr J. C., Grosch J. H., Hartmann L., Rosa L. F. M., Spiess A. C., Harnisch F., ChemSusChem 2019, 12, 1631–1634. [DOI] [PubMed] [Google Scholar]
- 7. de Carvalho C. C., Microb. Biotechnol. 2017, 10, 250–263. [DOI] [PMC free article] [PubMed] [Google Scholar]
- 8. Liese A., Filho M. V., Curr. Opin. Biotechnol. 1999, 10, 595–603. [DOI] [PubMed] [Google Scholar]
- 9. Panke S., Held M., Wubbolts M., Curr. Opin. Biotechnol. 2004, 15, 272–279. [DOI] [PubMed] [Google Scholar]
- 10. Teravest M. A., Zajdel T. J., Ajo-Franklin C. M., ChemElectroChem 2014, 1, 1874–1879. [Google Scholar]
- 11. Goldbeck C. P., Jensen H. M., Teravest M. A., Beedle N., Appling Y., Hepler M., Cambray G., Mutalik V., Angenent L. T., Ajo-Franklin C. M., ACS Synth. Biol. 2013, 2, 150–159. [DOI] [PubMed] [Google Scholar]
- 12. Jensen H. M., Albers A. E., Malley K. R., Londer Y. Y., Cohen B. E., Helms B. A., Weigele P., Groves J. T., Ajo-Franklin C. M., Proc. Natl. Acad. Sci. USA 2010, 107, 19213–19218. [DOI] [PMC free article] [PubMed] [Google Scholar]
- 13. Sturm-Richter K., Golitsch F., Sturm G., Kipf E., Dittrich A., Beblawy S., Kerzenmacher S., Gescher J., Bioresour. Technol. 2015, 186, 89–96. [DOI] [PubMed] [Google Scholar]
- 14. Arslan E., Schulz H., Zufferey R., Künzler P., Thöny-Meyer L., Biochem. Biophys. Res. Commun. 1998, 251, 744–747. [DOI] [PubMed] [Google Scholar]
- 15. Niefind K., Müller J., Riebel B., Hummel W., Schomburg D., J. Mol. Biol. 2003, 327, 317–328. [DOI] [PubMed] [Google Scholar]
- 16. Singh V., Haque S., Niwas R., Srivastava A., Pasupuleti M., Tripathi C., Front. Microbiol. 2017, 7, 2087. [DOI] [PMC free article] [PubMed] [Google Scholar]
- 17. Dayana Priyadharshini S., Bakthavatsalam A. K., Bioresour. Technol. 2016, 207, 150–156. [DOI] [PubMed] [Google Scholar]
- 18. Colla L. M., Primaz A. L., Benedetti S., Loss R. A., de Lima M., Reinehr C. O., Bertolin T. E., Costa J. A. V., Braz. J. Microbiol. 2016, 47, 461–467. [DOI] [PMC free article] [PubMed] [Google Scholar]
- 19. Hosseinpour M., Vossoughi M., Alemzadeh I., J. Environ. Health Sci. Eng. 2014, 12, 33. [DOI] [PMC free article] [PubMed] [Google Scholar]
- 20. Sun H., Luo S., Jin R., He Z., ACS Sustainable Chem. Eng. 2015, 3, 3231–3238. [Google Scholar]
- 21. Garg A., Vijayaraghavan V., Mahapatra S. S., Tai K., Wong C. H., Expert Syst. Appl. 2014, 41, 1389–1399. [Google Scholar]
- 22. Jia Q., Wei L., Han H., Shen J., Int. J. Hydrogen Energy 2014, 39, 13687–13693. [Google Scholar]
- 23. Madani S., Gheshlaghi R., Mahdavi M. A., Sobhani M., Elkamel A., Fuel 2015, 150, 434–440. [Google Scholar]
- 24. Sajana T. K., Ghangrekar M. M., Mitra A., Aquac. Eng. 2014, 61, 17–26. [Google Scholar]
- 25. Sydow A., Krieg T., Ulber R., Holtmann D., Eng. Life Sci. 2017, 17, 781–791. [DOI] [PMC free article] [PubMed] [Google Scholar]
- 26. Krieg T., Madjarov J., Rosa L. F. M., Enzmann F., Harnisch F., Holtmann D., Rabaey K. in Bioelectrosynthesis (Eds.: F. Harnisch, D. Holtmann), Springer Nature, Cham, 2019, pp. 231–271. [Google Scholar]
- 27. Escapa A., San-Martín M. I., Mateos R., Morán A., Bioresour. Technol. 2015, 180, 72–78. [DOI] [PubMed] [Google Scholar]
- 28. Brown R. K., Harnisch F., Wirth S., Wahlandt H., Dockhorn T., Dichtl N., Schröder U., Bioresour. Technol. 2014, 163, 206–213. [DOI] [PubMed] [Google Scholar]
- 29. Rosa L. F. M., Hunger S., Gimkiewicz C., Zehnsdorf A., Harnisch F., Eng. Life Sci. 2017, 17, 77–85. [DOI] [PMC free article] [PubMed] [Google Scholar]
- 30. Enzmann F., Mayer F., Stöckl M., Mangold K. M., Hommel R., Holtmann D., Chem. Eng. Sci. 2019, 193, 133–143. [Google Scholar]
- 31. Enzmann F., Stöckl M., Zeng A. P., Holtmann D., Eng. Life Sci. 2019, 19, 121–132. [DOI] [PMC free article] [PubMed] [Google Scholar]
- 32. Mears L., Stocks S. M., Sin G., Gernaey K. V., J. Biotechnol. 2017, 245, 34–46. [DOI] [PubMed] [Google Scholar]
- 33. Liu H., Cheng S., Logan B. E., Environ. Sci. Technol. 2005, 39, 5488–5493. [DOI] [PubMed] [Google Scholar]
- 34. Cirik K., Appl. Biochem. Biotechnol. 2014, 173, 205–214. [DOI] [PubMed] [Google Scholar]
- 35. Jourdin L., Raes S. M. T., Buisman C. J. N., Strik D. P. B. T. B., Front. Energy Res. 2018, 6, 7. [Google Scholar]
- 36. Hildebrand F., Lütz S., Tetrahedron: Asymmetry 2007, 18, 1187–1193. [Google Scholar]
- 37. Sardessai Y., Bhosle S., Res. Microbiol. 2002, 153, 263–268. [DOI] [PubMed] [Google Scholar]
- 38. Kracke F., Vassilev I., Krömer J. O., Front. Microbiol. 2015, 6, 575. [DOI] [PMC free article] [PubMed] [Google Scholar]
- 39. Lütz S., Steckhan E., Liese A., Electrochem. Commun. 2004, 6, 583–587. [Google Scholar]
- 40. Stradowski C., J. Appl. Polym. Sci. 1990, 41, 2511–2512. [Google Scholar]
- 41. Harnisch F., Hunger S., Zehnsdorf A., Beyer D., Rosa L. F. M., Expansion Kit for Bioreactors Used for Performing Microbial Bio-Electrosynthesis, WO2015082490A1, PCT/EP2014/076293, 2015.
- 42. Rosa L. F. M., Hunger S., Zschernitz T., Strehlitz B., Harnisch F., Front. Energy Res. 2019, 7, 98. [Google Scholar]
- 43. Lin Q., Li Q., Batchelor-McAuley C., Compton R. G., Phys. Chem. Chem. Phys. 2013, 15, 7760–7767. [DOI] [PubMed] [Google Scholar]
- 44. Asad N. R., Asad L. M., Silva A. B., Felzenszwalb I., Leitão A. C., Acta Biochim. Pol. 1998, 45, 677–690. [PubMed] [Google Scholar]
- 45. Billany M. R., Khatib K., Gordon M., Sugden J. K., Int. J. Pharm. 1996, 137, 143–147. [Google Scholar]
- 46. Dyrda G., Boniewska E., Dariusz B., Katarzyna M., Rudolf B., Mol. Biol. Rep. 2019, 46, 3225–3232. [DOI] [PubMed] [Google Scholar]
- 47. Lee P. S., in Practical Handbook of Microbiology (Eds.: E. Goldman, L. H. Green), CRC Press, Taylor & Francis Group, Boca Raton, FL, 2009, pp. 17–18. [Google Scholar]
- 48. Yong Y. C., Yu Y. Y., Yang Y., Liu J., Wang J. Y., Song H., Biotechnol. Bioeng. 2013, 110, 408–416. [DOI] [PubMed] [Google Scholar]
- 49. Catania C., Ajo-Franklin C. M., Bazan G. C., RSC Adv. 2016, 6, 100300–100306. [Google Scholar]
- 50. Gudiminchi R. K., Randall C., Smit M. S., Appl. Microbiol. Biotechnol. 2012, 12, 1507–1516. [DOI] [PubMed] [Google Scholar]
- 51. France S. P., Hepworth L. J., Turner N. J., Flitsch S. L., ACS Catal. 2017, 7, 710–724. [Google Scholar]
- 52. Muschiol J., Peters C., Oberleitner N., Mihovilovic M. D., Bornscheuer U. T., Rudroff F., Chem. Commun. 2015, 51, 5798–5811. [DOI] [PubMed] [Google Scholar]
- 53. Lundstedt T., Seifert E., Abramo L., Thelin B., Nyström Å., Pettersen J., Bergman R., Chemom. Intell. Lab. Syst. 1998, 42, 3–40. [Google Scholar]
- 54. Clark D. G., McElligott T. F., Weston Hurst E., Br. J. Ind. Med. 1966, 23, 126–132. [DOI] [PMC free article] [PubMed] [Google Scholar]
- 55. Dreyer S., Kragl U., Biotechnol. Bioeng. 2008, 99, 1416–1424. [DOI] [PubMed] [Google Scholar]
- 56. Golitsch F., Bücking C., Gescher J., Biosens. Bioelectron. 2013, 47, 285–291. [DOI] [PubMed] [Google Scholar]
- 57. Agalloco J., Akers J., Madsen R., Pharm. Technol. 2004, 55, 126–150. [Google Scholar]
Associated Data
This section collects any data citations, data availability statements, or supplementary materials included in this article.
Supplementary Materials
As a service to our authors and readers, this journal provides supporting information supplied by the authors. Such materials are peer reviewed and may be re‐organized for online delivery, but are not copy‐edited or typeset. Technical support issues arising from supporting information (other than missing files) should be addressed to the authors.
Supplementary