Abstract
BACKGROUND: Solvent/detergent (S/D) treatment is an established virus inactivation technology that has been applied in the manufacture of medicinal products derived from human plasma for more than 20 years. Data on the inactivation of enveloped viruses by S/D treatment collected from seven Plasma Protein Therapeutics Association member companies demonstrate the robustness, reliability, and efficacy of this virus inactivation method.
STUDY DESIGN AND METHODS: The results from 308 studies reflecting production conditions as well as technical variables significantly beyond the product release specification were evaluated for virus inactivation, comprising different combinations of solvent and detergent (tri(n‐butyl) phosphate [TNBP]/Tween 80, TNBP/Triton X‐100, TNBP/Na‐cholate) and different products (Factor [F]VIII, F IX, and intravenous and intramuscular immunoglobulins).
RESULTS: Neither product class, process temperature, protein concentration, nor pH value has a significant impact on virus inactivation. A variable that did appear to be critical was the concentration of solvent and detergent.
CONCLUSION: The data presented here demonstrate the robustness of virus inactivation by S/D treatment for a broad spectrum of enveloped test viruses and process variables. Our data substantiate the fact that no transmission of viruses such as human immunodeficiency virus, hepatitis B virus, hepatitis C virus, or of other enveloped viruses was reported for licensed plasma derivatives since the introduction of S/D treatment.
ABBREVIATIONS:
- BVDV =
bovine viral diarrhea virus
- CoV =
corona virus
- EAV =
equine arthritis virus
- IMIG =
intramuscular immunoglobulin
- LRF =
log reduction factor
- PPTA =
Plasma Protein Therapeutics Association
- PRV =
pseudorabies virus
- SARS =
severe acute respiratory syndrome
- SINV =
Sindbis virus
- TNBP =
tri(n‐butyl) phosphate
- VacV =
vaccinia virus
- VSV =
vesicular stomatitis virus
- WNV =
West Nile virus.
Since the introduction of solvent/detergent (S/D) treatment into the manufacturing processes of medicinal products derived from human plasma more than 20 years ago, no proven transmission of enveloped viruses by any S/D‐treated product has been reported. Today, S/D treatment has become accepted worldwide as an effective, robust, and simple technology for inactivating enveloped viruses in various plasma derivatives and other biologic products including recombinant proteins.
The development of the S/D treatment by the New York Blood Center provided an effective and simple technology to inactivate enveloped viruses even at large production scales. 1 The mode of action is the disruption of viral lipid structures by solvents such as tri(n‐butyl) phosphate (TNBP). To make solvents available in aqueous solutions, detergents like Tween 80 (polysorbate 80), Triton X‐100 (octoxynol), or Na‐cholate are additionally required. In the very beginning of the development, a combination of ether and Tween 80 was used. 2 Due to the explosive nature, this S/D mixture was replaced by TNBP and Na‐cholate, 3 , 4 a combination still in use. 5 Based on further improvements of the S/D technology, TNBP and Tween 80 is the most commonly used combination today. 6 Meanwhile other effective combinations have been demonstrated, including TNBP/Triton X‐100 7 , 8 or TNBP with mixtures of different detergents. The successful inactivation of human pathogenic viruses such as human immunodeficiency virus (HIV), hepatitis B virus (HBV), and hepatitis C virus (HCV) or model viruses such as Sindbis virus (SINV), Sendai virus, bovine viral diarrhea virus (BVDV), and vesicular stomatitis virus (VSV) was reported by the New York Blood Center. 4
Today, manufacturers of plasma derivatives must investigate all relevant process steps at a well‐defined laboratory scale to demonstrate the viral safety of their products. These virus validation studies must follow international guidelines and recommendations. 9 , 10 , 11 , 12 In addition to validation under production conditions, the guidelines require the demonstration of the robustness of each virus inactivation method by investigating the limits of the production conditions or conditions even beyond these limits. As a consequence, all manufacturers of plasma‐derived medicinal products worldwide are investigating similar conditions of S/D treatment, using nearly identical spectra of test viruses and generating nearly identical sets of data. 13 Thus, significant amounts of information on virus inactivation by S/D treatment are available meanwhile, but for the most part remain unpublished and are concealed in the archives of companies or regulatory authorities.
To make those data available to all regulatory authorities, physicians, patient organizations, and researchers; to support WHO in caring for virus‐safe plasma derivatives in the developing countries; and also to reinforce the efficacy and robustness of the S/D technology, seven Plasma Protein Therapeutics Association (PPTA) member companies consolidated their data on virus inactivation for Factor (F)VIII, F IX, intravenous immune globulin (IVIG), and intramuscular immunoglobulin (IMIG). The results of in total 308 studies are presented here, including validation under production and robustness conditions.
MATERIALS AND METHODS
Products and procedures of S/D treatment
The data on S/D treatment generated by seven PPTA member companies were collected and made anonymous. The data collection comprises the processes of different manufacturers including different products; different combinations of solvent and detergent; and different production variables such as temperature, protein concentration, pH, incubation time, and concentration of the virus‐inactivating agents. Data on virus inactivation under production conditions (n = 128) and data from robustness studies (n = 180) are included. In total, data from 308 studies were collected and evaluated: FVIII (n = 91), F IX (n = 46), IVIG (n = 148), and IMIG (n = 23). The different S/D procedures comprised the combination of TNBP with Tween 80 (n = 173), with Triton X‐100 (n = 35), with Triton X‐100 plus Tween 80 (n = 56), and with Na‐cholate (n = 44). (Data of virus of virus validation studies are provided in the appendix, available as supporting information in the online version of this paper.)
Conditions of S/D treatment
In Table 1 the relevant process variables of S/D treatment are summarized, comparing the variables at production scale to those investigated in robustness studies. In the robustness studies, process variables were investigated either at the upper and/or at the lower limits of the production range or even significantly beyond these limits.
Table 1.
Conditions of S/D treatment and range of process variables
| Product | Process variables | Range in studies (production conditions)* | Range in robustness studies |
|---|---|---|---|
| F IX | Protein concentration (g/L) | 9‐15 | 9‐22 |
| Temperature (°C) | 18‐25.5 | 18.0‐25.5 | |
| pH | 7.5‐7.2 | 6.3‐7.1 | |
| Incubation time (min)† | 120‐480 | 0‐360 | |
| FVIII | Protein concentration (g/L) | 6‐30 | 3.0‐49.4 |
| Temperature (°C) | 18‐28 | 13.9‐28 | |
| pH | 7.0‐7.5 | 6.3‐7.5 | |
| Incubation time (min)† | 0.5‐480 | 0‐360 | |
| IMIG | Protein concentration (g/L) | 19‐60 | 10‐60 |
| Temperature (°C) | 20‐30 | 20‐32 | |
| pH | 5.2‐7.0 | 5.2‐7.0 | |
| Incubation time (min)† | 1‐480 | 2‐480 | |
| IVIG | Protein concentration (g/L) | 8‐84 | 8‐75 |
| Temperature (°C) | 6‐32 | 2‐30 | |
| pH | 4.2‐8.0 | 4.9‐7.5 | |
| Incubation time (min)† | 1‐480 | 0‐480 | |
| All products | Protein concentration (g/L) | 6‐84 | 3‐75 |
| Temperature (°C) | 6‐32 | 2‐30 | |
| pH | 4.2‐8.0 | 4.9‐7.5 | |
| Incubation time (min)† | 0.5‐540 | 0‐480 |
Except for incubation time, where samples were drawn during incubation up to the time specified for the manufacturing process.
Incubation time 0 minutes: first sample collection immediately after the addition of S/D.
In Table 2 the concentrations of solvent and detergents are listed. Except from one S/D procedure, 3 g/L TNBP is used at production scale. A broader range of lower concentrations of solvent and detergent was only investigated in the robustness studies.
Table 2.
Concentrations of solvent and detergent(s) under production conditions and in robustness studies
| Product | Conditions | Concentrations of solvent and detergent (g/L) | |||
|---|---|---|---|---|---|
| TNBP/Tween 80 | TNBP/cholate | TNBP/Triton X‐100 | TNBP/Triton X‐100/Tween 80 | ||
| Factor VIII | Production | 3.0 | 2.9 | 2.9 | |
| 10.6 | |||||
| 10.0 | 10.6 | 3.2 | |||
| Robustness | 0.1‐3.3 | 0.29‐1.8 | 0.15‐1.8 | ||
| 0.53‐8.6 | |||||
| 0.37‐18.0 | 1.0‐8.4 | 0.16‐1.6 | |||
| Factor IX | Production | 3.0 | |||
| 10.0 | |||||
| Robustness | 0.32‐2.62 | ||||
| 1.1‐12.0 | |||||
| IVIG | Production | 3.0 | 3.0 | 1.0 and 1.0 | 2.9 |
| 10.6 | |||||
| 10.0 | 2.0 | 3.0 and 10.0 | 3.2 | ||
| Robustness | 0.08‐2.62 | 0.3‐3.6 | 0.25‐2.3 | 0.03‐1.46 | |
| 0.11‐5.30 | |||||
| 0.25‐12.0 | 0.2‐2.4 | 0.25‐7.5 | 0.03‐1.62 | ||
| IMIG | Production | 3.0 | 2.9 | ||
| 10.6 | |||||
| 2.0 | 3.2 | ||||
| Robustness | 0.6 to 2.0 | 0.25 | |||
| 0.95 | |||||
| 0.4 to 1.3 | 0.30 | ||||
| All products | Production | 3.0 | 3.0 | 1.0‐3.0 | 2.9 |
| 10.6 | |||||
| 10.0 | 2.0 | 1.0‐1.6 | 3.2 | ||
| Robustness | 0.08‐3.3 | 0.3‐3.6 | 0.25‐2.3 | 0.03‐1.8 | |
| 0.11‐8.6 | |||||
| 0.25‐18.0 | 0.2‐2.4 | 0.25‐8.5 | 0.03‐1.6 | ||
Viruses and infectivity assays
The viruses used in the studies (Table 3) were chosen in compliance with the current international guidelines on virus validation. It should be noted that neither HCV nor HBV can be propagated in cell culture. Therefore, appropriate model viruses were used instead. Viruses were obtained from different sources (e.g., American Type Culture Collection) and propagated on susceptible cell lines.
Table 3.
Viruses used in validation studies
| Virus | Number of studies |
|---|---|
| PRV | 117 |
| BVDV | 109 |
| HIV‐1 | 53 |
| SINV | 9 |
| EAV | 7 |
| WNV | 6 |
| VSV | 4 |
| VacV | 2 |
| SARS‐CoV | 1 |
| Total | 308 |
To determine the kinetics of virus inactivation, samples were taken and immediately diluted to terminate the S/D treatment. Subsequently, these dilutions were screened by infectivity assays. Virus titers were calculated according to Spearman Kaerber. 14 The virus inactivation capacity (expressed as log virus reduction factor [LRF]) was calculated by comparing the virus titers before and after defined time points of exposure to S/D, in compliance with the current international guidelines on virus validation. 9 Whenever no residual infectivity was detected, the corresponding virus reduction factor is reported as greater than or equal to (≥).
Virus reduction factors in the order of 4.0 log or higher usually reflect a virus inactivation capacity which significantly contributes to the overall safety of the finished product. However, the actual LRF strongly depends on the dynamic range of the assay, which is mainly limited by the following factors: titer and volume of the virus spike, sample dilution necessary to avoid cytotoxicity due to TNBP and detergent, and sample volume plated onto the cell cultures for virus detection.
Data collection
All data presented here are derived from studies covering the time‐dependent inactivation of a test virus. As inactivation kinetics of 308 studies cannot be shown here, only the data of the first time point are summarized at which virus inactivation to below the limit of detection or the highest virus reduction factor was achieved (e.g., the LRF values for 1 min in Fig. 1). For the robustness studies where residual infectivity was found only under extreme conditions, the virus reduction factor obtained at the end of the incubation time is given.
Figure 1.
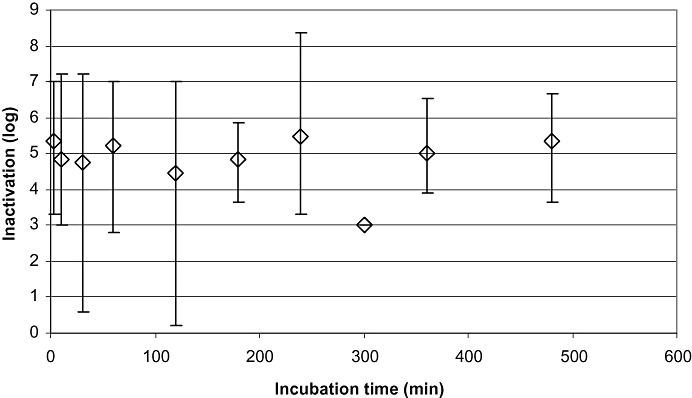
Data on virus inactivation by S/D treatment of all 308 studies, including robustness studies with significantly reduced concentrations of solvent and detergent. Mean LRF values are plotted versus the first time point at which virus inactivation to below the limit of detection or the highest reduction factor was achieved. Shown are the mean values of inactivation and the ranges of inactivation for the corresponding time points: 0 to 5 minutes (n = 58), 5 to 16 minutes (n = 26), 30 minutes (n = 27), 60 minutes (n = 42), 120 minutes (n = 73), 180 minutes (n = 17), 240 minutes (n = 16), 300 minutes (n = 1), 360 minutes (n = 21), and 480 minutes (n = 26). For viruses tested, please see text. Vertical bars show the range of inactivation.
Each LRF represents an entire validation study on the kinetics of virus inactivation by S/D treatment. Inactivation data for the different time points are presented in the figures as a mean value and the range from highest to lowest value is shown as vertical bars. Whenever necessary, data of tightly neighboring time points or concentrations were accumulated. So data at incubation times of 0 to 5 minutes and more than 5 to 16 minutes were combined, and inactivation data at TNBP concentrations of less than 0.5, less than 0.5 to 1, more than 1 to 1.5, more than 1.5 to 2, more than 2 to 2.5, more than 2.5 to 3, and more than 3 g/L were accumulated. Accumulation of data was also used for temperature, protein concentration, and pH values.
RESULTS
The virus inactivation data of all 308 studies are summarized in Fig. 1, irrespective of the combination of solvent and detergent, of the product, and of process variables such as concentration of solvent and detergent(s), protein concentration, temperature, and pH. LRF values are plotted versus the incubation time, including all studies performed under production conditions and all robustness studies on investigating parameters significantly deviating from production conditions. Figure 1 shows the ranges of inactivation and the mean value for each time point and the number of studies involved in each range. The viruses used are listed in Table 3.
Studies under production conditions
Studies under production conditions were defined as studies where the concentrations of S/D were not or only insignificantly changed. In Fig. 2 data obtained under production conditions are summarized, comprising all viruses, different classes of product, and different combinations of solvent and detergents. In total, 128 studies were evaluated for HIV‐1 (n = 28 studies), pseudorabies virus (PRV; n = 44), BVDV (n = 43), SINV (n = 6), WNV (n = 2), VSV (n = 4), and vaccinia virus (VacV; n = 1). The process variables tested were in the range from 6 to 32°C, pH values from 4.2 to 8.0, and protein concentrations from 6 to 84 g/L. The TNBP concentrations were 1 and 2.9 or 3 g/L, and the concentrations of the detergents ranged from 1 to 10 (Table 2). Ranges of LRF values are plotted versus the incubation time. Complete inactivation of all viruses could be demonstrated. Depending on the dynamic range of the infectivity assay, virus inactivation factors ranged between ≥2.4 and ≥8.4 log.
Figure 2.
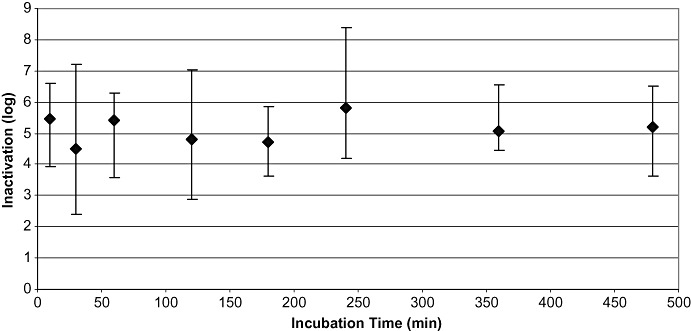
Results of studies performed under production conditions (n = 128): all viruses. Mean LRF values are plotted versus the first time point at which virus inactivation to below the limit of detection or the highest reduction factor was achieved. Shown are the mean values of inactivation and the ranges of inactivation for the corresponding time points: 0.5 to 10 minutes (n = 18), 30 minutes (n = 12), 60 minutes (n = 17), 120 minutes (n = 30), 180 minutes (n = 8), 240 minutes (n = 10), 360 minutes (n = 13), and 480 minutes (n = 20 studies). For viruses tested, please see text. Vertical bars show the range of inactivation.
Virus inactivation in different products and by different combinations of solvent and detergent
The 128 studies performed under production conditions were evaluated for the potential influence of the different products and their compositions, for example, protein concentration, pH, buffer solution, and so forth, on virus inactivation: FVIII (n = 34), F IX (n = 16), IVIG (n = 69), and IMIG (n = 9). Virus inactivation was achieved from ≥2.9 to ≥7.2 log for IVIG, ≥4.7 to ≥6.5 log for IMIG, ≥3.6 to ≥6.5 log for F IX, and ≥2.4 to ≥8.4 log for FVIII.
Four combinations of TNBP and detergent were evaluated: TNBP with Tween 80 (n = 74), TNBP with Triton X‐100 (n = 8), TNBP with Triton X‐100 plus Tween 80 (n = 25), and TNBP with Na‐cholate (n = 21). For the combination of TNBP with Tween 80, LRF values were between ≥2.4 and ≥8.4 log, for TNBP/Triton X‐100 between ≥2.9 and ≥6.5 log, for TNBP with Triton X‐100 plus Tween 80 between ≥4.0 and ≥6.6 log, and between ≥4.0 and ≥7.0 log for TNBP/Na‐cholate. The mean values and ranges of inactivation for the different products and different combinations of TNBP and detergent are shown in Fig. 3.
Figure 3.
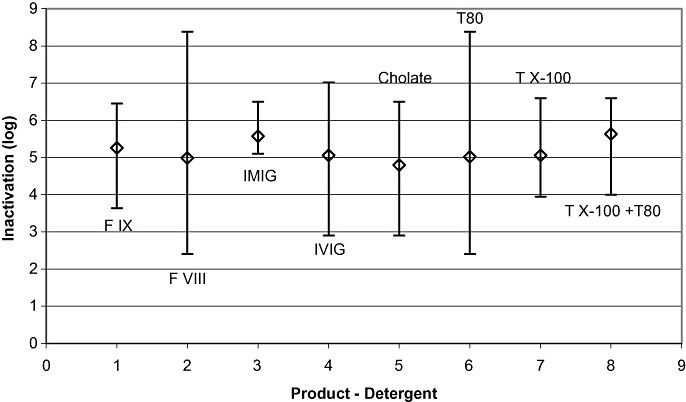
Results of studies performed under production conditions (n = 128): influence of different products and procedures. Mean LRF values are plotted versus the first time point at which virus inactivation to below the limit of detection or the highest reduction factor was achieved. Shown are the mean values of inactivation and the ranges of inactivation for the four different products, F IX (n = 16), FVIII (n = 34), IMIG (n = 9), and IVIG (n = 69), and the four different combinations of TNBP with cholate (n = 21), Tween 80 (T80; n = 74), Triton X‐100 (TX‐100; n = 8), and Triton X‐100 plus Tween 80 (TX‐100 + T80; n = 25). For viruses tested, please see text. Vertical bars show the range of inactivation.
Influence of protein concentration, incubation temperature, and pH on virus inactivation
Inactivation by ≥2.4 to ≥3.8 log was achieved for HIV, PRV, BVDV, equine arthritis virus (EAV), SINV, VSV, WNV, and VacV. The test variables were as described under “Studies under production conditions.” The data from 128 studies indicate that virus inactivation is not significantly affected by pH, incubation temperature, or protein concentration.
Influence of TNBP/detergent concentrations on virus inactivation
Under production conditions, two different concentrations of TNBP are applied: 1 and 3 g/L. Except for three studies that were performed with 1 g/L, all other studies were performed with 3 g/L. Detergent concentrations varied from 2.0 to 2.1 g/L (Na‐cholate), 10.0 to 10.5 g/L (Tween 80), 1 to 10 g/L (Triton X‐100), and 10.6 g/L Triton X‐100 plus 3.24 g/L Tween 80 (Table 2). For these combinations of solvent and detergent, virus inactivation factors ranged between ≥2.4 and ≥8.4 log. The two concentrations of TNBP (1 and 3 g/L) in combination with different detergents showed no influence on virus inactivation.
Studies on process robustness
In total, 180 studies on process robustness were performed under conditions where the concentrations of TNBP and detergents significantly deviate from production conditions. Studies were evaluated for different protein concentrations, incubation temperatures, pH values, products, and combinations of solvent and detergents and at reduced incubation times (Table 2). The concentrations of TNBP were in the range of 0.03 to 3.3 g/L, and the concentrations of the detergents in the range of 0.11 to 18 g/L. Most of the studies were performed with PRV (n = 75), followed by BVDV (n = 64) and HIV‐1 (n = 25). Few studies were performed with EAV (n = 7), WNV (n = 4), and SINV (n = 3). One study each was performed with severe acute respiratory syndrome (SARS)‐corona virus (CoV) and VacV.
Demonstrated virus inactivation was up to ≥7.2 log, irrespective of incubation time and all other conditions of the S/D treatment. Virus reduction factors ≤1.0 log (nonsignificant) were only found at drastically reduced S/D concentrations. The results of these studies are shown in Fig. 4, where the LRF values are plotted versus incubation time.
Figure 4.
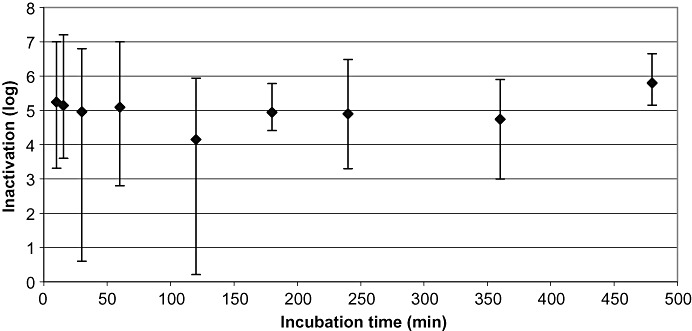
Results of all robustness studies (n = 180): all viruses. Mean LRF values are plotted versus the first time point at which virus inactivation to below the limit of detection or the highest reduction factor was achieved. Shown are the mean values of inactivation and the ranges of inactivation for the corresponding time points: accumulated data from 0 to 10 minutes (n = 56), accumulated data from 15 and 16 minutes (n = 10), 30 minutes (n = 15), 50 to 60 minutes (n = 25), 120 minutes (n = 44), 180 minutes (n = 9), 240 minutes (n = 6), 300 minutes (n = 1), 360 minutes (n = 9), and 480 minutes (n = 6 studies) For viruses tested, please see text. Vertical bars show the range of inactivation.
Virus inactivation by S/D treatment in different products
The potential influence of the different products on virus inactivation was investigated. Fifty‐seven studies were performed on FVIII, 30 studies on F IX, 79 studies on IVIG, and 14 studies on IMIG. In 49 studies, the TNBP concentration was lower than 25% of the concentration used under production conditions. Despite the major deviations from standard concentration, virus inactivation between 4.1 and ≥7.2 log was achieved. LRF values ≤1.0 log, considered as nonsignificant inactivation, were only found at drastically reduced S/D concentrations. Those studies will be discussed separately. Figure 5A shows the virus inactivation data of product classes, plotted versus the concentration of TNBP, and Fig. 5B the data plotted versus the incubation time. Studies were performed with PRV (n = 75), BVDV (n = 64), HIV‐1 (n = 25), EAV (n = 7), WNV (n = 4), SINV (n = 3), VacV (n = 1), and SARS‐CoV (n = 1).
Figure 5.
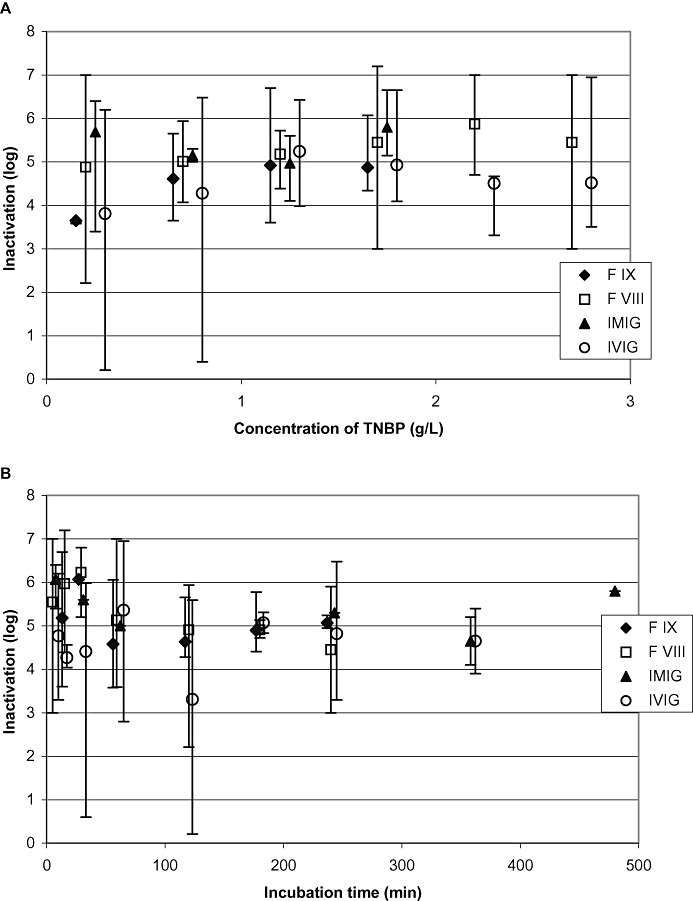
Results of all robustness studies (n = 180): influence of products on virus inactivation. All studies were performed at robustness conditions. (A) Inactivation mean values of different products plotted versus the concentration of TNBP; (B) mean virus inactivation plotted versus incubation time. Vertical bars show the range of inactivation.
Virus inactivation by TNBP in combination with different detergents
Four combinations of TNBP and detergent were investigated: TNBP with Tween 80 (n = 99), TNBP with Triton X‐100 plus Tween 80 (n = 31), TNBP with Na‐cholate (n = 23), and TNBP with Triton X‐100 (n = 27). The virus inactivation data of these different combinations of solvent and detergent(s) are shown in Figs. 6A and 6B, where mean LRF values and inactivation ranges from different combinations are plotted versus the concentration of TNBP and versus the incubation time.
Figure 6.
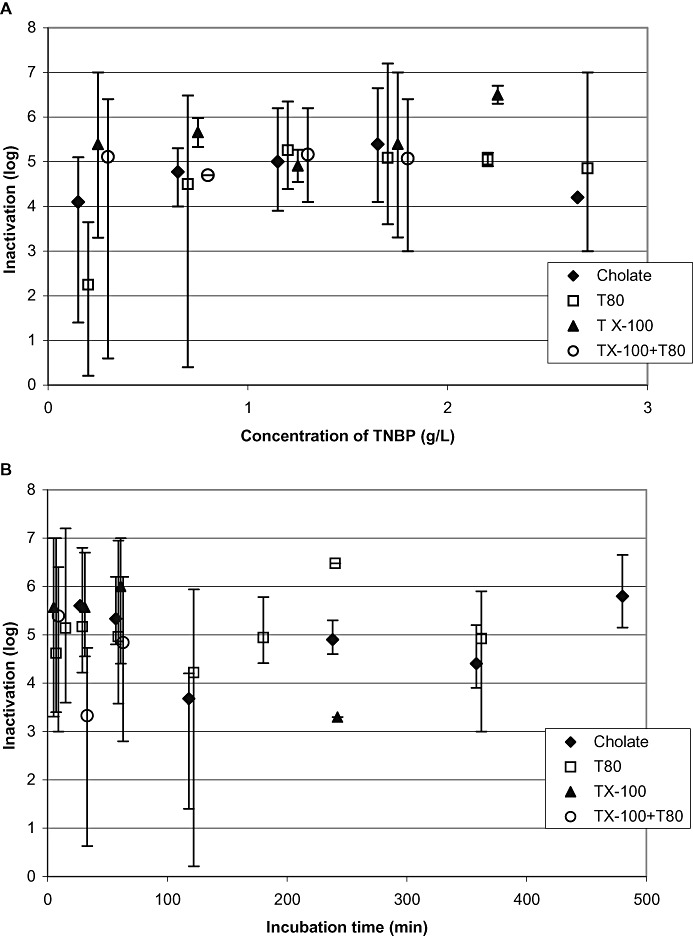
Results of all robustness studies (n = 180): influence of S/D combinations on virus inactivation. (A and B) Different combinations of S/D, plotted versus TNBP concentration and incubation time. Vertical bars show the range of inactivation.
Virus inactivation by S/D treatment at different protein concentrations
A total of 175 studies on robustness were evaluated for the protein concentration. Protein concentration ranged from 3 to 75 g/L with a median value of 30 g/L. Most studies were performed with PRV (n = 74), and another 63 studies were performed with BVDV. The remaining studies were performed with EAV (n = 7), WNV (n = 4), HIV‐1 (n = 24), SINV (n = 3), and SARS‐CoV (n = 1).
Forty‐six studies were performed at protein concentrations between 3 and 9.7 g/L, resulting in LRF values in the range of 2.2 to ≥7.0 log. With a protein concentration of 10 to 40 g/L (n = 56), virus inactivation of 2.8 to 7.0 log was achieved. The majority of studies (n = 74) were performed at protein concentrations between 40 and 75 g/L, and LRF values up to ≥6.8 log were found. LRF values ≤1.0 log (nonsignificant) were only found at drastically reduced S/D concentrations. Any potential impact of protein concentration on virus inactivation was not observed (Fig. 7C).
Figure 7.
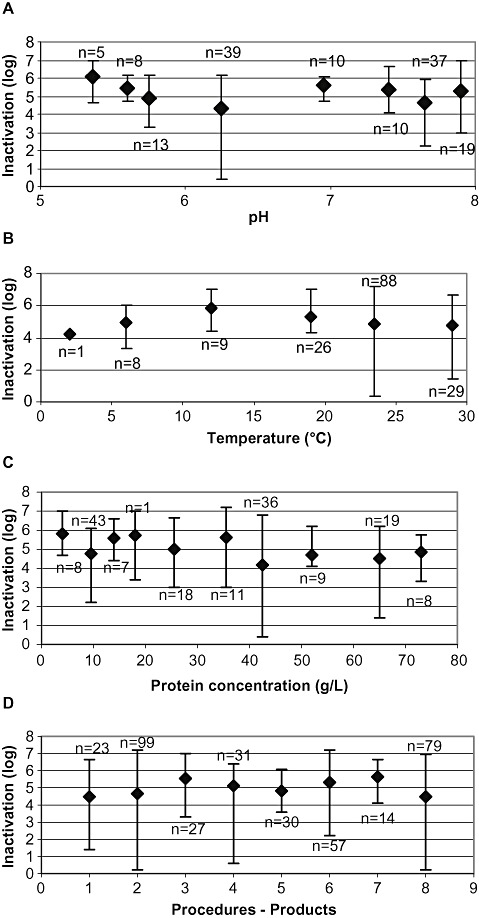
Influence of process parameters on virus inactivation in robustness studies. (A) Virus mean reduction factors plotted versus pH, (B) versus incubation temperature, (C) versus protein concentration, and (D) procedures and products. Data of studies performed at TNBP concentrations of less than 10% of the standard concentration under production conditions are not shown. Vertical bars show the range of inactivation.
Virus inactivation by S/D treatment at different pH values
A total of 160 studies on robustness were evaluated for the potential influence of pH on virus inactivation. Robustness studies, irrespective of all other process variables, were performed in the range of pH 4.9 to pH 7.5. Virus inactivation was achieved up to ≥7.0 log. Variations in pH values did not result in a reduced viral inactivation capacity (Fig. 7A). As observed for the protein concentration, virus reduction values ≤1.0 log (nonsignificant) were only found at drastically reduced S/D concentrations.
Virus inactivation by S/D treatment at different incubation temperatures
In total, 180 robustness studies were conducted to evaluate the influence of incubation temperature on virus inactivation. The majority of the robustness studies (n = 138) were performed between 20 and 30°C, resulting in LRF values of up to ≥7.2 log. Thirty‐four studies covered the range from 10 to 19.8°C (LRF values, 3.0 to ≥6.8 log) and nine studies were performed at incubation temperatures between 2 and 6°C (LRF values up to ≥7.2 log). No influence of incubation temperature on virus inactivation was found in the range tested (Fig. 7B). LRF values ≤1.0 log (nonsignificant) were only found at drastically reduced S/D concentrations.
Influence of low S/D concentration on virus inactivation
In total, 49 of 308 studies were performed with significantly reduced concentrations of TNBP/detergent(s), that is, 25% or less of the concentration at production scale, corresponding to 0.75 g/L instead of 3 g/L. Studies were performed with IVIG and IMIG (n = 33), FVIII (n = 13), and F IX (n = 3). Virus inactivation data are shown in Fig. 8A, plotted versus the concentration of TNBP. Other variables such as incubation temperature (6.0‐30°C), protein concentration (8‐72 g/L), pH value (pH 5.1‐7.5), and incubation time (1‐240 min) were not taken into consideration.
Figure 8.
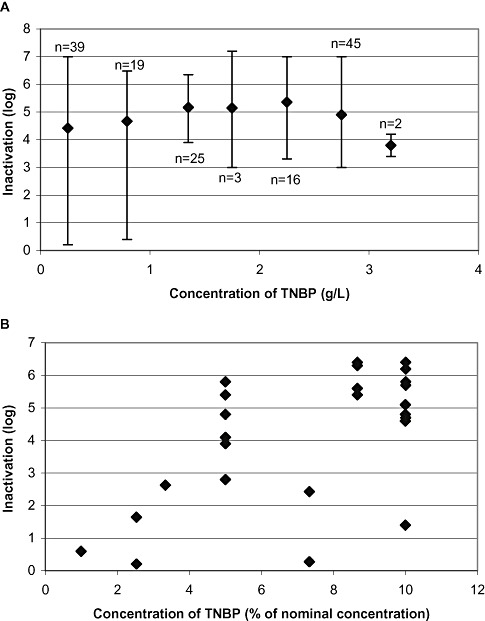
Influence of reduced TNBP concentrations on virus inactivation in robustness studies. (A) Virus inactivation studies under robustness conditions (n = 180); mean values are plotted versus the concentration of TNBP. (B) Only the results of studies with concentrations of TNBP of 10% or less of the standard concentration at production scale are shown (n = 29; LRF of 4.6, 4.8, 5.4, and 6.3 log are shown twice; LRV of 5.8 and 6.4 log are shown three times). Reduced concentration of TNBP also implies a reduced concentration of detergent.
Twenty‐nine studies were even performed at a TNBP concentration of 10% or less of the standard concentration. In the majority of studies (n = 20), inactivation of virus to below the limit of detection and/or inactivation by ≥4 log was demonstrated (Fig. 8B). In only nine studies was virus inactivation by less than 4 log or residual infectivity found.
Some studies were performed with elevated Tween 80 concentrations (up to 18 g/L). No influence of elevated detergent concentration on virus inactivation was observed.
DISCUSSION
The consolidated results for virus inactivation by S/D treatment presented here by the seven PPTA member companies demonstrate the efficacy and the robustness of the S/D technology, which is applied in the manufacture of many medicinal products derived from human plasma for more than two decades. Data were collected for four products (FVIII, F IX, IVIG, and IMIG), as those products are commonly manufactured by all companies and they represent the most licensed products.
Products
Although the investigated products tremendously differ in their biochemical composition and properties, a potential influence on virus inactivation was not observed (Fig. 3). Under production conditions, all mean values of virus inactivation are in the same narrow range of 5 to 6 log. When the data of studies at robustness conditions were plotted versus the TNBP concentration (Fig. 5), virus inactivation by less than 3 log was observed for IVIG at only significantly reduced concentrations of S/D in a very few studies. This might be explained by the higher number of studies performed for IVIG at low concentrations of S/D, compared to the smaller number of data available for FVIII and F IX under those conditions. At concentrations of TNBP higher than 10% of the nominal concentration, a potential influence of the different products on mean values of virus inactivation cannot be identified.
Combinations of TNBP and detergent(s)
Regardless of the products or the combinations of TNBP with Na‐cholate, Tween 80, Triton X‐100, or Triton X‐100 plus Tween 80, test viruses were effectively inactivated under a broad range of conditions. A potential influence of different combinations of solvent and detergent(s) was not found under production conditions (Fig. 3). In Fig. 5 for robustness studies, virus inactivation by different combinations of S/D is plotted versus the incubation time and late time points might indicate slower kinetics of virus inactivation. However, the data comprising only the first time point of virus inactivation to below limit of detection allow no conclusions on the kinetics of inactivation or efficiency of the different combinations of solvent and detergent(s). In Fig. 5, when the virus inactivation capacity is plotted versus the TNBP concentration, some low LRF values (≤3 log) were observed for low concentrations of TNBP in combination with Tween 80. Again, the reason for those findings might be that most studies at low concentrations of TNBP were done for the combination of TNPB/Tween 80. Thus, a potential influence might be feigned by the smaller number of data for other combinations of S/D. A potential influence of the different combinations on mean values of virus inactivation cannot be identified. Also, when data are plotted versus incubation time, the mean values of inactivation scatter around a magnitude of 4 log inactivation or higher. However, short incubation times in robustness studies result in a larger range of inactivation values.
Process variables: pH, temperature, and protein concentration
No influence of pH on virus inactivation was observed in the range from pH 4.2 to pH 8.0 (Fig. 7A). Data indicate that pH has no perceptible influence on efficacy of S/D treatment. Investigations beyond this range are useless, because plasma derivatives (e.g., clotting factors) are very sensitive to extreme pH values. In addition, there was no obvious influence of the protein concentration (Fig. 6C) on virus inactivation efficacy for the range from 3 to 84 g/L.
Incubation temperatures from 2 to 32°C were investigated. In all cases, where low temperatures (≤20°C) were tested, no obvious influence on inactivation of test viruses was observed, not even at 2°C (Fig. 7B). However, Seitz et al. 15 described significantly delayed virus inactivation at 6°C, when comparing combinations of TNBP with tallow‐derived and vegetable‐derived Tween 80. The studies presented here on incubation temperatures lower than 10°C were performed with a combination of TNBP and Triton X‐100 and for IVIG only. Thus, the efficacy at low temperatures shown in Fig. 7B might be specific for the product and the TNBP/Triton X‐100 combination. Figure 7 demonstrates that all mean values of inactivation are in the range between 4 and 6 log. Thus any potential influence of pH, protein concentration, and temperature in the given range on virus inactivation cannot be identified.
Incubation time
At production scale, S/D treatment is performed for at least 60 minutes, but for most products considerably longer (usually 6 hr or more). In virus validation studies, incubation periods are usually shorter than at production scale because inactivation of viruses to below limit of detection is achieved already after a few minutes of exposure to S/D (1, 2). Short incubation times represent worst‐case conditions.
In 1, 2, 4, 5, 6 the virus inactivation capacities are plotted versus the incubation time. The data illustrate that effective virus inactivation is achieved rapidly within the first minutes of S/D treatment. Therefore, rapid inactivation of enveloped viruses results in a high margin of safety at production scale due to the remaining time, still available after virus inactivation to below limit of detection.
Concentrations of solvent and detergent
As the only parameter that might influence virus inactivation, the concentration of TNBP was found critical (Fig. 8A). Reduced concentrations of TNBP as 0.75 g/L, corresponding to 25% of the standard concentration of 3 g/L, did not reveal any significant influence on inactivation of test viruses. However, TNBP concentrations of 25% of the standard concentration can result in delayed kinetics of inactivation. As expected, drastically reduced TNBP concentrations lower than 10% of the standard concentration failed to inactivate some test viruses, for example, PRV and/or BVDV, to below limit of detection, or LRF values were lower than 4 log in 9 of 29 studies (Fig. 8B). However, in the majority of studies (20 of 29) effective virus inactivation by 4 log or higher was demonstrated, even at TNBP concentrations lower than 0.75 g/L.
In robustness studies with significantly reduced concentration of TNBP (≤10% of the standard concentration), the limits of S/D treatment became obvious: low concentration of TNBP is a critical variable. As TNBP is essentially combined with detergents, a reduced concentration of TNBP also implies reduced concentrations of detergents. A potential influence of detergent alone or of decreasing concentrations of detergent at a standard concentration of TNBP was not addressed in the studies presented here. TNBP is almost insoluble in aqueous solutions; thus a sufficient amount of detergent is essential for efficient virus inactivation. Elevated concentrations of Tween 80 in a FVIII solution up to 1.8% (18 g/L) instead of 1% (10 g/L) had no influence on PRV inactivation after 60 minutes of treatment.
Kinetics of virus inactivation
The mean values of inactivation in 1, 2, 4 for the time points of 30 minutes or less demonstrate rapid kinetics of virus inactivation within the first minutes of treatment, as shown by the mean values of inactivation. However, the range of inactivation is larger and comprises even a few values of low reduction, as incubation times of 30 and 120 minutes show, but with mean LRF values of >4 log.
The studies on inactivation of WNV and SARS‐CoV reveal that emerging enveloped viruses are also reliably inactivated by the S/D treatment and confirm the validity of the model virus concept in virus validation. Two studies were performed on the inactivation of VacV. It was previously reported that VacV might be less sensitive to S/D treatment because of the special structure of the virus particle. 16 In the two studies presented here, VacV was effectively inactivated by the combinations of TNBP/Tween 80 and TNBP/Na‐cholate. However, with only two studies, available data are very limited and might need further confirmation.
Any obvious resistance of test viruses to S/D treatment was not observed. For future robustness studies, BVDV and PRV may be recommended as preferred test viruses, as a limited inactivation capacity could be demonstrated for these viruses in robustness studies at low TNBP concentrations (Fig. 8B). It should be emphasized that in all studies in which S/D treatment was performed under production conditions, no residual infectivity after treatment was observed, irrespective of the class of product and of the combination of solvent and detergent. With S/D concentrations of 3 to 10 g/L, at protein concentrations between 8 and 75 g/L, at a temperature range between 15 and 30°C—for the combination of TNBP/Triton X‐100 even at lower temperatures—and pH values between 5.2 and 7.5 reliable inactivation of enveloped viruses can be achieved during 1 to 9 hours' incubation time.
When only data were evaluated with an inactivation of >5 log after 60 minutes' incubation time, 86 studies remain. The process variables and the minimal concentrations of TNBP and detergent are listed in Table 4. Those data might be limited by the test conditions and test strategy of the different laboratories, but they indicate that even with low concentrations of TNBP and detergent (0.15‐1.5 g/L) effective inactivation is achieved after short incubation times.
Table 4.
Process variables of studies with greater than 5 log inactivation within 60 minutes' incubation time
| Variables | Na‐cholate (n = 6) | Tween 80 (n = 17) | Triton X‐100 (n = 22) | Triton X‐100 plus Tween 80 (n = 42) |
|---|---|---|---|---|
| Minimal concentration of TNBP(g/L) | 0.6 | 1.5 | 0.3 | 0.15 |
| Minimal concentration of detergent (g/L) | 0.4 | 5.0 | 0.5 | 0.53 |
| Range of protein concentration (g/L) | 60 to 70 | 5 to 45 | 3 to 72 | 10 to 55 |
| Range of temperature (°C) | 28 | 23 to 25.5 | 6 to 30 | 10 to 24 |
| Range of pH | 5.6 to 7.0 | 4.9 to 7.1 | 5.3 to 7.5 | 4.2 to 7.5 |
Based on 308 studies on S/D treatment, it can be concluded that pH, product class, protein concentration, and even low incubation temperature have no significant influence on the virus inactivation capacity. Drastically reduced concentrations of TNBP/detergent, tested in robustness studies and far below production specification, were identified as the only critical variable.
In conclusion, the data presented here demonstrate the robustness, reliability, and efficacy of S/D treatment as an established technology to completely inactivate enveloped viruses such as HIV, WNV, HBV, HCV, and SARS‐CoV and model viruses such as SINV, BVDV, PRV, EAV, or VSV. Based on the model virus concept these data provide assurance that also emerging enveloped viruses, for example, SARS‐CoV 17 or WNV, are inactivated by S/D treatment.
Furthermore, these data emphasize the efforts of the plasma product industry as a whole to ensure the viral safety of their products. As a consequence, as of today there have been no documented transmissions of enveloped viruses such as HIV, HBV, HCV, or other enveloped viruses by any S/D‐treated plasma‐derived medicinal product. The laboratory data presented here confirm the long clinical experience.
In general, the manufacturing process of plasma derivatives include S/D treatment in conjunction with other effective virus inactivation/removal procedures such as heat treatment 18 or virus filtration. 19 These orthogonal viral safety measures have proven as highly effective in reducing if not eliminating the risk of transmission of enveloped viruses throughout the industry.
CONFLICT OF INTEREST
The authors certify that they have no affiliation with or financial involvement in any organization or entity with a direct financial interest in the subject matter or materials discussed in this paper.
Supporting information
APPENDIX: DATA OF VIRUS VALIDATION STUDIES
Please note: Wiley‐Blackwell are not responsible for the content or functionality of any supporting materials supplied by the authors. Any queries (other than missing material) should be directed to the corresponding author for the article.
Supporting info item
ACKNOWLEDGMENTS
The authors thank Andreas Immelmann and Rolf Klengel (Octapharma) for reviewing the manuscript, Eckhard Flechsig (Biotest) for his help in preparing the graphs, Holger Rabenau (Institute of Virology, Frankfurt am Main, Germany) for performing the study with SARS‐CoV, and the colleagues from PPTA in Brussels for collecting and anonymizing the data. In particular, the authors thank all those technicians in the labs, who diligently performed the virus inactivation studies.
REFERENCES
- 1. Prince AM, Horowitz B, Horowitz MS, Zang E. The development of virus‐free labile blood derivatives—a review. Eur J Epidemiol 1987;3:103‐18. [DOI] [PubMed] [Google Scholar]
- 2. Prince AM, Horowitz B, Brotman B, Huima T, Richardson L, van den Ende M. Inactivation of hepatitis B and Hutchinson strain non‐A, non‐B hepatitis viruses by exposure to Tween 80 and ether. Vox Sang 1984;46:36‐43. [DOI] [PubMed] [Google Scholar]
- 3. Prince AM, Horowitz B, Brotman B. Sterilization of hepatitis and HTLV III viruses by exposure to tri‐(n‐butyl) phosphate and sodium cholate. Lancet 1986;i:706‐10. [DOI] [PubMed] [Google Scholar]
- 4. Horowitz B, Wiebe ME, Lippin A, Stryker MH. Inactivation of viruses in labile blood products I. Disruption of lipid enveloped viruses by tri (n‐butyl) phosphate detergent combinations. Transfusion 1985;25:516‐22. [DOI] [PubMed] [Google Scholar]
- 5. Alonso WR, Trukawinski S, Savage M, Tenold RA, Hammond DJ. Viral inactivation of intramuscular immune serum globulins. Biologicals 2000;28:5‐15. [DOI] [PubMed] [Google Scholar]
- 6. Horowitz B, Prince AM, Horowitz MS, Watklevicz C. Virus safety of solvent‐detergent treated blood products In: Brown F, editor. Virological safety aspects of plasma derivatives. Dev Biol Stand 1993;81:147‐61. Basel: Karger. [PubMed] [Google Scholar]
- 7. Griffith M. Ultrapure plasma factor VIII produced by anti F VIIIc immunoaffinity chromatography and solvent/detergent viral inactivation. Characterization of the Method M process and Hemofil M antihemophilic factor (human). Ann Hematol 1991;63:131‐7. [DOI] [PubMed] [Google Scholar]
- 8. Biesert L. Virus validation studies of immunoglobulin preparations. Clin Exp Rheumatol 1996;14 Suppl 15:S47‐S52. [PubMed] [Google Scholar]
- 9. Committee for Proprietary Medicinal Products . Note for guidance on virus validation studies: The design, contribution and interpretation of studies validating the inactivation and removal of viruses (CPMP/BWP/268/95 rev).
- 10. Committee for Proprietary Medicinal Products . Note for guidance on plasma‐derived medicinal products (CPMP/BWP/269/95, rev. 3).
- 11. ICH harmonised tripartite guideline: virus safety of biotechnology products derived from cell lines of human or animal origin Q5A. Geneve: ICH Steering Committee; 1997. [PubMed] [Google Scholar]
- 12. Horowitz B, Minor P, Morgenthaler JJ, Burnouf T, McIntosh R, Padilla A, Thorpe R, van Aken WG; WHO Expert Committee on Biological Standardization . WHO Expert Committee on Biological Standardization. World Health Organ Tech Rep Ser 2004;924:1‐232. [PubMed] [Google Scholar]
- 13. Dichtelmüller H, Germer M, Rudnick D. A general approach to robustness studies. BioProcess Int 2005;Suppl:35‐8. [Google Scholar]
- 14. Kaerber G. Beitrag zur kollektiven Behandlung pharmakologischer Reihenversuche. Arch Exp Pathol Pharmakol 1931;162:480. [Google Scholar]
- 15. Seitz H, Blümel J, Willkommen H, Löwer J. Comparable virus inactivation by bovine or vegetable derived Tween 80 during solvent/detergent treatment. Biologicals 2002;30:197‐205. [DOI] [PubMed] [Google Scholar]
- 16. Roberts P. Resistance of Vaccinia virus to inactivation by solvent/detergent treatment of blood products. Biologicals 2000;28:29‐32. [DOI] [PubMed] [Google Scholar]
- 17. Rabenau HF, Biesert L, Schmidt T, Bauer G, Cinatl J, Doerr HW. SARS‐corona virus (SARS‐CoV) and the safety of a solvent/detergent treated immunoglobulin preparation. Biologicals 2005;33:95‐9. [DOI] [PMC free article] [PubMed] [Google Scholar]
- 18. Dichtelmüller H, Rudnick D, Breuer B, Kotitschke R, Kloft M, Darling A, Watson E, Flehmig B, Lawson S, Frösner G. Improvement of virus safety of a S/D treated Factor VIII concentrate by additional dry heat treatment at 100°C. Biologicals 1996;24:125‐30. [DOI] [PubMed] [Google Scholar]
- 19. Burnouf‐Radosevich M, Appourchaux P, Huart JJ, Burnouf T. Nanofiltration, a new specific virus elimination method applied to high‐purity factor IX and factor XI concentrates. Vox Sang 1994;67:132‐8. [DOI] [PubMed] [Google Scholar]
Associated Data
This section collects any data citations, data availability statements, or supplementary materials included in this article.
Supplementary Materials
APPENDIX: DATA OF VIRUS VALIDATION STUDIES
Please note: Wiley‐Blackwell are not responsible for the content or functionality of any supporting materials supplied by the authors. Any queries (other than missing material) should be directed to the corresponding author for the article.
Supporting info item


