Abstract
Defocusing, vignetting, and bulk motion degrade the image quality of optical coherence tomography angiography (OCTA) more significantly than structural OCT. The assessment of focus, alignment conditions, and stability of imaging subjects in commercially available OCTA systems are currently based on OCT signal quality alone, without knowledge of OCTA signal quality. This results in low yield rates for further quantification. In this Letter, we developed a novel OCTA platform based on a graphics processing unit (GPU) for a real-time, high refresh rate, B-san-by-B-scan split-spectrum amplitude-decorrelation angiography. The GPU provides a real-time display of both cross-sectional and en face images to assist operators during scan acquisition and ensure OCTA scan quality.
Optical coherence tomography (OCT) angiography (OCTA) is a functional extension of OCT that visualizes vascular flow in the retina [1–4]. In contrast to fluorescein angiography, which has historically been used to image retinal blood flow, OCTA provides three-dimensional (3D) capillary details and is non-invasive. However, the image quality of OCTA depends critically on artifact suppression. Since, in commercial systems, only the OCT images are generated in real time, the OCTA image defects cannot be corrected during imaging, even though the prevalence of artifacts could be reduced by proper adjustment of the imaging system or by improving subject comfort. In particular, artifacts caused by defocusing, vignetting, and bulk motion are hard to see directly from OCT images, but can seriously decrease OCTA image quality. Because OCTA requires more computational resources than OCT, the time cost to generate OCTA images is usually more than 10 s in commercial systems, an inadequate time lag for on-the-fly instrument adjustment. Recently, a graphics processing unit (GPU)-based real-time OCT [5–8] and OCTA processing and display have been developed. These methods improved OCTA [9–11] image processing speed by applying parallel computation to measure speckle variance and retrieve retinal blood flow. However, due to the limitation of data transfer speed and GPU performance, the OCT data must be processed block by block, which does not allow high frame refresh rates or real-time display of OCTA B-scans. To better assist the OCT operator in monitoring OCTA artifacts (motion, defocus, vignetting), high-speed and high-quality B-scan-by-B-scan real-time OCTA processing is required. In particular, a higher frame refresh rate will have less lag time when the instrument is adjusted, making such adjustments practical by providing valuable feedback during instrument realignment. Making such adjustments possible during data acquisition (DAQ) can significantly improve the quality of data (by addressing and correcting artifacts in real time) and improve the imaging experience for patients (since they will have to re-do scans less often). In this Letter, we present a novel GPU-based, multithread, real-time, B-scan-by-B-scan OCTA image display and acquisition program that adapts system hardware to optimize image quality, even with the high computational demands of OCTA data processing.
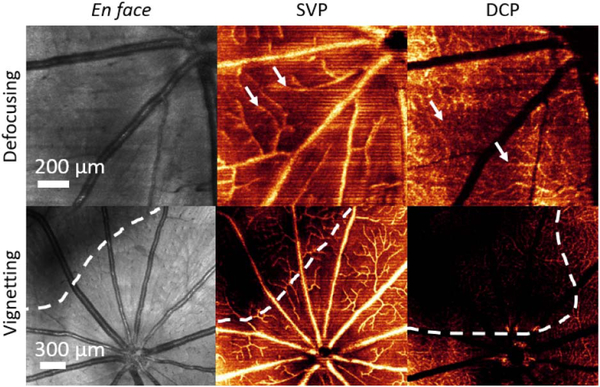
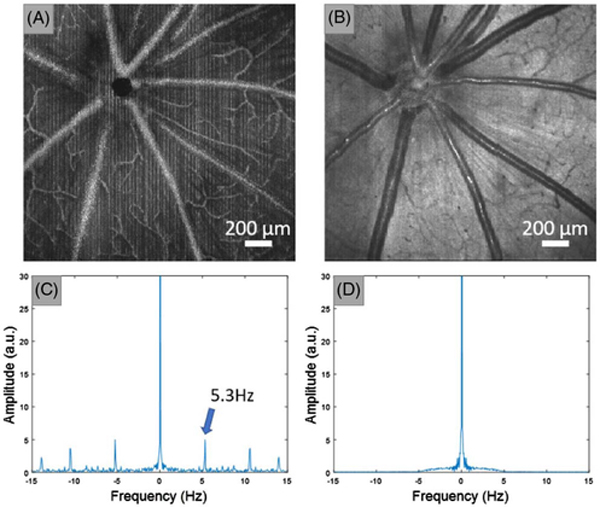
Structural OCT and OCTA are computed by different signal processing algorithms; therefore, they have different sensitivities to various artifacts. In this Letter, we constructed OCTA images using the split-spectrum amplitude decorrelation angiography (SSADA) algorithm [1]; the SSADA is highly efficient which aids in real-time processing. As can be seen in Fig. 1, defocusing, vignetting, and motion are more obvious in OCTA than in OCT structural images. On en face OCT structural images, defocusing artifacts can only be inspected from the sharpness of large vessels. However, on en face OCTA, the operator can examine defocusing problems from the appearance of small and medium-sized vessels, as well as the large ones. Pupil vignetting causes a relatively lower signal intensity on the corners of en face OCT structural images, but has a more significant effect on en face OCTA (Fig. 1), and is especially evident in angiograms of the deep capillary plexus (DCP). Motion is another major artifact that decreases the OCTA image quality [12]. The effect of gross movement can be sometimes be observed by the discontinuities of large vessels on en face OCT structural images, but small movements, such as those caused by cardiac pulsation, ocular drift, and tremors are not observable. Such motion is unavoidable in human imaging. In the case of animal imaging, they can be a sign of animal discomfort, mechanical instabilities, or ineffective anesthesia, and actions can be taken to reduce or even avoid them. For instance, in rat retinal imaging, using ultra-high axial resolution visible-light OCT, heartbeat-induced motion is a common artifact. Compared to other motion artifacts, heartbeats are hard to identify on OCT structural images. By applying real-time OCTA, the high prevalence of motion artifacts can be clearly observed as line artifacts prior to data recording (Fig. 2).
Fig. 1.
En face images of structural OCT and OCT angiograms showing the effects of defocusing and vignetting artifacts. The SVP and DCP are generated from OCTA images. The SVP is defined as the inner 80% of the ganglion cell complex, whereas the DCP is defined between the outer 50% of the inner nuclear layer and the outer plexiform layer [13]. The white arrows indicate the defocused medium and small vessels; the dotted outlines mark the region of the vignetting artifacts.
Fig. 2.
Motion artifact induced by heartbeats. The heart rate of rats is approximately 5 Hz (beats/s), which is slow compared to the OCT B-scan rate 98 Hz (scans/s). Thus, the heart beating can only be observed every 20 scans which manifests as the line patterns in OCTA en face images. OCTA images were first averaged along the fast axis, and a DFT was then applied to extract the frequency component of the en face image along the slow axis. The motion artifacts can be observed by additional harmonic frequencies other than the zero-hertz component. (A) En face maximum projection of OCTA. (B) En face average projection of OCT reflectance. (C) Averaged FFT of image (A) along the slow axis direction. (D) Average FFT of panel (B) along the slow axis direction. The numbers in panel (C) indicate the frequency component of the rat heartbeat.
Although uncommon in animal imaging, microsaccadic motion is very common during clinical imaging and severely interferes with OCTA image quality. The flow signal from bulk motion artifacts are extremely high and appear as bright stripes on en face angiograms, but are not very discernable on structural OCT. Real-time B-scan-by-B-scan OCTA can reveal these motions and provide feedback to guide better acquisition.
To verify that en face OCTA is a more sensitive indicator of image quality than structural OCT, we analyzed 138 OCTAs from nine healthy Brown Norway rats. All the experimental procedures were approved by the Institutional Review Board/Ethics Committee, as well as the Institutional Animal Care and Use Committee of Oregon Health & Science University. The images were acquired without real-time OCTA optimization, and the data quality varied. Scans were taken with our custom-built, visible-light OCT system [14] with an axial resolution close to 1 μm. The signal strength index (SSI) was calculated using the mean value of the en face mean value projection OCT structural images and the maximum value en face OCTA projection across each A-scan:
| (1) |
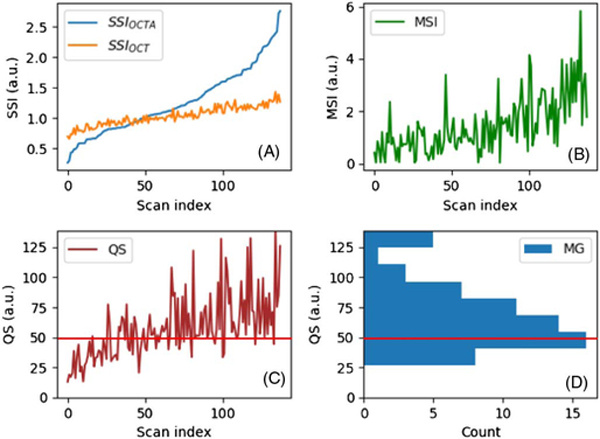
The data were sorted by the SSIOCTA and plotted in Fig. 3(A). The coefficient of variation the 138 data sets,
| (2) |
was calculated for both SSIOCT and SSIOCTA. The coefficient of variation (CV) of the OCTA images (0.42) was three times the CV of the OCT images (0.14). These results show that the SSIOCTA is more sensitive to image quality than the SSIOCT.
Fig. 3.
(A) Plot of the SSIOCT and SSIOCTA. The scan index is the data number index of the rat retinal image. (B) Plot of the MSI. (C) Plot of the QS. (D) Histogram of the QS for “acceptable” images. The red line indicates the cutoff score.
Motion artifacts can also be quantitatively evaluated by a motion strength index (MSI), calculated from en face OCTAs. First, the OCTA en face image was averaged along the fast axis direction. In this way, most of the flow and structure information was cancelled out, and the image was then converted to a one-dimensional array. After thresholding the low frequency portions (<3.3 Hz) and noise, the MSI was obtained by summing the values of the discrete Fourier transform (DFT) according to
| (3) |
The MSI was calculated on each of the 138 rat retinal scans [Fig. 3(B)]. A comparison of Fig. 3(A) with Fig. 3(B) indicates that images with both a low or high SSIOCTA can carry a large MSI value due to large motion artifacts.
It is known that the SSI is correlated with the image quality [4]. We found that the SSIOCT, SSIOCTA, and MSI are correlated, but also represent different aspects of image quality [Figs. 3(A) and 3(B)]. A more sophisticated score is needed to better evaluate the overall image quality. Therefore, a “quality score” (QS) was defined using as
| (4) |
To verify that the QS is related to the image quality, the 138 rat retinal images were masked and manually graded as “acceptable” and “unacceptable,” depending on the image quality. A histogram was generated using the “acceptable” images only. By comparing the histogram [Fig. 3(D)] and the QS plot [Fig. 3(C)], we found that manually graded “acceptable” images were highly correlated with the scans having a QS larger than 25 (no “acceptable” images had a QS smaller than 25), and the histogram distribution suggested that 50 can be used as the QS cutoff in future studies.
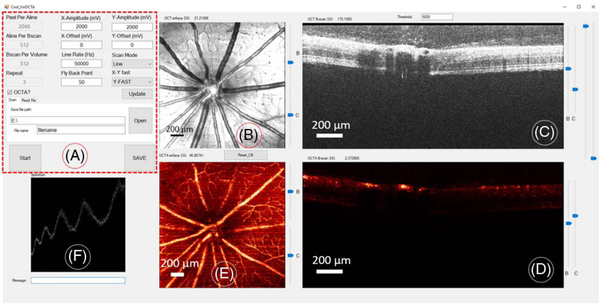
The real-time OCTA software was developed under the Visual C++ 2015 environment using a multi-thread GPU accelerated algorithm with CUDA [15]. The program contained several CPU (host) threads and two GPU (device) threads. The host threads contained a system graphical user interface (GUI) thread to communicate with the OCT operator and to set up different scanning parameters for image acquisition. The system GUI also contained three threads to display the spectrum, the OCT images, and the OCTA images (Fig. 4). A galvanometer mirror controller and DAQ threads were also included in the software.
Fig. 4.
Real-time OCTA scanning and DAQ software GUI. (A) Control panel. (B) En face OCT reflectance image. (C) OCT B-frame. (D) OCTA B-frame. (E) En face maximum projection OCTA image. (F) OCT raw spectrum.
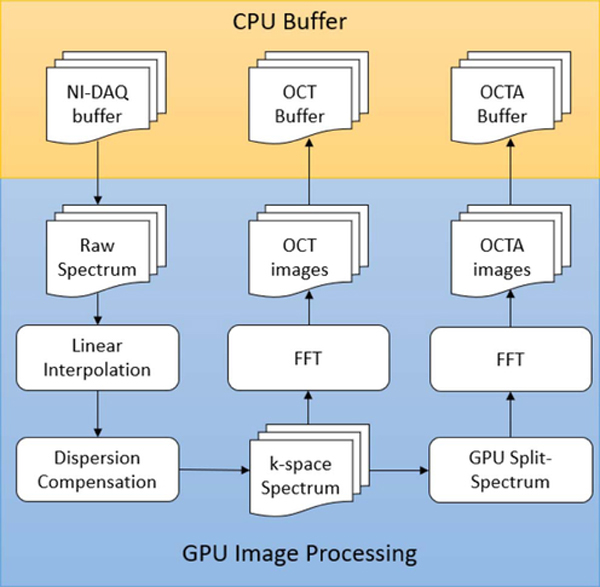
Software features included customization of the scanning rate, size, and density depending on the application, and the OCTA function would be active only when the number of repeated B-scans was set larger than two. To achieve real-time OCTA data processing, the GPU processor was used to compute the OCT reflectance and flow signal after the acquisition of each set of frames at the same location and within the duration used for B-frame acquisitions in the next position. In the GPU, the sampling interval of the raw spectrum data was first converted to k-space by applying a GPU-based linear interpolation. A GPU-based dispersion compensation method was then applied to the k-space spectrum (Fig. 5).
Fig. 5.
Flow chart of multi-thread GPU OCTA. The DAQ, OCT, and OCTA buffers are located in the CPU memory (indicated by the yellow box). The data processing and temporary data storage are located in the GPU memory (indicated by the blue box).
The newly generated data were then processed by two GPU threads: the GPU OCT thread and the GPU OCTA thread. In the GPU OCT thread, the data were transformed to reflectance images using FFT and transferred back to the host memory for display. In the GPU OCTA thread, the data were multiplied by a split-spectrum matrix containing 11 narrow Gaussian masks centered at different locations. The new split spectra were then transformed to reflectance amplitude images using an FFT. The final step was the computation of OCTA signals using the decorrelation method [1]. The en face OCTA image was then generated by maximum projection along the axial direction.
The software was integrated in our 560 nm center wave-length visible OCT system with a 50 kHz A-line scan rate for animal imaging. The scanning volume was customized to 2048 × 512 voxels per B-scan. Each volume contained 512 B-scans with three repeats at each location. The data processing speed was measured using a NVIDIA Visual Profiler. The time interval between each data processing and transfer was about 4 ms using single NVIDIA GTX1080ti graphic card, which is much shorter than the 30 ms used for B-frame acquisition at each position. The highest frame refresh rate is 250 Hz. It allows a shorter response time and has a potential to be used in a real-time motion and artifact correction system.
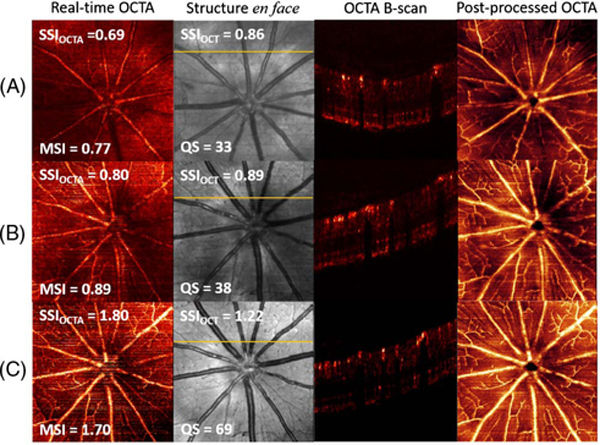
An example shows how real-time OCTA can guide scan acquisition (Fig. 6). During the imaging process, our real-time OCTA DAQ program demonstrated defocusing and vignetting problems based on real-time en face and B-frame OCTA. With real-time guidance, the OCT operator applied proper focus and alignment adjustments to achieve the best image quality. To better evaluate OCTA scan quality, the scans were also post-processed and segmented by our custom-developed segmentation software [16]. Significant image quality improvement can be observed from scans in row A to row C (Fig. 6), through real-time OCTA images and superficial vascular plexus (SVP) angiograms.
Fig. 6.
Example images without adjustment (row A), after adjusting the focus (row B), and after adjusting both focus and alignment (row C). Real-time en face maximum projection OCTA images and en face mean projection reflectance images were captured in real time during DAQ. The superficial vascular complex angiograms were post-processed after manual segmentation. The OCTA B-frames were selected from the position indicated by the yellow line in the en face structure images. The SSI values from the real-time en face OCT, OCTA, and MSI of OCTA also demonstrated the improvement of scan qualities.
In summary, a real-time, high frame refresh rate, B-scan-by-B-scan OCTA program was successfully developed and applied to retinal angiography in rodents. It provides a valuable tool to help guide the adjustment of the OCT module position by correcting vignetting and defocusing, and improved the OCTA scan yield rate by checking subject motion conditions. It is an important advance in OCTA technology and a great basis for clinical real-time OCTA.
Acknowledgment.
Oregon Health & Science University (OHSU), David Huang and Yali Jia have a significant financial interest in Optovue, Inc. These potential conflicts of interest have been reviewed and managed by OHSU.
Funding.
National Institutes of Health (NIH) (P30 EY010572, R01 EY010145, R01 EY023285, R01 EY024544, R01 EY027833); William and Mary Greve Special Scholar Award from Research to Prevent Blindness (RPB); Unrestricted departmental funding grant.
REFERENCES
- 1.Jia Y, Tan O, Tokayer J, Potsaid B, Wang Y, Liu JJ, Kraus MF, Subhash H, Fujimoto JG, and Hornegger J, Opt. Express 20, 4710 (2012). [DOI] [PMC free article] [PubMed] [Google Scholar]
- 2.An L and Wang RK, Opt. Express 16, 11438 (2008). [DOI] [PubMed] [Google Scholar]
- 3.Makita S, Hong Y, Yamanari M, Yatagai T, and Yasuno Y, Opt. Express 14, 7821 (2006). [DOI] [PubMed] [Google Scholar]
- 4.Gao SS, Jia Y, Liu L, Zhang M, Takusagawa HL, Morrison JC, and Huang D, Invest. Ophthalmol. Visual Sci. 57, 4485 (2016). [DOI] [PMC free article] [PubMed] [Google Scholar]
- 5.Viehland C, Keller B, Carrasco-Zevallos OM, Nankivil D, Shen L, Mangalesh S, Kuo AN, Toth CA, and Izatt JA, Biomed. Opt. Express 7, 1815 (2016). [DOI] [PMC free article] [PubMed] [Google Scholar]
- 6.Cho NH, Jung U, Kim S, Jung W, Oh J, Kang HW, and Kim J, J. Opt. Soc. Korea 17, 68 (2013). [Google Scholar]
- 7.Watanabe Y and Itagaki T, J. Biomed. Opt. 14, 060506 (2009). [DOI] [PubMed] [Google Scholar]
- 8.Sylwestrzak M, Szlag D, Szkulmowski M, Gorczynska IM, Bukowska D, Wojtkowski M, and Targowski P, J. Biomed. Opt. 17, 100502 (2012). [DOI] [PubMed] [Google Scholar]
- 9.Xu J, Han S, Balaratnasingam C, Mammo Z, Wong KS, Lee S, Cua M, Young M, Kirker A, and Albiani D, Br. J. Ophthalmol. 99, 1315 (2015). [DOI] [PubMed] [Google Scholar]
- 10.Xu J, Wong K, Jian Y, and Sarunic MV, J. Biomed. Opt. 19, 026001 (2014). [DOI] [PubMed] [Google Scholar]
- 11.Lee KK, Mariampillai A, Joe X, Cadotte DW, Wilson BC, Standish BA, and Yang VX, Biomed. Opt. Express 3, 1557 (2012). [DOI] [PMC free article] [PubMed] [Google Scholar]
- 12.Camino A, Zhang M, Gao SS, Hwang TS, Sharma U, Wilson DJ, Huang D, and Jia Y, Biomed. Opt. Express 7, 3905 (2016). [DOI] [PMC free article] [PubMed] [Google Scholar]
- 13.Campbell J, Zhang M, Hwang T, Bailey S, Wilson D, Jia Y, and Huang D, Sci. Rep. 7, 42201 (2017). [DOI] [PMC free article] [PubMed] [Google Scholar]
- 14.Pi S, Camino A, Zhang M, Cepurna W, Liu G, Huang D, Morrison J, and Jia Y, Biomed. Opt. Express 8, 4595 (2017). [DOI] [PMC free article] [PubMed] [Google Scholar]
- 15.Nickolls J, Buck I, Garland M, and Skadron K, in ACM SIGGRAPH Classes (ACM, 2008), 16. [Google Scholar]
- 16.Zhang M, Wang J, Pechauer AD, Hwang TS, Gao SS, Liu L, Liu L, Bailey ST, Wilson DJ, and Huang D, Biomed. Opt. Express 6, 4661 (2015). [DOI] [PMC free article] [PubMed] [Google Scholar]


