Abstract
Objective
To identify coinhibitory immune pathways important in the brain, we hypothesized that comparison of T cells in lesions from patients with MS with tumor-infiltrating T cells (TILs) from patients with glioblastoma multiforme may reveal novel targets for immunotherapy.
Methods
We collected fresh surgical resections and matched blood from patients with glioblastoma, blood and unmatched postmortem CNS tissue from patients with MS, and blood from healthy donors. The expression of TIGIT, CD226, and their shared ligand CD155 as well as PD-1 and PDL1 was assessed by both immunohistochemistry and flow cytometry.
Results
We found that TIGIT was highly expressed on glioblastoma-infiltrating T cells, but was near-absent from MS lesions. Conversely, lymphocytic expression of PD-1/PD-L1 was comparable between the 2 diseases. Moreover, TIGIT was significantly upregulated in circulating lymphocytes of patients with glioblastoma compared with healthy controls, suggesting recirculation of TILs. Expression of CD226 was also increased in glioblastoma, but this costimulatory receptor was expressed alongside TIGIT in the majority of tumor-infiltrating T cells, suggesting functional counteraction.
Conclusions
The opposite patterns of TIGIT expression in the CNS between MS and glioblastoma reflects the divergent features of the immune response in these 2 CNS diseases. These data raise the possibility that anti-TIGIT therapy may be beneficial for patients with glioblastoma.
Immune checkpoint receptors are a family of coinhibitory receptors that modulate T-cell activation. The interactions between coinhibitory receptors on tumor-infiltrating T cells and their ligands expressed by tumor cells is believed to contribute to the failure of the immune system to reject tumors.1,2 Therapeutic blockade of this interaction has yielded dramatic results in the therapy of multiple cancer types. To date, this has led to FDA approval of 6 immune checkpoint inhibitors that target cytotoxic T-lymphocyte–associated protein 4 (CTLA-4, ipilimumab) and programmed cell death protein 1 and its ligand (PD-1, pembrolizumab and nivolumab; PD-L1, atezolizumab, avelumab, and durvalumab).3–8
To identify coinhibitory pathways that may be important in the CNS, we hypothesized that comparison of T cells in lesions from patients with the autoimmune disease MS with tumor-infiltrating T cells (TILs) of tumor from patients with glioblastoma multiforme (GBM) may reveal novel targets for immunotherapy in patients with CNS tumors. This approach was suggested by the role in coinhibitory and costimulatory pathways in T-cell regulation in preventing activation of autoreactive T cells and by the high incidence of autoimmune manifestations associated with therapeutic blockade of checkpoint inhibitors.9–11 We focused on the T-cell immunoreceptor with Ig and ITIM domains (TIGIT) axis, a recently discovered coinhibitory receptor expressed by activated T cells and natural killer cells, and on PD-1/PDL-1.12,13 TIGIT shapes T-cell function directly by repressing proinflammatory Th1 and Th17 but not Th2 responses14 and indirectly by enhancing dendritic cell production of IL-10.12 TIGIT also prevents costimulatory signaling through CD226 by competing for the same ligand, CD155, and by disrupting CD226 homodimerization.15 Moreover, TIGIT is a marker of highly suppressive regulatory T cells (Tregs) and directly promotes Treg function in environments of Th1 inflammation.16,17 TIGIT has been investigated as a novel candidate target of cancer immunotherapy. Indeed, increased TIGIT has been demonstrated on tumor-infiltrating lymphocytes in a number of cancers including non–small-cell lung cancer and melanoma.15,18 Moreover, TIGIT blockade in animal models and in CD4 and CD8 T cells isolated from human tumors showed reinvigoration of antitumor immune responses.15,19,20 However, TIGIT blockade also has the potential for inducing autoimmune disease, as expression of the competing costimulatory receptor, CD226, is increased on peripheral T cells of patients with rheumatoid arthritis and lupus.21 In addition, a coding variant in the CD226 gene is associated with multiple autoimmune diseases, including MS and rheumatoid arthritis.22 Finally, TIGIT-deficient mice displayed increased susceptibility to developing experimental autoimmune encephalomyelitis (EAE), an animal model of MS,19,23 whereas treatment with a CD226-blocking monoclonal antibody delayed onset and reduced severity of EAE.24
Here, we examined expression of TIGIT, CD226, their shared ligand CD155, and of PD-1 and its ligand PD-L1 in 2 prototypic neoplastic and autoimmune CNS diseases, glioblastoma and MS. Our data show that TIGIT+ T cells were highly prevalent in glioblastoma infiltrates but not in MS lesions, whereas the frequency of PD-1+ and PD-L1+ lymphocytes was comparable in the 2 conditions. Our findings highlight specific differences in immune checkpoint expression between glioblastoma and MS and provide a strong rationale for developing immunotherapy against TIGIT for glioblastoma.
Methods
Tissue and blood samples
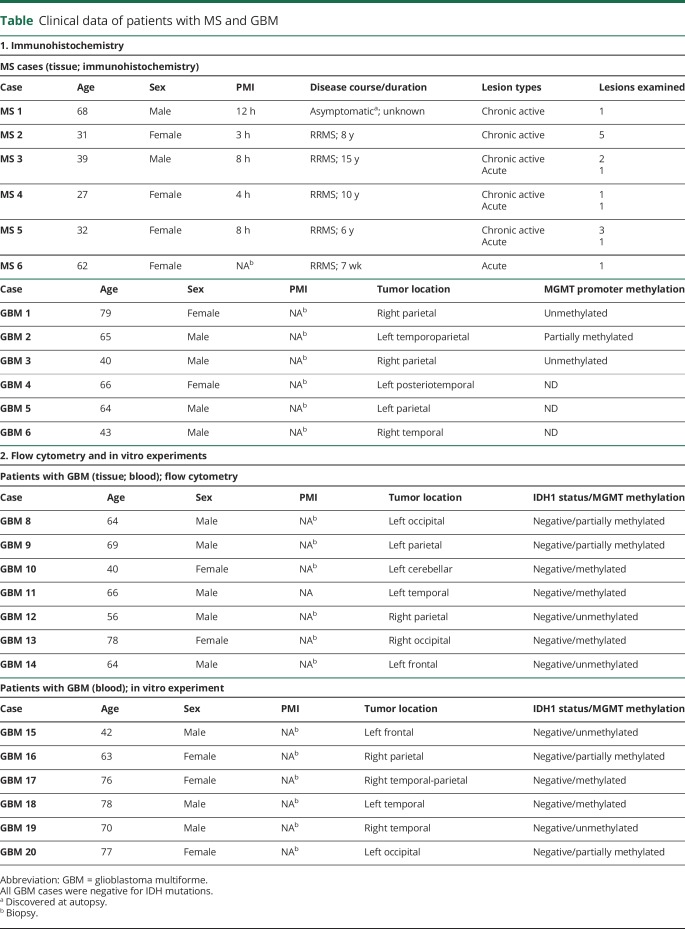
Immunohistochemistry was performed on formalin-fixed tissue from 6 patients with MS (obtained through autopsy) and 6 patients with glioblastoma (resection/biopsy). Flow cytometry was performed on blood from 5 healthy volunteers and on freshly resected glioblastoma tissue and matched blood from 7 patients (1 tumor did not yield enough T cells for analysis, table).
Table.
Clinical data of patients with MS and GBM
Standard protocol approvals, registrations, and patient consents
All samples were collected according to institutional review board–approved protocols conformed to the principles of the WMA Declaration of Helsinki and the Department of Health and Human Services Belmont Report; all patients and healthy volunteers gave informed consent.
Immunohistochemistry
Formalin-fixed paraffin-embedded sections were prepared for immunohistochemistry as described elsewhere.10 Serial sections were stained with primary antibodies against CD68 (Cell Signaling #76437, 1:500), MBP (Millipore Sigma MAB386, 1:500), CD3 (Dako A 40452, 1:200), TIGIT (Santa Cruz sc-103349, 1:800), CD226 (Novus Biologicals NBP1-85001, 1:50), CD155 (Bioss Inc. bs-2525R, 1:750), PD-1 (Acris Antibodies AP23805PU-M, 1:100), and PD-L1 (Spring Bioscience M4420, 1:25) and processed with the appropriate biotinylated secondary antibodies (Vector Laboratories, Burlingame CA) and avidin-biotin staining kit with diaminobenzidine as chromogen. Sections were counterstained with hematoxylin. Images were taken on a Leica DM5000 B microscope with Leica color camera DFC310 Fx Leica Application Suite (version 4.2.0) imaging software. An overview picture of a chronic active MS lesion (MS case 4) is shown in supplementary figure 1, links.lww.com/NXI/A232.
Cellular quantification
We identified multiple areas of lymphocytic infiltration both in the perivascular space and the parenchyma in MS lesion and GBM tissue sections that were immunolabeled with antibody against CD3. In GBM tissue, this included infiltrates in vital tumor tissue and in areas surrounding tissue necrosis. In MS tissue, the vast majority of infiltrates were present in perivascular spaces. In these regions of interest (ROIs), CD3+ cells were quantified manually. The same ROIs were selected in adjacent sections immunolabeled with antibodies against TIGIT, CD226, CD155, PD-1, or PDL-1. Immunolabeled cells with a lymphocytic morphology were manually quantified. We distinguished cells present in the perivascular space, i.e., within the borders of the glia limitans, and in the parenchyma. All cells were counted independently by 3 investigators (D.D., V.P.K., and G.P.), and the counts were averaged. The number of TIGIT-, CD226-, CD155-, PD-1–, or PDL-1–positive cells was correlated with the number of CD3+ lymphocytes found in each ROI.
Flow cytometry
Peripheral blood mononuclear cells were isolated from whole blood by Ficoll-Paque gradient centrifugation. Freshly resected tumor specimens were manually disrupted followed by digestion with collagenase IV (2.5 mg/mL) and DNase I (0.2 mg/mL) (Worthington Biochemical Corporation) for 1 hour. Tumor homogenates were separated on discontinuous 70%–30% Percoll (Sigma-Aldrich) gradients. Flow cytometric analysis was performed with antibodies targeting CD4 (BD Biosciences clone RPA-T4, V450 conjugated), CD8 (BD Biosciences clone RPA-T8, V500 conjugated), TIGIT (eBioscience clone MBSA43, PerCP-eFluor® 710 conjugated), CD226 (eBioscience clone TX25, FITC conjugated), and PD-1 (BD Biosciences clone EH12.1, Alexa Fluor® 647 conjugated). Cell viability was assessed using Live/Dead Cell Viability Assays (Life Technologies). Samples were run on a BD LSRFortessa or BD FACSAria II, as previously described. FlowJo software (Tree Star Inc.) was used for analysis after gating on live cells, with doublet exclusion followed by gating on CD4 and CD8 T cells.
In vitro proliferation assay with TIGIT blockade
Peripheral blood from patients with glioblastoma was obtained on the day of surgery, and mononuclear cells were isolated from whole blood by Ficoll-Paque gradient centrifugation and cryopreserved in GemCell human AB serum (GemBio) with 10% DMSO in liquid nitrogen. After thawing, cells were stained with LIVE/DEAD™ Fixable Dead Cell Stain kit (Invitrogen), αCD4 (clone RPA-T4), αCD8 (clone RPA-T8), αCD25 (clone 2A3), and αCD127 (clone hIL-7R-M21, all from BD Biosciences), and CD4 and CD8 T cells were sorted on a BD FACSAria™ III machine. Tregs (defined as the top 2%–4% CD4+CD25hiCD127lo) were removed from the CD4 gate.
After sorting, cells were stained with CellTrace™ Violet and seeded over round bottom 96-well plates that had been coated with CD3 2 μg/mL (clone UCHT1, BD Biosciences) at 20,000 T cells/well in 200 μL of RPMI 1640 media (Gibco) supplemented with 2 nM l-glutamine, 5 mM HEPES, 100 U/μg/mL penicillin/streptomycin (Biowhittaker), 0.5 mM sodium pyruvate, 0.05 mM nonessential amino acids (Life Technologies; complete RPMI), and 5% GemCell human AB serum (GemBio) with soluble agonistic αCD28 antibody (clone 28.2, BD Biosciences) at 1 μg/mL, and blocking αTIGIT antibody (clone 3F9, a kind gift of Pr. Vijay K. Kuchroo) at 20 μg/mL or isotype control (mouse IgG1 kappa, clone P3.6.2.8.1 from eBioscience) at 20 μg/mL. After 5 days, cells were stained with LIVE/DEAD™ Fixable Dead Cell Stain kit (Invitrogen), αTIGIT (clone MBSA43 from eBioscience) and αCD226 (clone DX11 from eBioscience). Stained Tregs were washed and acquired on a BD Fortessa™ flow cytometer.
Statistics and data availability
Statistical analysis was performed in GraphPad Prism. When comparing 2 conditions within the same individual, we used paired 2-tailed t tests. For comparisons across 2 groups of unrelated individuals, we used unpaired 2-tailed t tests. p Values <0.05 were considered significant. All anonymized data will be shared by request with any qualified investigator.
Results
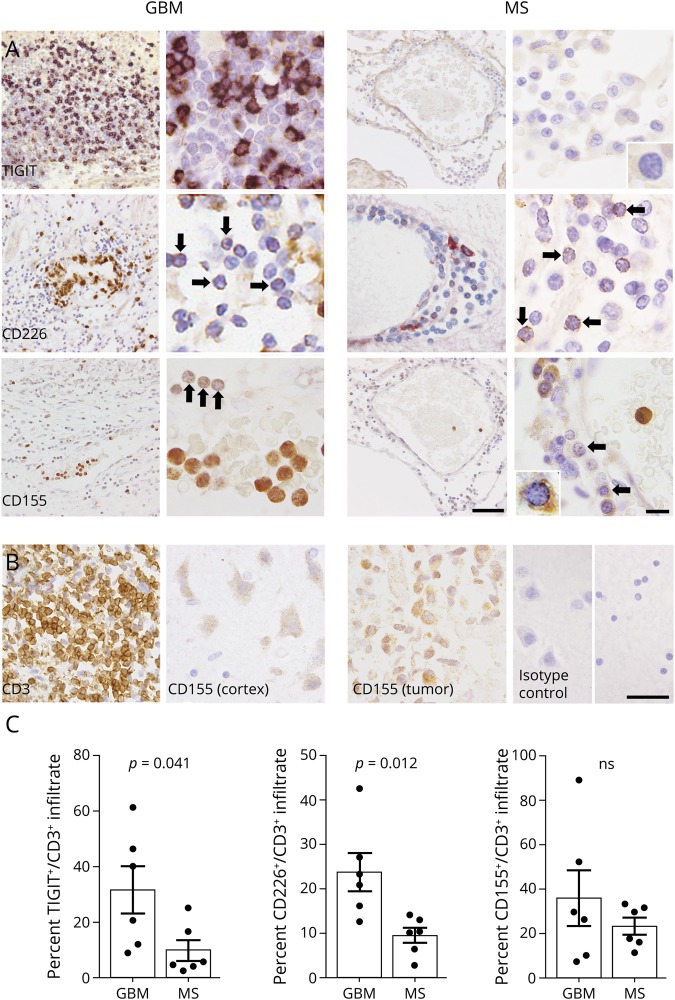
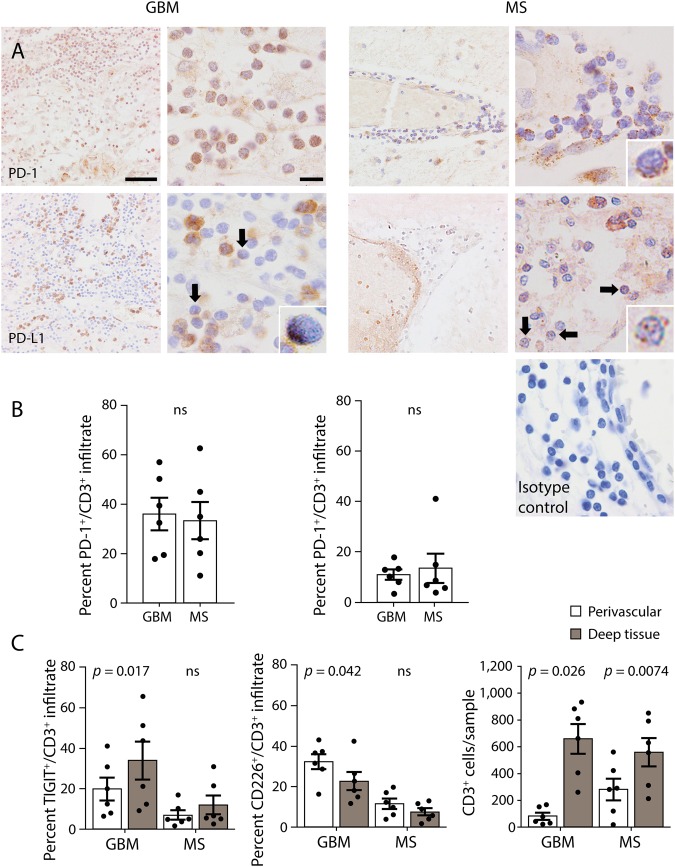
We examined the expression of TIGIT, CD226, CD155, PD-1, and PD-L1 in tumor-infiltrating T cells in glioblastoma and demyelinating lesions from patients with MS by immunohistochemistry. The percentage of TIGIT+ T cells was substantially higher in GBM infiltrates compared with MS lesions (figure 1, A and C). Similarly, the percentage of CD226+ lymphocytes was higher in glioblastoma than in MS, although cellular expression was overall low and had a punctate appearance. CD155, the ligand for TIGIT and CD226, was present at a low level in infiltrating lymphocytes in glioblastoma and MS, but was highly expressed by GBM tumor cells, perivascular monocytes and, to a lower degree, by cortical neurons (figure 1B). Finally, the percentage of infiltrating lymphocytes that expressed PD-1 and PD-L1 was similar in GBM and MS (figure 2, A and B). In addition, we compared the percentage of TIGIT and CD226-expressing lymphocytes in perivascular cuffs and in the lesion parenchyma. In GBM, we found that the percentage of TIGIT+ T cells was significantly higher in tumor tissue than in perivascular infiltrates. Furthermore, we observed a gradient in the opposite direction for CD226+ lymphocytes, with higher frequencies in perivascular cuffs compared with tumor parenchyma. In MS lesions, the prevalence of TIGIT+ and CD226+ lymphocytes did not differ significantly between perivascular and parenchymal infiltrates (figure 2C).
Figure 1. Expression of TIGIT and CD226 distinguishes GBM from MS T-cell infiltrates.
(A) TIGIT+, CD226+, and CD155+ infiltrates in tumor tissue from patients with GBM and chronic active lesions from patients with MS. Arrows and insets indicate representative immunoreactivities in lymphocytes. (B) Area corresponding to TIGIT-stained GBM tissue in (A), immunolabeled with antibody against CD3. CD155 expression in tumor cells and cortical neurons. (C) Quantification of TIGIT+, CD226+, and CD155+ infiltrates in GBM tumor tissue and MS lesions. Statistical significance was assessed by unpaired Student t tests with a p value threshold of 0.05. ns = not significant. High magnification (scale bar = 40 μm). Low magnification (scale bar = 10 μm). GBM = glioblastoma multiforme.
Figure 2. Expression of PD-1 and PD-L1 by T-cell infiltrates is similar in GBM and MS.
(A) PD-1+ and PD-L1+ infiltrates in tumor tissue from patients with GBM and chronic active lesions from patients with MS. Isotype control for PD-1 and PD-L1 antibody in perivascular infiltrates of MS tissue. Arrows and insets indicate representative immunoreactivities in lymphocytes. (B) Quantification of PD-1+ and PD-L1+ infiltrates in GBM tumor tissue and MS lesions. (C) Frequency of TIGIT+ and CD226+ lymphocytes in the perivascular space and deep parenchyma, as well as the number of CD3+ lymphocytes counted in the perivascular space and deep parenchyma per sample. Statistical significance was assessed by unpaired or paired Student t tests with a p value threshold of 0.05. ns = not significant. High magnification (scale bar = 40 μm). Low magnification (scale bar = 10 μm). GBM = glioblastoma multiforme.
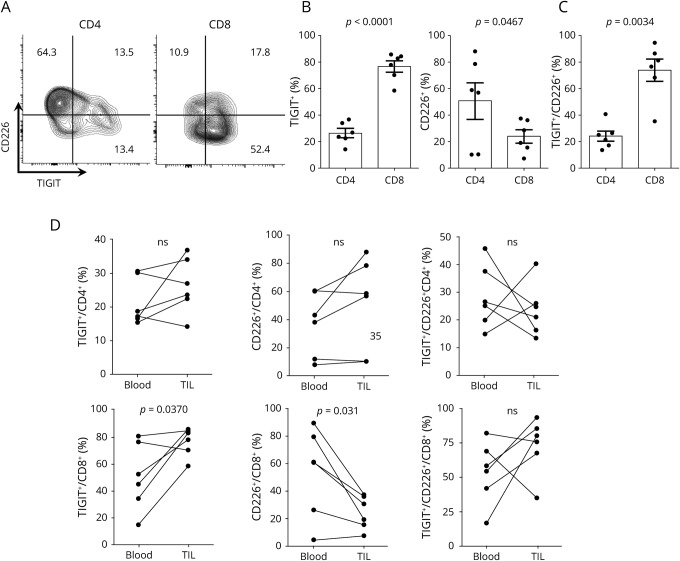
We used freshly resected (unfixed) tumor tissue from newly diagnosed patients with glioblastoma to examine expression of TIGIT and CD226 by tumor-infiltrating T cells with flow cytometry. We observed that the majority of CD8 but not CD4 T cells were TIGIT positive, whereas CD226 was expressed at higher rates by CD4 T cells compared with CD8 (figure 3, A and B). Moreover, because TIGIT and CD226 have been reported to interact in cis, i.e., on the same cell,15 we assessed coexpression of the 2 molecules by flow cytometry and found that the majority of tumor-infiltrating CD8 T cells expressing CD226 were also positive for TIGIT (figure 3C).
Figure 3. The tumor microenvironment of GBM allows for engagement of TIGIT on CD8+ T cells by CD155.
(A) Expression of TIGIT and CD226 measured by flow cytometry on CD4 and CD8 T cells from tumor infiltrates. (B) Percent of CD4 and CD8 T cells expressing TIGIT and CD226 and percent of CD226+, CD4, and CD8 T cells coexpressing TIGIT (C). Histograms represent mean ± SEM. (D) Quantification of the frequency of TIGIT+, CD226+, and TIGIT+ among CD226+ for CD4 and CD8 circulating and tumor-infiltrating T cells. Frequencies were assessed by flow cytometry. Dots connected by a line represent the same patient. TIL = tumor-infiltrating lymphocytes. Statistical significance was assessed by the paired Student t test with a p value threshold of 0.05; ns = not significant. GBM = glioblastoma multiforme.
We then compared TIGIT/CD226 expression in tumor-infiltrating and blood-derived lymphocytes of patients with glioblastoma and healthy controls. The frequency of TIGIT+ CD8 but not CD4 T cells was increased in tumor tissue compared with peripheral blood of patients with glioblastoma, whereas CD226+ CD8 lymphocytes were significantly reduced in the tumor compared with blood, where they coexpressed similar levels of TIGIT (figure 3D). Moreover, comparing the frequency of circulating TIGIT+ and CD226+ T cells between patients with glioblastoma and healthy controls highlighted a peripheral signature of the disease. Overall, patients with glioblastoma showed strong enrichment of TIGIT but not PD-1 expressing CD4 and CD8 T cells compared with healthy controls (figure 4). Although the frequency of CD226+ CD4 and CD8 T cells was not significantly different between patients and controls (figure 4C), CD226+ T cells from patients with glioblastoma coexpressed higher levels of TIGIT compared with healthy controls (figure 4, C and D).
Figure 4. Circulating CD4 and CD8 T cells of patients with GBM are enriched in TIGIT+ cells compared with healthy donors.
Expression of TIGIT and CD226 measured by flow cytometry on circulating CD4 (A) and CD8 (B) T cells from healthy donors (HDs) and patients with GBM. Quantification of the frequency of TIGIT+, CD226+, and TIGIT+ among CD226+ and PD-1+ for CD4 (C) and CD8 (D) circulating T cells. The values for GBM are the same as depicted in Fig 2 in the “Blood” group. Histograms represent mean ± SEM. Statistical significance was assessed by the unpaired Student t test with a p value threshold of 0.05; ns = not significant. GBM = glioblastoma multiforme.
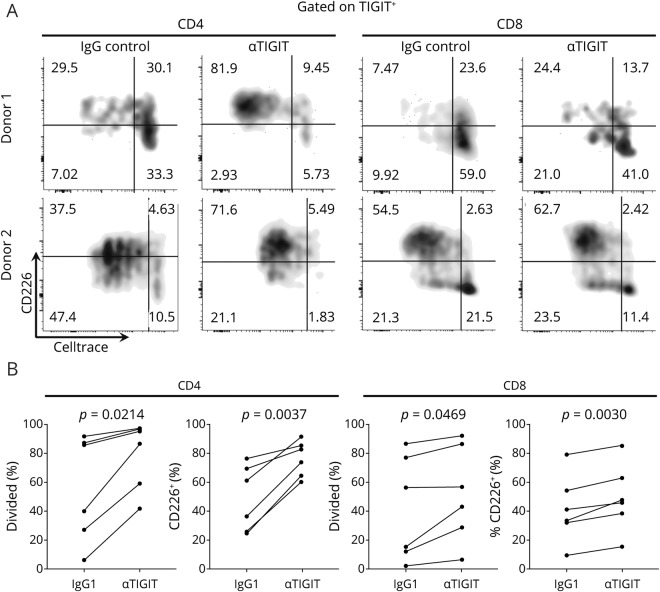
Finally, we asked whether the enlarged TIGIT+ compartment in the circulation of patients with glioblastoma could be functionally modulated by TIGIT blockade. For this, we sorted CD4 T effectors (after removal of the CD25highCD127low Treg population) and CD8 T cells from the peripheral blood of 6 additional patients with glioblastoma and measured proliferation in response to αCD3/αCD28 stimulation in the presence of an αTIGIT blocking antibody or isotype control. When gating on TIGIT+ cells after 4 days of stimulation, we observed that TIGIT blockade conferred a significant increase in proliferation, which was more pronounced in CD4 than CD8 T cells and in cultures with low proliferation at baseline. Moreover, blocking TIGIT also induced heightened expression of CD226 on TIGIT+ cells (figure 5, A and B).
Figure 5. TIGIT blockade increases proliferation and CD226 expression on TIGIT+ CD4 and CD8 T cells from patients with GBM.
Proliferation as measure by CellTrace™ dilution vs CD226 expression in TIGIT+ CD4 and CD8 T cells at the end of a 5-day in vitro stimulation with αCD3+αCD28. Representative stainings from 2 patients presenting different baseline degrees of proliferation (A) and quantifications from 6 patients (B). Statistical significance was assessed by the paired Student t test with a p value threshold of 0.05. GBM = glioblastoma multiforme.
Discussion
Immune checkpoint receptors are a family of coinhibitory receptors that modulate T-cell activation. The interactions between coinhibitory receptors on tumor-infiltrating T cells and their ligands expressed by tumor cells are believed to contribute to the failure of the immune system to reject tumors.1,2 Although therapeutic blockade of this interaction has yielded dramatic results in the therapy of multiple cancer types, therapeutic trials with the immune checkpoint inhibitors anti-PD-1 and CTLA-4 in patients with glioblastoma have not been successful.25 This suggests that PD-1 signaling might be redundant in the tumor microenvironment of glioblastoma, where additional coinhibitory pathways may be operative. To identify coinhibitory pathways that are important in the brain, we hypothesized that comparison of T cells in lesions from patients with MS with TILs from patients with glioblastoma may reveal novel targets for immunotherapy of brain tumors.
Previous studies have reported frequencies of TIGIT+ tumor-infiltrating lymphocytes in glioblastoma (25%–60%), similar to the ones observed by us, although these studies have not addressed whether TIGIT expression on T cells occurs in any CNS environment or is a feature specific to the glioblastoma infiltrate.20,26 Here, we report that TIGIT-expressing lymphocytes were substantially higher in glioblastoma infiltrates than in MS lesions, where TIGIT expression was essentially absent. Given the abundant expression of the TIGIT ligand, CD155, on glioblastoma cells, this suggests that TIGIT signaling critically limits antitumor responses in GBM. In contrast, the relative absence of TIGIT/CD155 in normal white matter and MS lesions indicates that TIGIT signaling does not occur constitutively in the CNS. Moreover, PD-1/PD-L1+ lymphocytes were present in both conditions, indicating that PD-1 signaling is not a distinguishing feature between inflammatory responses in GBM and MS.
Although we observed a greater percentage of CD226-expressing lymphocytes in tumor infiltrates compared with MS lesions, its coexpression with TIGIT is likely to disrupt CD226 homodimerization15 and thereby renders CD226 nonfunctional. In contrast, the nearly absent expression rate of TIGIT in infiltrating lymphocytes in MS lesions suggests low TIGIT/CD226 coexpression, resulting in undisrupted CD226 function.
The increased percentage of TIGIT+ lymphocytes in tumor parenchyma compared with perivascular infiltrates, the high expression CD155 in glioblastoma cells, and the relative decrease of CD226+ T cells within the tumor tissue all suggest that CD155-induced TIGIT signaling is most pronounced in direct proximity to tumor tissue. Further investigations will elucidate whether the tumor microenvironment locally induces upregulation of TIGIT and downregulation of CD226 or preferentially attracts and retains TIGIT+CD226− lymphocytes.
Finally, TIGIT expression was increased in peripheral T cells in patients with glioblastoma compared with healthy controls, whereas expression of CD226 was decreased. This novel observation could indicate a systemic leakage of TIGIT-inducing factor and/or recirculation of TIGIT+ T cells between the periphery and the tumor bed. Trafficking of T cells between tumor and periphery would present an opportunity to gain insight into induction of TIGIT expression, to monitor the state of tumor-infiltrating lymphocytes, and to block TIGIT activity peripherally, thereby circumventing the obstacle of the blood-brain barrier for therapeutic antibodies. Indeed, circulating TIGIT+ T cells from patients with GBM stimulated in vitro in the presence of a blocking αTIGIT antibody displayed increased proliferation and expression of CD226, an effect that was more pronounced in CD4 than CD8 T cells. The elevated expression of TIGIT but only moderate response to TIGIT blockade of circulating CD8 T cells could indicate that these cells represent a terminally differentiated subpopulation with limited self-renewal and reinvigoration properties. Moreover, although cytotoxic CD8 T cells can directly kill tumor cells, mechanisms other than intrinsic coinhibitory receptor signaling can control their cytotoxic functions. Indeed, recent studies in melanoma models have shown that CD4 T cell help is needed for CD8 T cells to acquire cytotoxic functions that mediate tumor rejection27 and that the effect of TIGIT blockade in vivo was mediated predominantly by CD4+ Tregs but resulted in increased proinflammatory activity of CD8 T cells.28
Finally, TIGIT blockade increased the expression of CD226 on TIGIT+ CD4 and, to a lesser extent, on CD8 T cells, suggesting that, in addition to increased proliferation, these T cells acquire a potential for stronger co-stimulation.
In summary, our study provides evidence for a critical role for the CD155/TIGIT axis on T cells in immune evasion of glioblastoma. Further work is warranted to elucidate the role of these molecules on the function of other immune cell populations capable of tumor rejection, such as NK cells. Together with existing studies, our results contribute a mechanistic rationale for the development of immunotherapy that targets TIGIT signaling in GBM, either alone or in combination with anti PD-1 or anti-CTLA-4 checkpoint inhibition.
Limitations of our study include that we did not explore expression of CD112, a low-affinity ligand for TIGIT and CD226. Further work exploring the pattern of expression of CD112 might help quantify the overall level of engagement that each receptor receives in the tumor microenvironment. Moreover, our staining experiments have been performed with brightfield single-antibody labeling rather than fluorescent double labeling, which allows only an estimate of the percentage of checkpoint receptor/ligand expressing lymphocytes but permits a better assessment of cells within the lesion environment.
Acknowledgment
The authors thank the operating room staff at Yale-New Haven Hospital and Jonathan Cruz for assistance in obtaining patient samples.
Glossary
- EAE
experimental autoimmune encephalomyelitis
- GBM
glioblastoma multiforme
- ROI
regions of interest
Appendix. Authors

Study funding
This works was funded by the National Multiple Sclerosis Society (RG 4866-A-2), the Gregory M. Kiez and Mehmet Kutman Foundation, and NIH Grants P01 AI045757 (DP) and NIH U19 AI089992, P01 AI073748, U24AI11867, R0AI22220, UM1HG009390, P01 AI039671, P50CA121974, the Nancy Taylor Foundation for Chronic Diseases, and NMSS grants RG-1802-30153CA and 1061-A-18 (DAH).
Disclosure
Dr. Hafler has received research funding from Bristol-Myers Squibb, Novartis, Sanofi, and Genentech. In the past 10 years, he has been a consultant for Bayer Pharmaceuticals, Biohaven Pharmaceutical, Bristol-Myers Squibb, Compass Therapeutics, Eisai Pharmaceuticals, EMD Serono, Genentech, Juno Therapeutics, McKinsey&Co., MedImmune/AstraZeneca, Mylan Pharmaceuticals, NeuroPhage Pharmaceuticals, NKT Therapeutics, Novartis Pharmaceuticals, Proclara Biosciences, Questcor Pharmaceuticals, Roche, Sage Therapeutics, Sanofi Genzyme, Toray Industries, and Versant Venture. Dr. Lucca, Dr. Lerner, Mr. Park, Ms. DeBartolo, Mr. Harnett, Dr. Kumar, Dr. Ponath, Dr. Raddassi, Dr. Huttner, and Dr. Pitt report no disclosures. Go to Neurology.org/NN for full disclosures.
References
- 1.Kim TK, Herbst RS, Chen L. Defining and understanding adaptive resistance in cancer immunotherapy. Trends Immunol 2018;39:624–631. [DOI] [PMC free article] [PubMed] [Google Scholar]
- 2.Baumeister SH, Freeman GJ, Dranoff G, Sharpe AH. Coinhibitory pathways in immunotherapy for cancer. Annu Rev Immunol 2016;34:539–573. [DOI] [PubMed] [Google Scholar]
- 3.Hodi FS, O'Day SJ, McDermott DF, et al. Improved survival with ipilimumab in patients with metastatic melanoma. N Engl J Med 2010;363:711–723. [DOI] [PMC free article] [PubMed] [Google Scholar]
- 4.Wolchok JD, Kluger H, Callahan MK, et al. Nivolumab plus ipilimumab in advanced melanoma. N Engl J Med 2013;369:122–133. [DOI] [PMC free article] [PubMed] [Google Scholar]
- 5.Reck M, Rodríguez-Abreu D, Robinson AG, et al. Pembrolizumab versus chemotherapy for PD-L1-positive non-small-cell lung cancer. N Engl J Med 2016;375:1823–1833. [DOI] [PubMed] [Google Scholar]
- 6.Cella D, Grünwald V, Escudier B, et al. Patient-reported outcomes of patients with advanced renal cell carcinoma treated with nivolumab plus ipilimumab versus sunitinib (CheckMate 214): a randomised, phase 3 trial. Lancet Oncol 2019;20:297–310. [DOI] [PMC free article] [PubMed] [Google Scholar]
- 7.Overman MJ, Lonardi S, Wong KYM, et al. Durable clinical benefit with nivolumab plus ipilimumab in DNA mismatch repair-deficient/microsatellite instability-high metastatic colorectal cancer. J Clin Oncol 2018;36:773–779. [DOI] [PubMed] [Google Scholar]
- 8.Younes A, Santoro A, Shipp M, et al. Nivolumab for classical Hodgkin's lymphoma after failure of both autologous stem-cell transplantation and brentuximab vedotin: a multicentre, multicohort, single-arm phase 2 trial. Lancet Oncol 2016;17:1283–1294. [DOI] [PMC free article] [PubMed] [Google Scholar]
- 9.Hughes J, Vudattu N, Sznol M, et al. Precipitation of autoimmune diabetes with anti-PD-1 immunotherapy. Diabetes Care 2015;38:e55–57. [DOI] [PMC free article] [PubMed] [Google Scholar]
- 10.Cao Y, Nylander A, Ramanan S, et al. CNS demyelination and enhanced myelin-reactive responses after ipilimumab treatment. Neurology 2016;86:1553–1556. [DOI] [PMC free article] [PubMed] [Google Scholar]
- 11.Kostine M, Chiche L, Lazaro E, et al. Opportunistic autoimmunity secondary to cancer immunotherapy (OASI): an emerging challenge. Rev Med Interne 2017;38:513–525. [DOI] [PubMed] [Google Scholar]
- 12.Yu X, Harden K, Gonzalez LC, et al. The surface protein TIGIT suppresses T cell activation by promoting the generation of mature immunoregulatory dendritic cells. Nat Immunol 2009;10:48–57. [DOI] [PubMed] [Google Scholar]
- 13.Boles KS, Vermi W, Facchetti F, et al. A novel molecular interaction for the adhesion of follicular CD4 T cells to follicular DC. Eur J Immunol 2009;39:695–703. [DOI] [PMC free article] [PubMed] [Google Scholar]
- 14.Lozano E, Dominguez-Villar M, Kuchroo V, Hafler DA. The TIGIT/CD226 axis regulates human T cell function. J Immunol 2012;188:3869–3875. [DOI] [PMC free article] [PubMed] [Google Scholar]
- 15.Johnston RJ, Comps-Agrar L, Hackney J, et al. The immunoreceptor TIGIT regulates antitumor and antiviral CD8(+) T cell effector function. Cancer Cell 2014;26:923–937. [DOI] [PubMed] [Google Scholar]
- 16.Joller N, Lozano E, Burkett PR, et al. Treg cells expressing the coinhibitory molecule TIGIT selectively inhibit proinflammatory Th1 and Th17 cell responses. Immunity 2014;40:569–581. [DOI] [PMC free article] [PubMed] [Google Scholar]
- 17.Lucca LE, Axisa PP, Singer ER, Nolan NM, Dominguez-Villar M, Hafler DA. TIGIT signaling restores suppressor function of Th1 Tregs. JCI Insight 2019;4:124427. [DOI] [PMC free article] [PubMed] [Google Scholar]
- 18.Chauvin JM, Pagliano O, Fourcade J, et al. TIGIT and PD-1 impair tumor antigen-specific CD8+ T cells in melanoma patients. J Clin Invest 2015;125:2046–2058. [DOI] [PMC free article] [PubMed] [Google Scholar]
- 19.Dixon KO, Schorer M, Nevin J, et al. Functional anti-TIGIT antibodies regulate development of autoimmunity and antitumor immunity. J Immunol 2018;200:3000–3007. [DOI] [PMC free article] [PubMed] [Google Scholar]
- 20.Hung AL, Maxwell R, Theodros D, et al. TIGIT and PD-1 dual checkpoint blockade enhances antitumor immunity and survival in GBM. Oncoimmunology 2018;7:e1466769. [DOI] [PMC free article] [PubMed] [Google Scholar]
- 21.Tabata H, Hara M, Kitani A, et al. Expression of TLiSA1 on T cells from patients with rheumatoid arthritis and systemic lupus erythematosus. Clin Immunol Immunopathol 1989;52:366–375. [DOI] [PubMed] [Google Scholar]
- 22.Hafler JP, Maier LM, Cooper JD, et al. CD226 Gly307Ser association with multiple autoimmune diseases. Genes Immun 2009;10:5–10. [DOI] [PMC free article] [PubMed] [Google Scholar]
- 23.Joller N, Hafler JP, Brynedal B, et al. Cutting edge: TIGIT has T cell-intrinsic inhibitory functions. J Immunol 2011;186:1338–1342. [DOI] [PMC free article] [PubMed] [Google Scholar]
- 24.Dardalhon V, Schubart AS, Reddy J, et al. CD226 is specifically expressed on the surface of Th1 cells and regulates their expansion and effector functions. J Immunol 2005;175:1558–1565. [DOI] [PubMed] [Google Scholar]
- 25.Omuro A, Vlahovic G, Lim M, et al. Nivolumab with or without ipilimumab in patients with recurrent glioblastoma: results from exploratory phase I cohorts of CheckMate 143. Neuro Oncol 2018;20:674–686. [DOI] [PMC free article] [PubMed] [Google Scholar]
- 26.Woroniecka K, Chongsathidkiet P, Rhodin K, et al. T-cell exhaustion signatures vary with tumor type and are severe in glioblastoma. Clin Cancer Res 2018;24:4175–4186. [DOI] [PMC free article] [PubMed] [Google Scholar]
- 27.Zander R, Schauder D, Xin G, et al. CD4+ T cell help is required for the formation of a cytolytic CD8+ T cell subset that protects against chronic infection and cancer. Immunity 2019;51:1028–1042.e4. [DOI] [PMC free article] [PubMed] [Google Scholar]
- 28.Kurtulus S, Sakuishi K, Ngiow SF, et al. TIGIT predominantly regulates the immune response via regulatory T cells. J Clin Invest 2015;125:4053–4062. [DOI] [PMC free article] [PubMed] [Google Scholar] [Retracted]


