Abstract
The enteric nervous system (ENS) predominantly originates from vagal neural crest cells (VNC) that emerge from the caudal hindbrain, invade the foregut and populate the gastrointestinal tract. However, the gene regulatory network (GRN) orchestrating the early specification of VNC remains unknown. Using an EdnrB enhancer, we generated a comprehensive temporal map of the chromatin and transcriptional landscape of VNC in the avian model, revealing three VNC cell clusters (neural, neurogenic and mesenchymal), each predetermined epigenetically prior to neural tube delamination. We identify and functionally validate regulatory cores (Sox10/Tfap2B/SoxB/Hbox) mediating each programme and elucidate their combinatorial activities with other spatiotemporally-specific transcription factors (bHLH/NR). Our global deconstruction of the VNC-GRN in vivo sheds light on critical early regulatory mechanisms that may influence the divergent neural phenotypes in enteric neuropathies.
Keywords: Enteric Nervous System, Vagal Neural Crest, Gene Regulatory Network, ATAC-seq, Hirschsprung, enteric neuropathies, development, chromatin landscape, neural crest cells, FoxD3, EdnrB, Sox10
Introduction
Achieving cellular diversity within the enteric nervous system (ENS) requires precisely governed gene regulation to form a complex interconnected network of ganglia1. Therefore, gene perturbations during key steps of ENS formation can have detrimental effects, as in the case of Hirschsprung disease (HSCR, OMIM #142623), a congenital intestinal aganglionic malformation where the gut lacks ENS innervation at varying lengths of the large bowel, leading to the loss of motility and a potentially lethal pseudo-obstruction2. The increasing catalogue of coding and non-coding mutations3, 4 implicated in this complex oligogenic enteric neuropathy heightens the need to explore the gene regulatory network (GRN) and the chromatin landscape required for early ENS development.
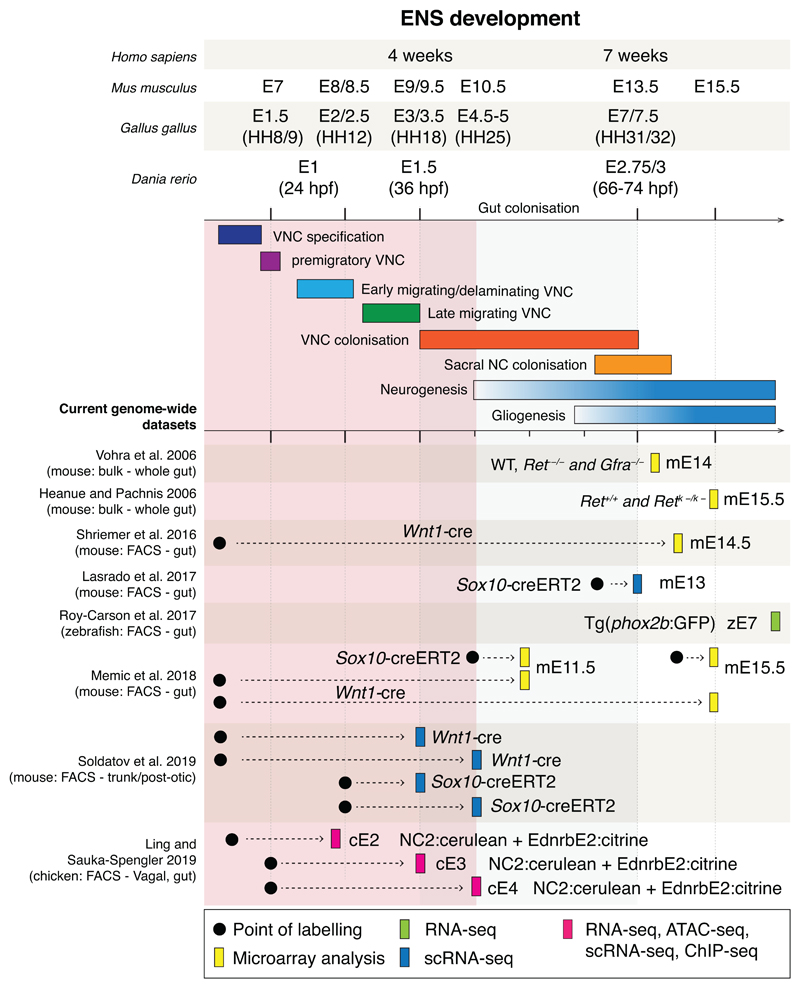
Decades of experimental embryology using grafting and lineage tracing experiments have demonstrated that neurons and glia of the ENS are largely derived from the vagal neural crest, VNC (arising at somite levels 1-7)5, 6 with some contribution from sacral NC, caudal to somite 287. Avian and murine models have shown that VNC delaminates from the neural tube around E8.5 in mouse (E1.5-2/HH10 in chicken), enters the developing foregut at E9-9.5 (E3-3.5/HH18 in chicken) and undergoes a long migration rostrocaudally from the foregut to the hindgut to complete its colonisation around E13.5 (or E7.5/HH30 in chicken)7, 8 (Extended Data Fig. 1). Current gene expression profiles of ENS sublineages were only analysed at later time points9–13, including recent single-cell datasets of Sox10-derived ENS lineages14 and of post-otic derived Wnt1-traced NC15 (Extended Data Fig. 1). From a regulatory standpoint, NC-GRN analyses to date have covered early cranial16–18, or only trunk NC17, 19 restricted to FoxD3 expressing cells, but non-coding, cis-regulatory elements specific to the vagal region remain to be dissected.
The present study addresses this knowledge gap (Extended Data Fig. 1) by characterising both the transcriptional and chromatin landscape in all VNC cells from delamination to gut colonisation. We identified distinct VNC cell populations and functionally validated early regulatory signatures that drove their propensities to differentiate into a particular fate. By correlating motif enrichment on identified enhancer elements with transcriptional profiles and transcription factor (TF) binding maps, we highlighted Tfap2B and Sox10 as key factors that function in combination with other major classes of TFs to drive different lineages and precisely control instructive and repressive programmes. In vivo CRISPR/Cas9 knockouts of core factors confirmed their essential inputs into regulatory circuits driving VNC downstream targets. Together, these data validated a comprehensive VNC-GRN governing the very early determination of VNC fate into neural, neurogenic and a previously undescribed mesenchymal lineage within the gut.
Results
Chromatin profiling identifies NC-specific EdnrB enhancers
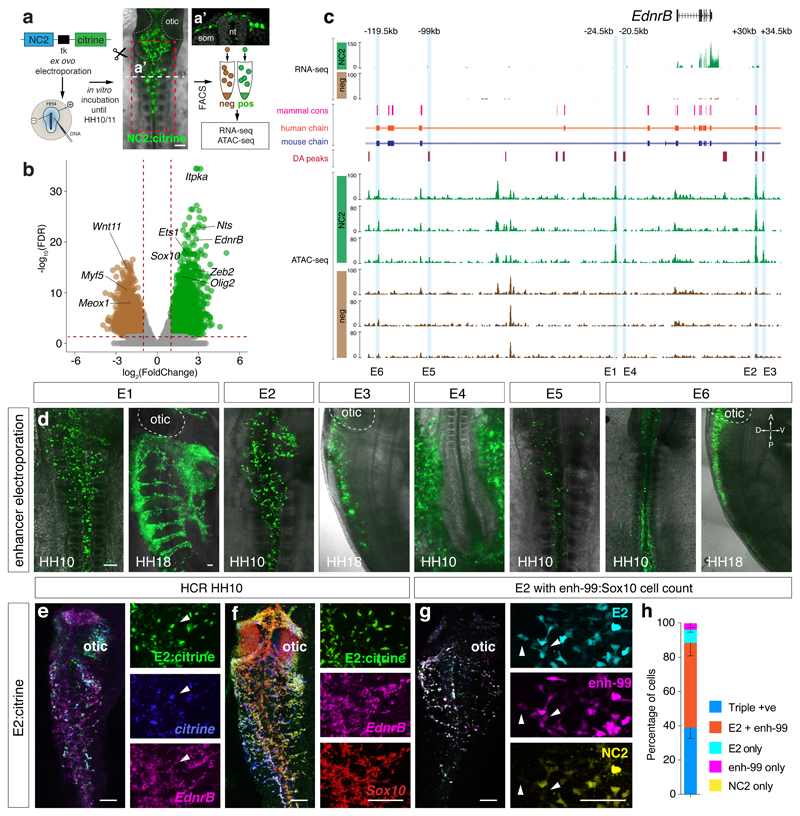
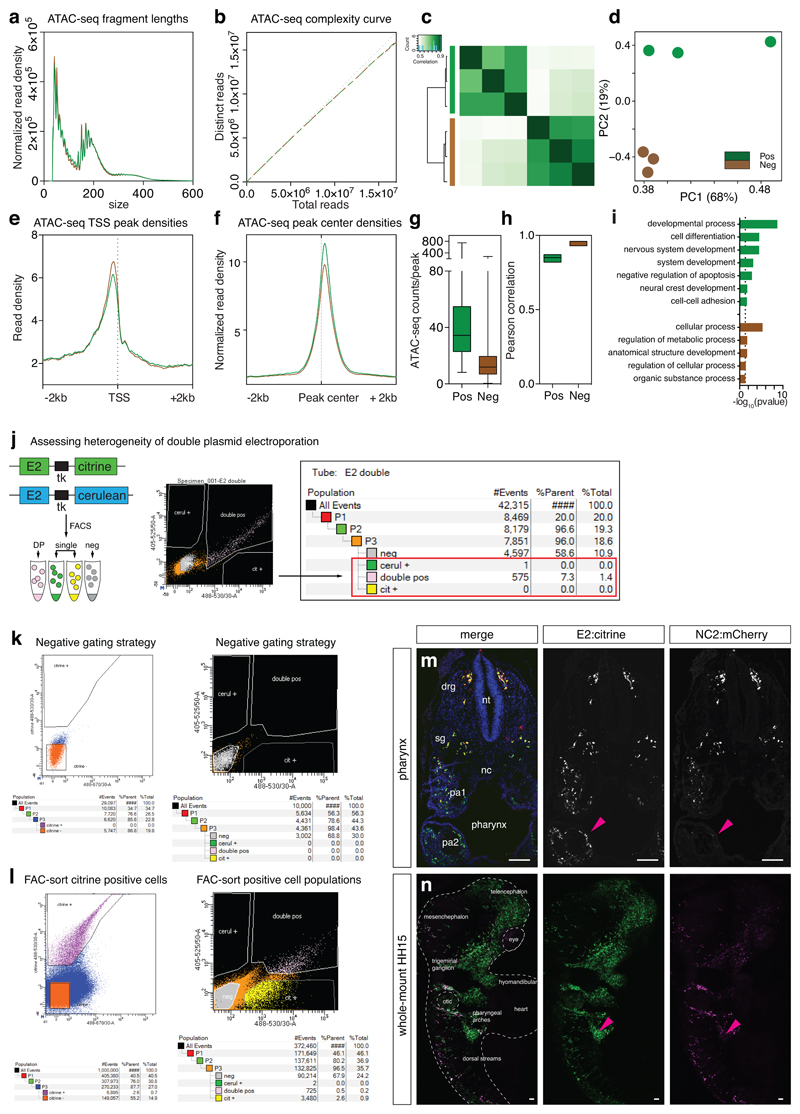
As previously described early trunk NC progenitor driver FoxD3-NC220 does not encompass all VNC21, we generated chromatin accessibility maps of NC2+ cells FAC-sorted from dissected vagal regions adjacent to somites 1-7 in HH10 chicken embryos (Fig. 1a) to reveal other cis-regulatory elements with a broader VNC activity (Figs. 1b, Extended Data Figs. 2a-i). Focusing on EdnrB, a gene critical in enteric neurodevelopment22, six elements identified as differentially accessible (DA) specifically in the VNC (Fig. 1c) drove specific Citrine reporter activity in the embryo (Fig. 1d). Enhancers E1, E2, and E5 controlled expression in NCC, with E3 and E6 active in the neural tube and E4 in the zona pellucida (Fig. 1d).
Figure 1. Defining regions of differential chromatin accessibility within VNC identifies NC specific EdnrB enhancers.
(a) Ex ovo electroporation of NC2:Citrine construct at HH4. Embryos were incubated until HH10 to reveal Citrine expression in the VNC (A’). Vagal region from somites 1-7 from approximately 90 embryos (Red box) was dissected and dissociated prior to FAC-sorting Citrine+ cells. ATAC-seq was performed on 2500 live sorted cells. Scale bar = 100 μm
(b) Volcano plot showing merged peaks from triplicates of ATAC-seq experiment differentially accessible in NC2 (green) versus negative cells (brown). Analysis using DiffBind identified peaks with statistically significant enrichment; p-values obtained using Wald test with Benjamin-Hochberg correction for multiple testing (False Discovery Rate, FDR) were plotted against the FoldChange on a log scale.
(c) Genome browser screenshot of the EdnrB locus spanning approximately 150kb showing RNA-seq and ATAC-seq tracks, differentially accessible peaks, as well as human and mouse conservation chains. Six EdnrB enhancers, E1-E6, are highlighted in blue.
(d) Live embryo confocal image of HH10 embryos electroporated ex ovo with enhancer:Citrine constructs. Orientation A, anterior, P, posterior, D, dorsal, V, ventral. 6 embryos/experiment
(e) In situ HCR of an electroporated embryo with E2:Citrine showing co-localisation with Citrine and endogenous EdnrB gene expression. 6 embryos/experiment
(f) In situ HCR of an electroporated embryo with E2:Citrine showing co-localisation with endogenous EdnrB and Sox10 gene expression. 6 embryos/experiment
(g) Live embryo confocal image of E2:mCherry, NC2:Cerulean and enh-99:mCherry (marking Sox10-expressing cells). White arrowheads mark E2/enh-99 positive cells but NC2 negative. 3 embryos/experiment
(h) Activity and overlap of three NC enhancers, E2:mCherry, NC2:Cerulean and enh-99:mCherry indicated as a percentage of all fluorescent NC cells in the vagal region (somite levels 1-7). n=3 independent embryos imaged and quantified separately using confocal images. Error bars indicate Standard Deviation. Scale bars = 100 μm.
We selected E2 enhancer for further analysis due to its conservation with mammals, and a strong broad NC-specific activity that persisted at later stages. In situ Hybridisation Chain Reaction (HCR)23 confirmed that Citrine transcripts were distributed within the same cells harbouring E2 fluorescent signal (Fig. 1e). Furthermore, endogenous EdnrB transcripts precisely overlapped the pattern of E2 reporter activity, suggesting that this enhancer was a part of the tissue-specific cis-regulatory apparatus controlling EdnrB, while co-expression with endogenous Sox10 gene confirmed the NC identity of E2-controlled Citrine-expressing cells (Fig. 1f). Triple reporter assays revealed approximately twice as many E2-EdnrB/enh-99-Sox10 double-positive cells (enh-99 is a global Sox10 enhancer18) compared to triple-positive cells that included NC2, further evidencing that NC2 enhancer alone did not label all VNC (Figs. 1g, h).
Distinct NC2 and E2 reporter activities during VNC development
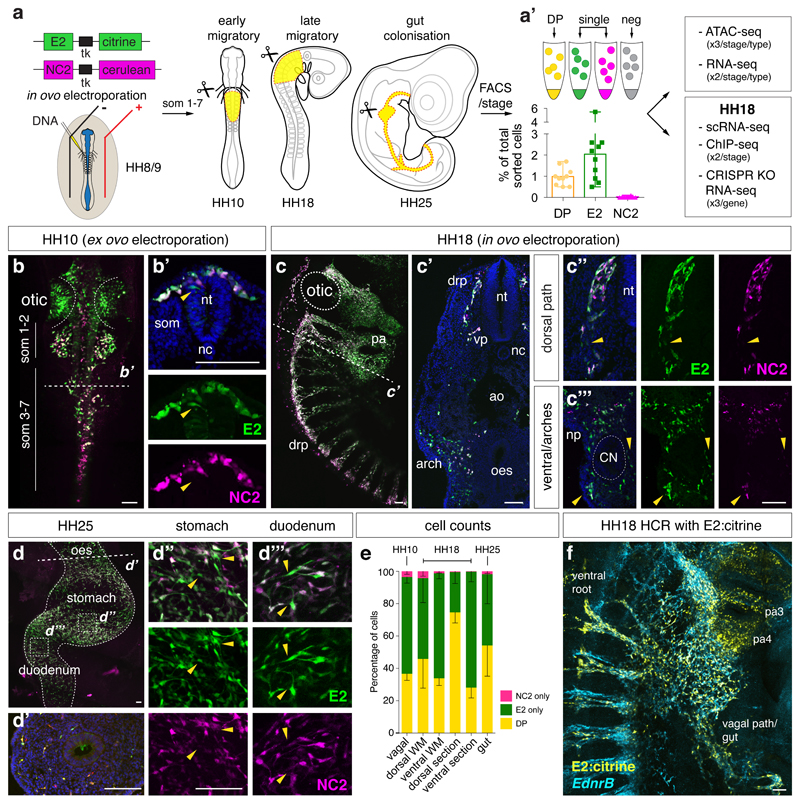
Concurrent activities of E2 (Citrine) and NC2 (Cerulean) reporters were assessed at three developmental time points (dissected regions adjacent to somites 1-7 in HH10 and HH18 chicken embryos and dissected embryonic guts at HH25) (Fig. 2a) using optimised co-electroporation assays (Extended Data Fig. 2j). FAC-sorting experiments confirmed that there were approximately twice as many E2-only positive cells (from here on E2) compared to double E2/NC2-positive cells (from here on DP) with no NC2-only positive cells sorted (Fig. 2a’, Extended Data Figs. 2k, l). Whole-mount and transverse sections at the axial level adjacent to the somites 3 at HH10 (Fig. 2b) showed migrating DP cells as well as E2-only cells within the dorsal neural tube prior to delamination (Fig. 2b’). At HH18 (Fig. 2c), there was concurrent DP and E2 activity within the dorsal roots, surrounding the foregut, and within the ventral NC stream (Fig. 2c’) that was also observed at different axial levels (pharynx and trunk/sacral, Figs. 2c“, c“’) with higher observed E2 activity within the pharyngeal arches (Extended Data Figs. 2m, n). Neither DP nor E2 activity was detected within the neural tube (Figs. 2c’, c“). By HH25 (Fig. 2d), distinct E2 versus DP activities were observed within the populations in the stomach and duodenum (Figs. 2d’, d“, d“’). Cell counts at HH18 validated FACS experiments (Fig. 2e), indicating a higher proportion of DP cells at the dorsal migratory stream compared to E2 activity at the ventral/pharyngeal arches (Figs. 2c“, c“’, e) which closely followed endogenous EdnrB expression (Fig. 2f).
Figure 2. Two distinct NC populations; DP and E2 are revealed by differential enhancer activity.
(a) E2:Citrine and NC2:Cerulean constructs were co-electroporated in ovo into the neural tubes of HH8/9 chick embryos. Vagal regions at HH10 and HH18 (somite 1-7 level, in yellow) and whole guts at HH25 (in yellow) from approximately 90 embryos/stage/experiment were dissected and dissociated, and single cells suspensions subjected to FAC-sorting. (a’) Two distinct population of cells; one E2/NC2 double positive and one E2-positive only with no NC2 were isolated by FACS. No NC2-only cells were detected. n=10 independent FACS experiments from pooled embryos. Error bars indicate Standard deviation.
(b) Live embryo images of double enhancer electroporations at HH10 followed by sections at the approximate level of somite 3 (B’, dashed line) 5 biologically independent embryos.
(c) Live embryo images of double enhancer electroporations at HH18 and section (c’) were taken at the approximate level of somite 3 highlighting crest specific expression with higher magnification images of the dorsal path (c“) and ventral region (c“’). drp, dorsal root pathway, nt, neural tube, vp, ventral pathway, nc, notochord, ao, dorsal aorta, np, nodosa placode, oes, oesophagus. 5 biologically independent embryos.
(d) Whole mount dissected gut at HH25 and sections (d’) showing positive enhancer cells within the oesophageal wall with higher magnification images of an area within the stomach (d“) and duodenum (d“’). Yellow arrowheads indicating E2-only cells. 5 biologically independent embryos.
(e) Cell counting (HH10 WM: n=5, HH18 dorsal WM; n=3, HH18 ventral WM; n=2, HH18 dorsal section; n=4, HH18 ventral section; n=5, HH25 WM; n=4). For HH18, cell counts were carried out on whole mount (WM) and sections, split into the dorsal aspect of the migrating stream and ventral aspect. Error bars indicate standard deviation and values expressed as a percentage of fluorescent cells.
(f) HCR at HH18 of E2:Citrine enhancer colocalising with endogenous EdnrB gene expression. 3 independent embryos. Scale bars = 100 μm.
Transcriptional profiling of DP and E2 highlights Sox10-high and Sox10-low populations
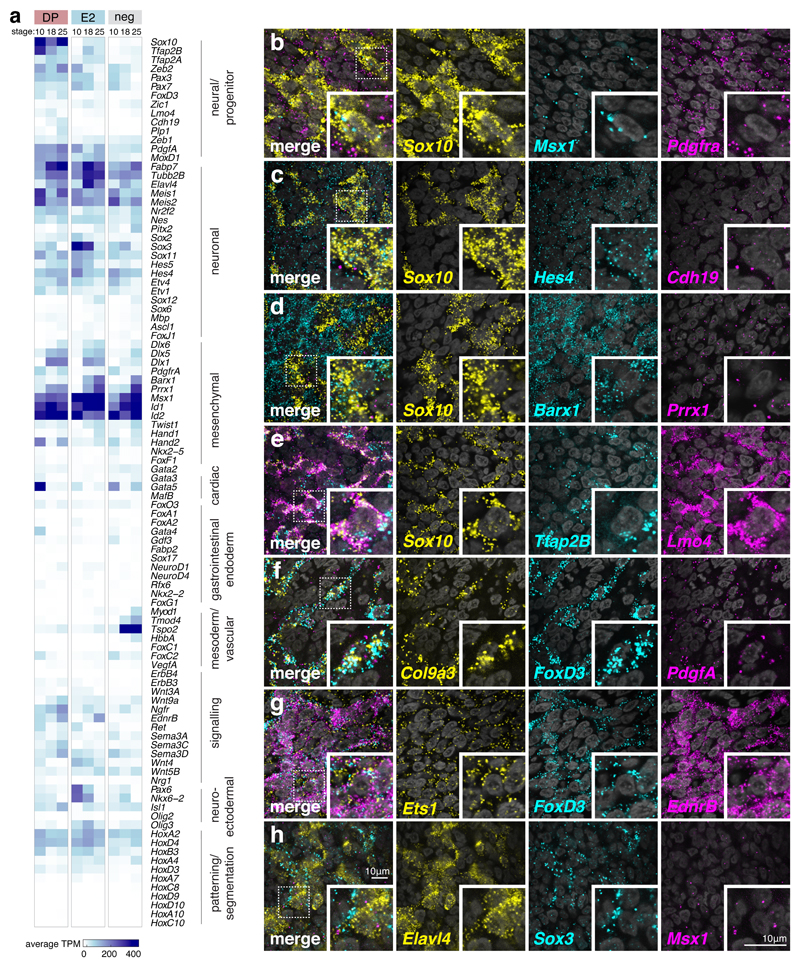
DP, E2, and negative-fluorescence control cells were transcriptionally profiled at the three stages described Extended Data Figs 4b, e). A supervised comparative analysis (Fig. 3a) showed a high Sox10 and FoxD3 expression in the DP and a lower Sox10 expression level with no FoxD3 in the E2 population. DP-only showed enrichment in neural markers (Tfap2B, Zeb2) while both DP and E2 displayed neuronal marker genes (Sox3, Elavl4, Tubb2B) at HH18 and HH25. At HH10 and HH18, high level expression of mesenchymal genes (Prrx1, Msx1) were noted, possibly representing future VNC contribution to neck gland organs or cardiac mesenchyme. However, at HH25 expression of these and other mesenchymal genes (like Barx1) persisted in VNC-derived, reporter-positive cells in the gut. These cells did not express gut endodermal markers such as Sox17 or other vascular markers like VegfA, while Hox gene expression indicated the cells originated from the correct axial level (Fig. 3a).
Figure 3. Distinct transcriptomic profiles of VNC derivatives.
(a) Supervised clustering of RNA-seq average gene transcripts per million (TPM) shown for genes classified by different annotated functions. Each column represents the average TPM values calculated from duplicate experiments. (See Extended Data Figs. 4b, e for hierarchical clustering and principal component analysis of RNA-seq replicates showing reproducibility and profile alignment by stage and cell population and Source Data Fig. 3 for raw count data including separate DESeq2 comparison analyses).
(b-h) High magnification 63X confocal images of HCR in situ expression patterns on dissected guts performed in at least 3 independent HH25 embryos showing co-expression of genes previously undescribed in the context of ENS development that include Msx1, Pdgfra, Hes4, cdh19, Barx1, Prrx1, Tfap2B, Lmo4, Col9a3, FoxD3, PdgfA, Ets1, Elavl4 and Sox3 with known ENS markers Sox10 and EdnrB. Scale bar = 10 μm
RNA-seq expression within the gut was validated using a battery of NC and developmental markers (Figs. 3b-h). Genes specific to Sox10+ cells included Msx1, Cdh19, Lmo4, and EdnrB. Hes4, Pdgfa, Ets1, and Prrx1 showed broad expression in all cells in the gut, while Sox3 (Fig. 3h) and Tfap2B (Fig. 3e) were expressed both in Sox10+ cells and in discrete surrounding populations of Elavl4+/Sox10- cells (Fig. 3h). Col9a3, co-localised with FoxD3 (Fig. 3f), while Barx1, a previously described gut mesenchyme marker24, was found to be expressed within a subpopulation of Sox10+ cells (Fig. 3d).
Transcriptional analysis at single-cell resolution reveals three VNC subpopulations
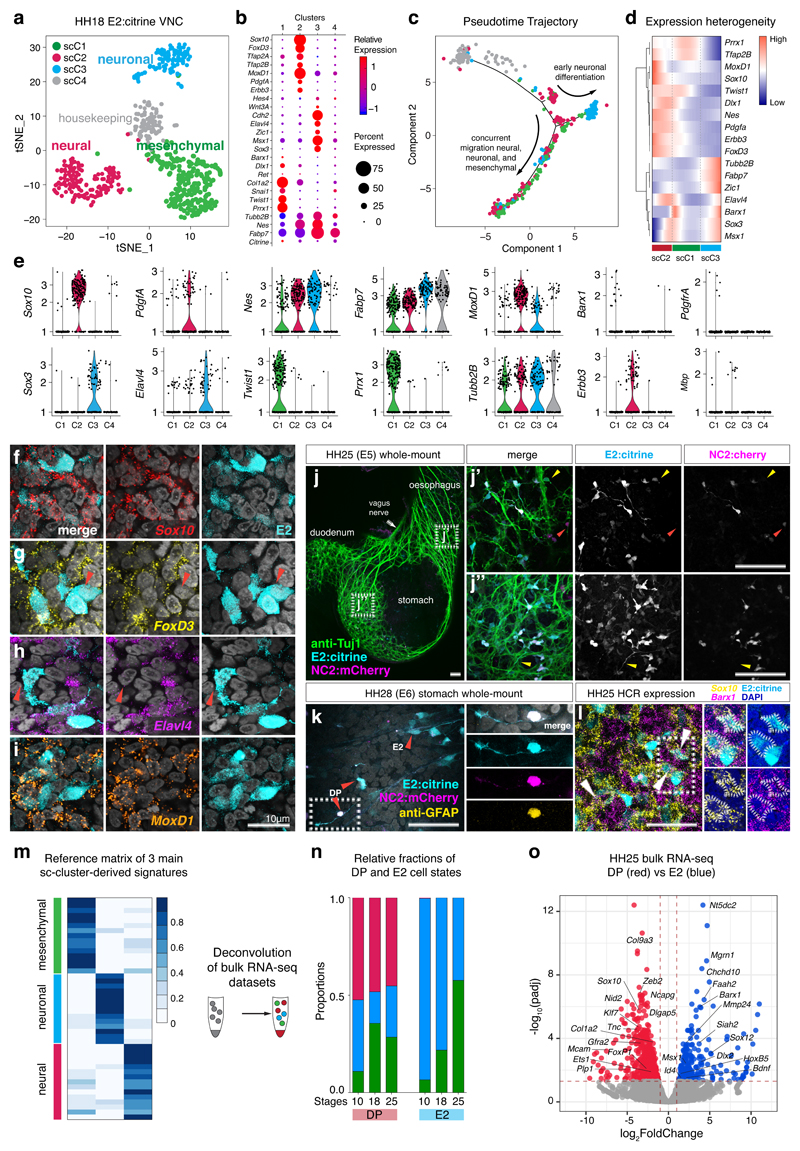
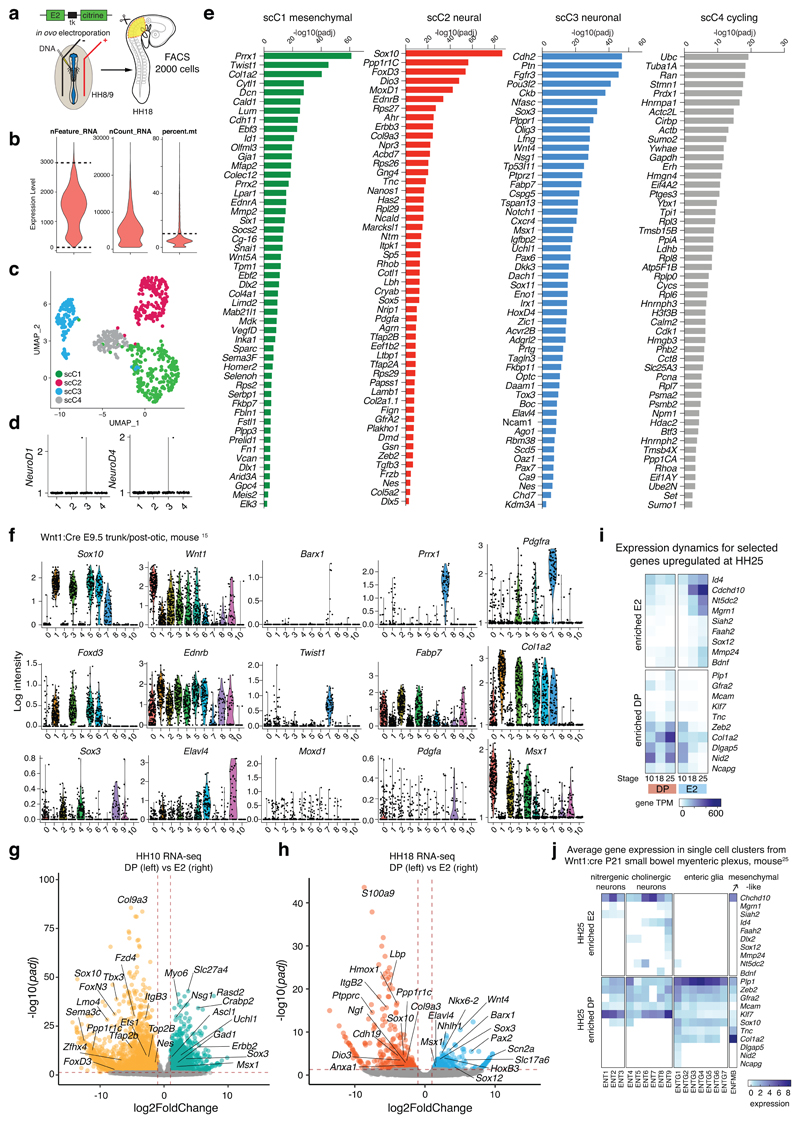
Further investigation of the VNC transcriptional states using single-cell RNA-sequencing (scRNA-seq) of the entire E2-positive VNC population (Extended Data Figs. 3a, b) revealed four distinct single-cell clusters (Fig. 4a, Extended Data Fig. 3c) and no neural tube cell contamination (Extended Data Fig. 3d). When assessing the top 50 marker genes (Extended Data Fig. 3e), the first single-cell cluster (scC1) expressed mostly mesenchymal differentiation genes (Prrx1, Twist1 etc.). ScC2 cluster was marked by bona fide NC genes (Sox10, FoxD3, etc.), scC3 mostly by neuronal genes (Sox3, Elavl4, etc.) while scC4 was enriched in expression of housekeeping factors. Neural progenitor markers like Nes and Fabp7 were present in all clusters while MoxD1, was expressed only in the neural (scC2) and neuronal (scC3) clusters (Figs. 4b, e). Differentiation pseudotime analysis showed a separate bifurcated split of the neuronal cluster (that could represent the early sympathetic lineage) with the concurrent migration of all three main clusters in the lower branch (that could contribute to the ENS) (Fig. 4c). Ordering single cells according to gene expression highlighted the multipotent nature of the neural and mesenchymal clusters through the additional expression of neuronal genes (Elavl4 and Sox3) while the neuronal cluster signature remained distinct (Fig. 4d, e). HCR analysis at HH25 confirmed co-expression of endogenous Sox10 with E2 reporter (Fig. 4f), whereas not all E2-positive cells expressed FoxD3 (Fig. 4g, red arrows) or Elavl4 (Fig. 4h, red arrows). MoxD1 was expressed in all E2 cells (Fig. 4i), in keeping with the observation from mouse embryonic Wnt1-traced NC15 (Extended Data Fig. 3f). We next established that both DP and E2 populations formed neurons as both reporter activities co-localised with βIII tubulin (Fig. 4j, j’, j“). However, only DP cells expressed glial fibrillary acidic protein (GFAP) when assessed at a later stage (HH28; Fig. 4k, Extended Data Fig. 1), whereas a mesenchymal subset of E2-derived VNC cells within the gut co-expressed Sox10 and Barx1 (Fig. 4l).
Figure 4. Single-cell analysis parse three distinct VNC lineages, revealing relative proportions in RNA-seq datasets by deconvolution analysis.
(a) tSNE plot depicting clustering of 570 single cell transcriptomes obtained from FAC-sorted dissected vagal neural crest regions of 30-40 HH18 embryos expressing E2:Citrine.
(b) Bubble plot depicting relative expression of selected top genes identified in each cluster. Bubble size reflects percentage of cells per cluster expressing the gene.
(c) Pseudotime trajectory of single-cell clusters.
(d) Gene expression heterogeneity of vagal NC cells at single-cell level.
(e) Violin plots of marker and common gene expression in transcripts per million (TPM) across clusters plotted on a log scale. Dots (n) represent individual cells with the median representing the highest probability expression within the cluster.
(f-i) Expression of Sox10, FoxD3, Elavl4 and MoxD1 by HCR with E2:Citrine activity within the gut of 3 HH25 embryos. Red arrows point to cells not expressing the particular gene. Scale bar = 10 μm.
(j) Whole-mount antibody staining with anti-Tuj1 on dissected guts of HH25 embryos co-electroporated with E2:Citrine/NC2:mCherry. Higher magnification views of the lower oesophagus (g’) and stomach (g“) highlighting E2-only cells (yellow arrowheads) or NC2-only cells (red arrowheads) colocalising with Tuj1. Greater proportion of E2-only compared to NC2 cells within the gut is detected. 3 embryos; Scale bar = 100 μm
(k) Whole-mount antibody staining with anti-GFAP on dissected guts of HH28 embryos co-electroporated with E2:Citrine/NC2:mCherry. Higher magnification views show GFAP colocalising with DP (E2 and NC2) cell while E2-only cells do not express GFAP. 2 embryos. Scale bar = 100 μm
(l) HCR of HH25 dissected stomach showing co-localisation of Barx1 and Sox10 with E2 activity in at least three E2-positive cells. 3 embryos; Scale bar = 50 μm
(m) Reference matrix used to deconvolve RNA-seq datasets depicting expression of top single-cell-cluster markers, re-scaled using average counts across the cluster.
(n) Relative fraction of E2 and DP populations assigned to each single-cell-cluster identity.
(o) Volcano plot showing differentially expressed genes at HH25 highlights neural, neuronal and mesenchymal signatures. Adjusted p-values (padj) obtained using Wald test with Benjamin-Hochberg correction plotted against FoldChange on a log scale.
To analyse the evolution of cellular diversity between DP and E2 across different stages, we constructed a reference matrix from the three major single-cell clusters (neural, neuronal, and mesenchymal) (Fig. 4m) and deconvolved our bulk temporal RNA-seq datasets (Fig. 4n). The decomposition showed that at all stages, over 50% of the DP population carried a signature of “neural” single-cell cluster and the rest was divided between neuronal or mesenchymal signatures. Neuronal and mesenchymal clusters were only recovered in the E2 datasets, in agreement with the enrichment of neural genes in DP and neuronal/mesenchymal ones in E2 population (Fig. 4o, Extended Data Figs. 3g, h, i), some of which highlighted from the Wnt1-traced NC single mouse cells at P2125 (Extended Data Fig. 3j).
Thus, our transcriptomic analyses have shown that VNC activity can be dichotomised by a Sox10high/FoxD3+ and Sox10low/FoxD3- signature, with a differential FoxD3 expression within the neural cluster (and its absence from future neurons), emphasizing FoxD3 role of as a key neural progenitor state regulator26. Additionally, the notion that FoxD3 highlighted a subset of VNC was corroborated by the Wnt1-traced NC single-cell dataset15, where we found EdnrB and Wnt1 present in all and FoxD3 only in selected single-cell clusters (Extended Data Fig. 3f).
DA regions show functionally variable relationships to VNC gene expression
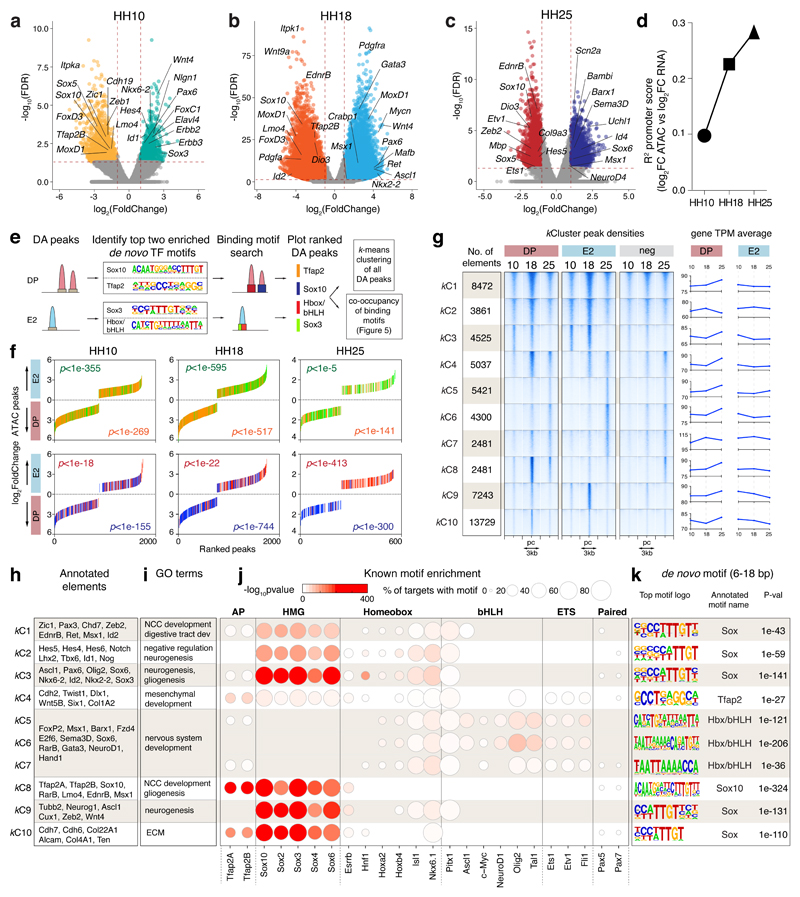
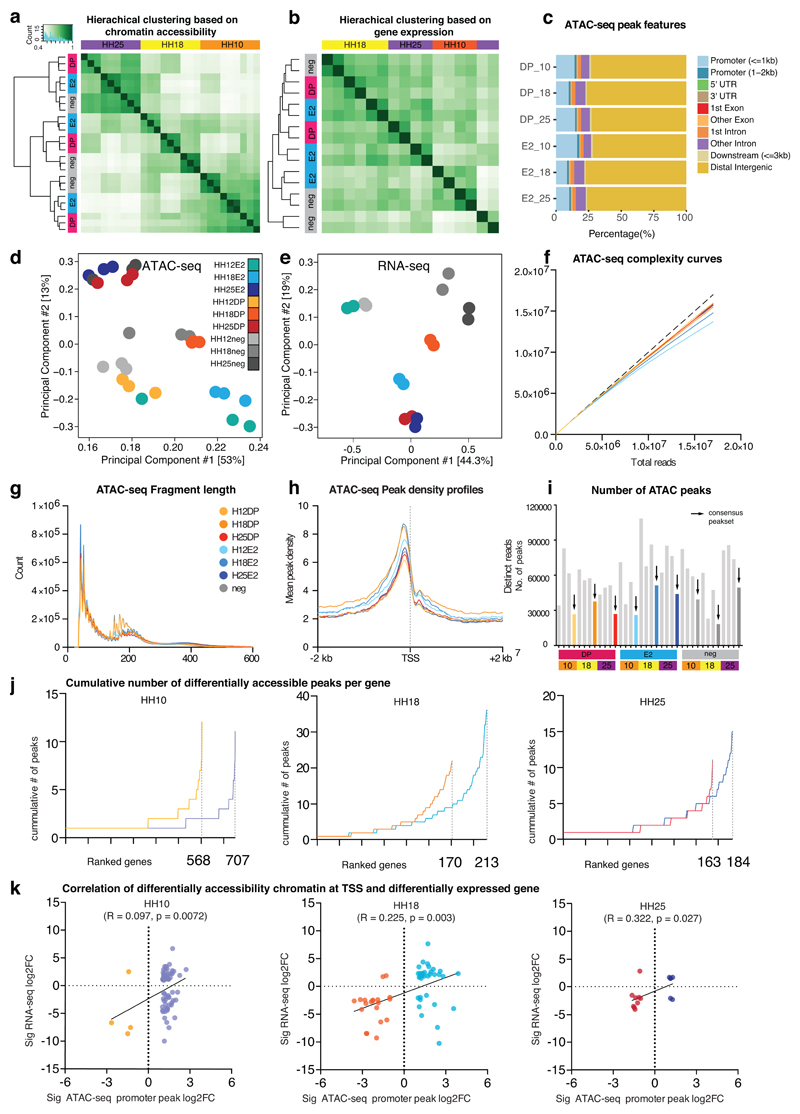
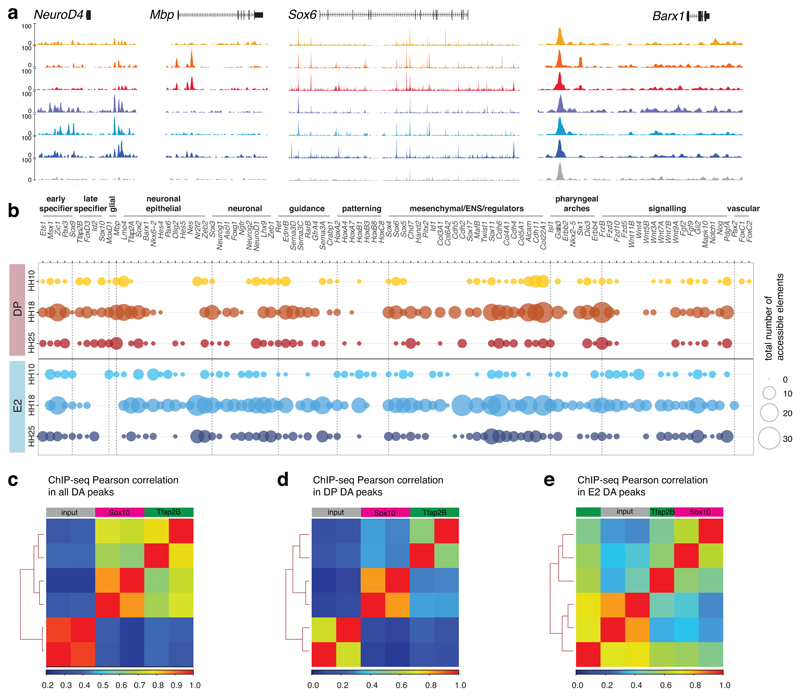
To determine the regulatory landscape governing the observed transcriptional heterogeneity, we performed ATAC-seq on DP and E2 populations across the three stages described. Profiles were highly reproducible, displaying similar peak densities and complexity between replicates, which clustered by stage as well as cell type (Extended Data Figs. 4a, c, d, f, g, h), thus allowing identification of distinct DP and E2 regulatory signatures. DA analyses of consensus peak sets displayed significant DA peaks annotated to bona fide NC genes at HH10 (Sox10, FoxD3, Tfap2), whereas the E2 population contained significant DA elements regulating neuroepithelial in addition to mesenchymal transcription factors (TFs) (Figs. 5a-c). These distinct profiles were maintained from HH10 and by HH18 to HH25, other genes associated with differentiation of VNC derivatives or previously described as expressed in the gut much later, like NeuroD4, NeuroD19, and Mbp, became differentially accessible (Fig. 5c). As such factors were not as yet readily expressed (Fig. 3a, Extended Data Fig. 3i), the observed epigenomic dynamics reflected preparation of the chromatin landscape prior to transcription (Extended Data Fig. 5a). Cumulatively, DA peaks showed an increase in the number of elements per gene from HH10 to HH25 (Extended Data Fig. 5b). When DA promoter peaks were assigned to differentially expressed genes genome-wide (p-adjusted<0.05, log2FoldChange>1; Fig. 5d, Extended Data Fig. 4k), we observed a positive correlation with the expression of protein-coding genes that increased over time. This suggested that the regulatory programmes were defined and prepared early during NC specification. While the later conversion of DP to E2-only cells is theoretically possible, this scenario is much less plausible given the extent of the chromatin landscape remodelling that would need to take place over a very short period of time.
Figure 5. Analysis of differential TF motifs within differentially accessible elements uncovers Tfap2, Sox10, Sox2/3, and Hbox/bHLH as core TFs.
(a-c) Volcano plots highlighting top DA peaks from DiffBind analysis across triplicates at HH10, HH18 and HH25. Negative FoldChange indicates peaks enriched in the DP and positive FoldChange peaks enriched in E2-only population. P-values obtained using Wald test with Benjamin-Hochberg correction (False Discovery Rate, FDR) plotted against the FoldChange on a log scale.
(d) R2 score calculated from the coefficient of determination between effect sizes of significantly DA promoters and significantly differentially expressed (DE) genes closest to those promoters. See Extended Data Fig. 4k for individual values.
(e) Motif enrichment search strategy.
(f) De novo motif occurrence within ranked merged DA peaks across triplicates associated with merged DE genes across duplicates. Each coloured bar represents a peak containing the newly nominated top motif: Tfap2, Sox10, Sox3 and Hbox/bHLH. If the peaks contain both motifs represented, lines of the respective colour are plotted next to each other. See Extended Data Fig. 4i, j for total number of DA peaks per condition. P-value obtained in DESeq2 DA analysis using Wald test with Benjamin-Hochberg correction.
(g) K-means clustering of DA regions across stages and samples highlighting number of elements and peak density profiles. Each cluster is accompanied by the average gene TPM across analysed stages.
(h, i) Genes assigned to the top 100 elements per k-cluster and significantly enriched Gene Ontology terms obtained using statistical overrepresentation (p<0.01); p-values calculated with binomial distributions and Bonferroni correction for multiple hypothesis testing.
(j) Top known upstream motif enrichment as predicted by Homer analysis of merged DA peaks (no. elements stated in Fig. 5g) across triplicates with the colour gradient indicating the -log10pvalue of enrichment analysis over total background peaks using binominal p-testing and the bubble size indicating the percentage of target peaks with given motif and positions, clustered according to TF families.
(k) Top de novo motifs enriched in merged DA peaks (no. elements stated in Fig. 5g) across triplicates within each cluster obtained by Homer; p-values determined by binominal test, using all peaks as background.
Differential TFs usage is associated with regulators of neural and neuronal cell differentiation
Homer27 de novo motif enrichment analysis of DA peaks identified Tfap2 and Sox10 motifs as the most significantly enriched in DP, and the SoxB and Homeobox (Hbox)/basic Helix-Loop-Helix (bHLH) in the E2 population (Fig. 5e, Supplementary Table 1). We positioned these binding sites within all the DA elements and ranked them according to their log2FoldChange values obtained in the DA analyses. While at HH10 all four motifs distributed equally across the peaks, by HH18 we observed preferential presence of Tfap2 and Sox10 motifs within DP peaks, whereas SoxB and Hbox/bHLH were biased towards E2 population. At HH25, we detected significant use of Hbox/bHLH motifs within the E2 (p<1E-413) and Sox10 within DP elements (p<1E-300), whereas preferential usage of SoxB or Tfap2 was no longer observed (Fig. 5f). Higher resolution analysis across 84937 merged consensus peaks using k-means clustering28 identified 10 cohesive groups of elements (k-Clusters 1-10, kC1-kC10) showing DA dynamics across the stages and cell populations (Fig. 5g). By annotating these clustered elements to the nearest promoter (TSS) and selecting the top 200 associated genes for statistical overrepresentation analysis (Fig. 5h, i), we found that the elements broadly mediated processes of nervous system development (kC1, 3, 5-9), negative regulation of neurogenesis (kC2), mesenchymal development (kC4) and extracellular matrix development (kC10).
Upstream cis-regulatory codes and the known TF motifs enriched within each identified cluster showed that HMG-box containing TFs including Sox factors were distributed across all clusters, but absent from elements active at later stages (Fig. 5j). Tfap2 factors were enriched specifically within the DP population (notably in the kC4 and kC8 clusters), whereas members of Hbox, bHLH families of TFs driving differentiation into VNC derivative fates were predominantly enriched at later stages. De novo motif analyses within each cluster equally singled-out Tfap2, Sox10, Sox2/3, and Hbox/bHLH as top enriched TFs, thus highlighting them as the core factors driving our DA elements (Fig. 5k).
Combinatorial regulatory codes reveal dynamic uses of enhancer elements to drive VNC derivative programmes
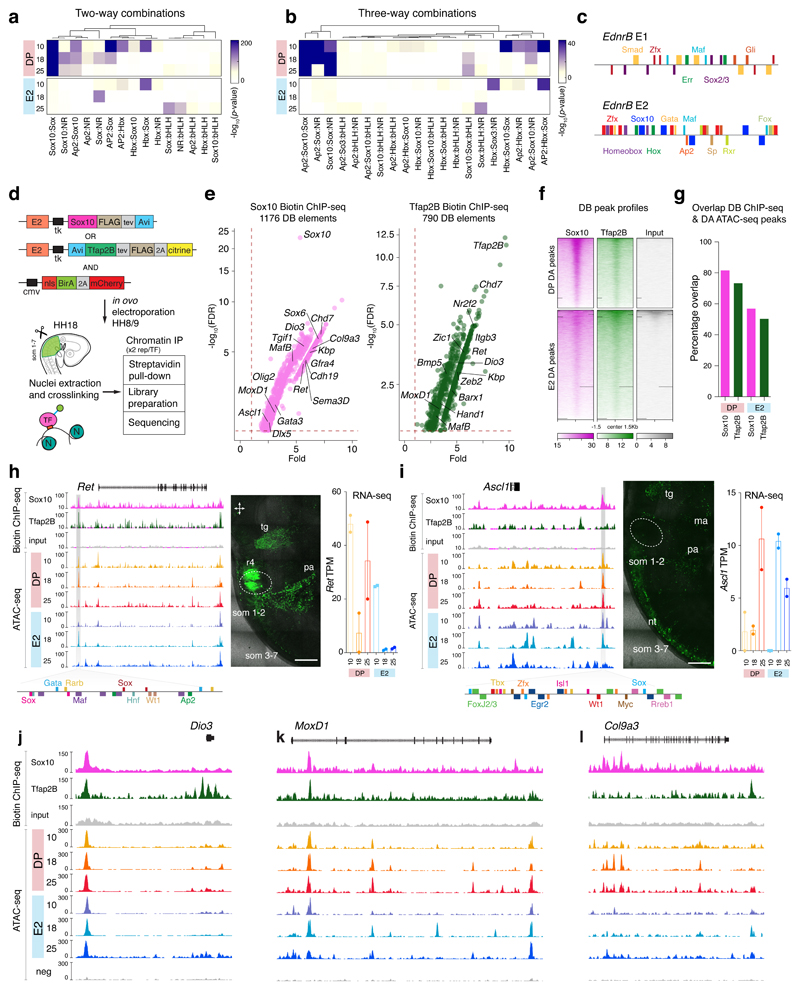
TFs tend to work in combination, collaboratively or competitively, to accurately regulate hundreds of genes by binding to their regulatory elements29. We therefore performed two-way (2TF) and three-way (3TF) heterotypic co-occupancy analysis and included two other top-scored candidates TFs as per our de novo motif analysis: Hbox and nuclear receptors NR(1) (Fig. 6a,b; Supplementary Table. 1). Tfap2 motif co-occupied the same elements as Sox10, Sox, NR(1), and Hbox within the DP population at earlier stages, but within the E2 population, Tfap2 only showed significant co-binding with Hbox (p<1E-63) and Sox (p<1E-42) at HH10. Given that Tfap2B expression levels were high within both the neural and mesenchymal single-cell cluster cells (Fig. 4b), this finding indicated that different Tfap2 interacting partners drove different lineages. Conversely, significant 3TF combinations with Sox10 (Tfap2:Sox10:Sox, p<1E-43; Sox10:Sox:NR(1), p<1E-46 and Sox10:Sox:bHLH, p<1E-21) only became more apparent at HH25. Interestingly, Sox appeared to require a different partner at each analysed stage, Hbox at HH10, NR(1) at HH18 and bHLH at HH25, suggesting a highly dynamic co-regulatory code. To show binding combinations, we annotated TF binding motifs predicted using the MEME suite30 on EdnrB E1 and E2 enhancers, previously shown to drive NC activity. E2 contained binding sites for Sox10, Tfap2 as well as Rarb and Maf while E1 showed binding sites for Sox, Maf, and Zinc Finger proteins (Fig. 6c) suggesting that these factors may drive EdnrB activity specific to the E2-only population and that Zinc finger factors may be key in the neuronal differentiation process.
Figure 6. Combinatorial analysis of top de novo motif reveals dynamic use of enhancers to drive cell lineage specification validated by Sox10 and Tfap2B differential binding.
(a, b) 2-way and 3-way co-occupancy analysis of top de novo motifs. P-values were calculated using two-tailed Chi-squared test with Bonferroni correction.
(c) Motif binding analysis within +/-200 bp from the centre of the peak for EdnrB E1 and E2 enhancers.
(d) BiotinChIP-seq experimental strategy. E2 enhancer driven Avi-Tagged Sox10 and Tfap2B constructs are co-electroporated with ubiquitously-driven NLS-BirA-mCherry into the neural tube of chicken embryos at the premigratory NC stage (HH8/9) and cells are harvested at HH18.
(e) Differential binding (DB) analysis of Sox10 (magenta) and Tfap2B (dark green) BiotinChIP-seq showing peaks with Fold change >1 and FDR <0.05. Adjusted p-values (FDR) obtained using Wald test with Benjamin-Hochberg correction are plotted on a log scale in function of fold enrichment. Positions of bound elements associated to key regulators are indicated.
(f) Heatmaps depicting profiles of differentially bound BiotinChIP-seq peaks within DP and E2 populations. Gradient scales indicate baseline-normalised read counts.
(g) Percentage overlap of DB ChIP-seq peaks and DA ATAC-seq elements within DP and E2 populations.
(h) Ret putative enhancer, ~14 kb upstream of the Ret TSS, drives Citrine expression within trigeminal ganglia (tg), rhombomere 4 (r4), pharyngeal arches (pa), and dorsal root streams along somites (som) 1-7 (6 embryos). Multiple motifs including Sox10 and Tfap2 are predicted within +/-200bp from the peak centre. Bar plot shows the average gene TPM from RNA-seq analysis. Error bars indicates SEM. Scale bar = 0.5 mm
(i) Ascl putative enhancer, ~18 kb downstream from Ascl TSS shows activity within the neural tube (nt), pharyngeal arch (pa), mandibular arch (ma), trigeminal ganglia (tg), and dorsal root streams from somites 1-7 (6 embryos). Multiple motifs including Sox are revealed within +/-200bp from the peak centre. Bar plot shows the average gene TPM from RNA-seq analysis. Error bars indicates SEM. Scale bar = 0.5 mm
(j,k,l) ATAC-seq and biotinChIP-seq genome browser tracks for Dio3 (j), MoxD1 (k) and Col9a3 (l) highlighting elements differentially bound by Sox10 and Tfap2B.
Biotin ChIP-seq26 for Sox10 and Tfap2B was employed to validate binding events and direct regulatory targets across the two VNC populations (Figs. 6d, Extended Data Figs. 5c-e). Differential occupancy analysis confirmed Sox10 binding enrichment in DA regulatory elements controlling genes such as Ret and Gata3, but also highlighted targets like Kbp and Sema3D, both of which have been implicated in HSCR31 (Fig. 6e). Tfap2B additionally directly targeted mesenchymal TFs like Hand1 and MafB (Fig. 6e), with peak profiles confirming its enrichment within the DP population (Fig. 6f) and a greater overlap with DA peaks compared to E2 (Fig. 6g).
We next examined differential binding at two loci previously involved in ENS development4 and found that while both Sox10 and Tfap2B regulated the upstream Ret enhancer active in VNC at HH18, positioned ~14kb away from the TSS (Fig. 6h), Ascl1 enhancer positioned ~18kb downstream from locus that displayed the neural tube and NC derivative activity at HH18, was only bound by Sox10 (Fig. 6i). Sox10 and Tfap2B also directly bound to open elements near the Dio3 and MoxD1 genes (Figs. 6j, k), while the entire 5’ intronic enhancer cluster of Col9a3, specifically accessible in the DP population, was only bound by Sox10 (Fig. 6l). Thus, the differences in combinatorial TF binding and binding intensities between populations and stages revealed precisely coordinated codes for VNC cell differentiation.
Functional perturbations of core TFs validate gene regulatory interactions in VNC
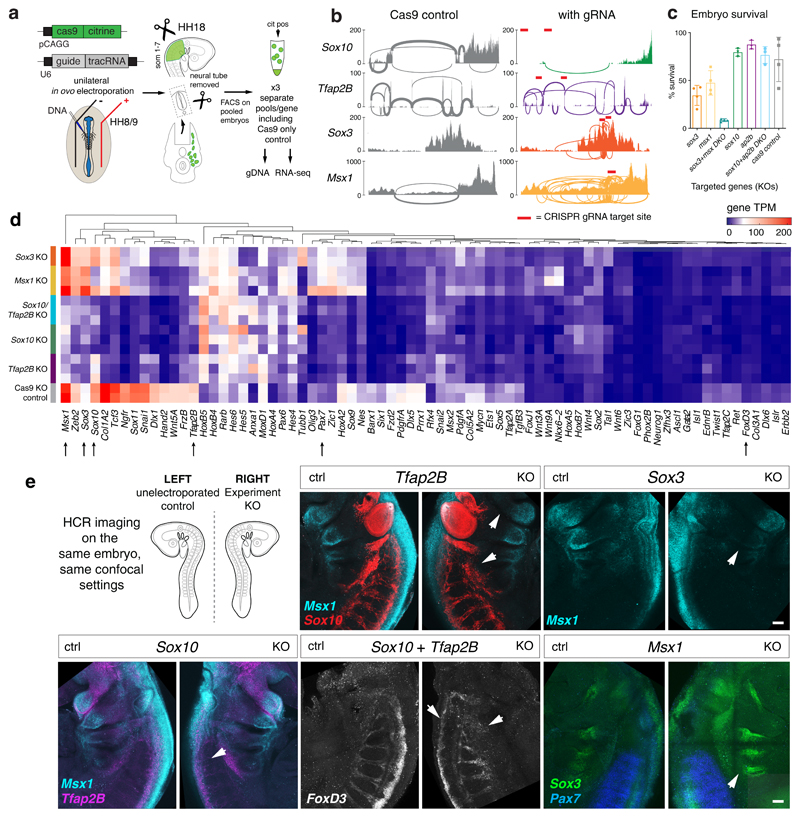
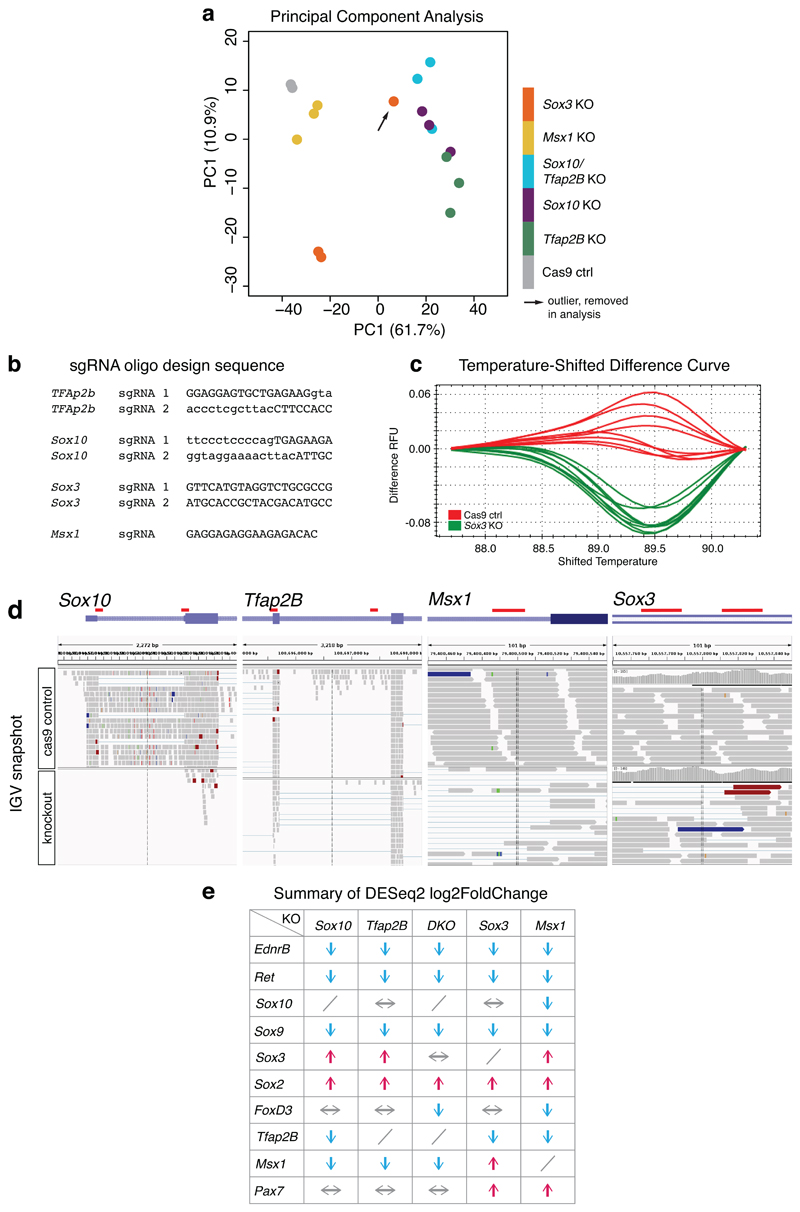
To functionally validate identified upstream core signatures and regulatory connections, we performed in vivo knockouts (KOs) of Tfap2B, Sox10, Sox3, and Msx1 genes in VNC, followed by RNA-seq of KO versus control cells (Fig. 7a, Extended Data Figs. 6a). We used the previously described Msx1 gRNA targeting essential donor splice site32, whereas for Sox3, Tfap2B and Sox10, we employed a double gRNA strategy to increase KO efficiency (Figs. 7b, Extended Data Fig. 6b-d). Mis-splicing events showed the efficiency of gRNAs/Cas9 to disrupt the targeted genes (Fig. 7b). We observed less than 50% survival in the case of Sox3 and Msx1 KO at HH18, whereas double KO of these genes resulted in less than a 10% survival rate (Fig. 7c). In contrary, Sox10 KO, Tfap2B KO, and double Sox10/Tfap2B KO (DKO) embryos had high survival rates likely due to our targeting strategy, only affecting later stage NC cells compared to published null allele KOs33, 34.
Figure 7. Functional validation of upstream TFs in VNC specification analysed at HH18.
(a) CRISPR/Cas9 mediated strategy for upstream core TF knockout (KO). Cas9-2A-Citrine and sgRNA expression constructs are co-electroporated into neural tube of HH8/9 chicken embryos in ovo and incubated until HH18. The region indicated in green in the schematic is dissected, neural tube removed and dissociated cells FAC-sorted to isolate Citrine-positive cells for use in gDNA validation assays and RNA-seq.
(b) Sashimi Plots of control and experimental targeted gene loci with CRISPR guide RNA target highlighted in red. Sox10 KO showed efficient loss of exon while Tfap2b, Sox3 and Msx1 showed an increase in number of new splicing events particularly at the gRNA sites.
(c) Bar plots showing embryo survival across multiple KO experiments. N=4 independent experiments including 30 embryos each, except for Sox10, Tfap2B and Sox10/Tfap2B double KOs (DKO) for which n=3 experiments was used. Error bars indicate standard deviation. The percentage of survival from the total number of embryos electroporated were calculated and displayed.
(d) Unbiased clustering of RNA-seq gene expression in transcripts per million (TPM) across all KO and control conditions, shown across replicate samples. Expression of selected TFs, mesenchymal, signalling or extracellular matrix genes is depicted.
(e) HCR imaging on selected TFs performed on the same embryo after KO, where the Left represents the non-electroporated endogenous gene pattern and the Right represents the experimental, KO side (3 biological replicates per KO). Scale bar = 50 μm.
In all KO conditions, we observed an overall downregulation of mesenchymal NC genes and ECM and guidance molecules (Fig. 7d). Direct downstream targets of Sox10 and Tfap2B as identified by our Biotin ChIP-seq were downregulated in the Sox10 and Tfap2B KOs while pro-neural bHLH were downregulated in the Sox3 and Msx1 KOs. A significant increase in neuronal genes was observed in the Msx1 and the Sox10/Tfap2B double KO (DKO) but not in Tfap2B KO alone, suggesting the upregulation of the neuronal differentiation programme and depletion of the neural programme in the absence of Sox10 (Figs. 7d, Extended Data Fig. 6e). Sox3 KO appeared to upregulate Sox10 but downregulate Tfap2B, thereby only affecting a few downstream Sox10 targets independent of Tfap2 regulation. This affirmed the importance of combinatorial TF activities to regulate specific factors within the GRN. As Sox2 was upregulated in the Sox3 KO, compensation mechanisms35 could account for a less severe neuronal expression phenotype. By assessing a selected range of expression patterns in KO embryos using HCR in situ (Fig. 7e), we observed dysregulation of selected target gene expression in the pharyngeal arches or the NC dorsal root streams validating the KO experiments. In summary, our data not only functionally probed the core TFs within the VNC-GRN but also highlighted potentially genetic compensatory mechanisms that maintain the network robustness.
Reconstructing the VNC-GRN
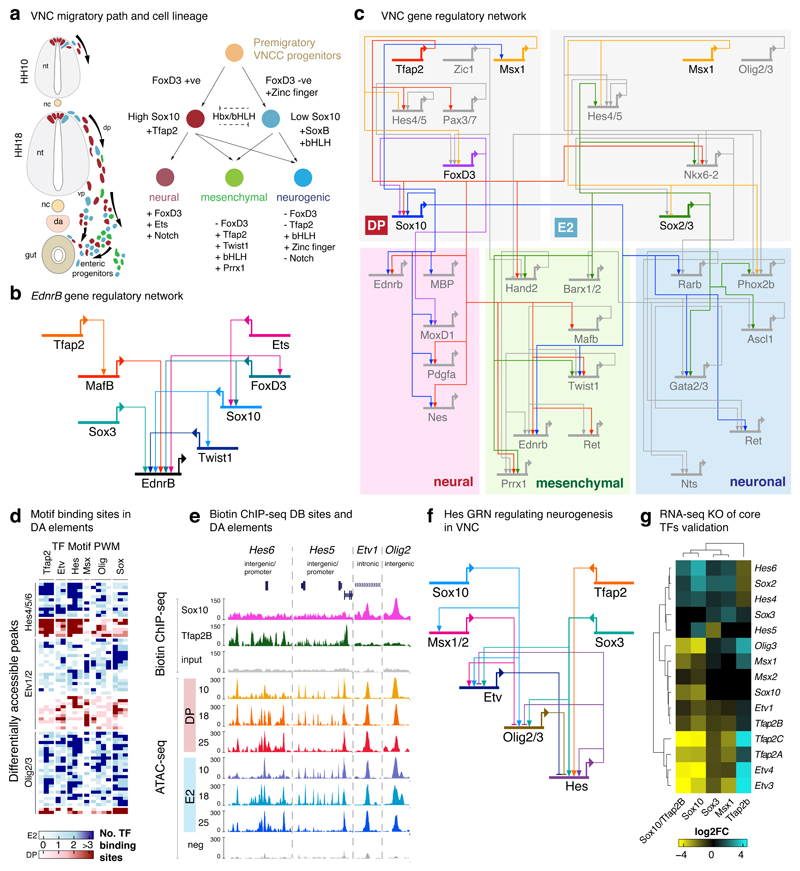
We have shown that a heterogeneous population of VNC delaminating from the neural tube (Fig. 8a, left) can be dichotomised based on their Sox10 and FoxD3 expression patterns, with Sox10high/FoxD3+ population maintaining its multipotent neural ability to form all three lineages while the Sox10low/FoxD3- population is restricted to the neuronal and mesenchymal fates (Fig. 8a, right). To explore distinct chromatin signatures and uncover larger co-binding dynamics of TFs mediating the VNC-GRN, we performed a comprehensive high-resolution survey of 77 vertebrate TF motifs (p<0.0001, Binomial test) across our DA elements. We assimilated the data and reverse engineered the gene regulatory circuits governing expression of selected factors like Ednrb (Figs. 8b, Extended Data Figs. 7a-b) to define the hierarchies within the VNC-GRN (Fig. 8c).
Figure 8. Deconstruction of the VNC GRN.
(a) Summary graphic of migrating VNC showing mix heterogeneity of cells leaving the neural tube at HH10 and regionalising at HH18 (Left). VNC cell lineage decisions showing dichotomy of cells through FoxD3 expression, offering a Sox10high and Sox10low population (Right). nt=neural tube, nc=notochord, dp=dorsal path, vp=ventral path, da=dorsal aorta
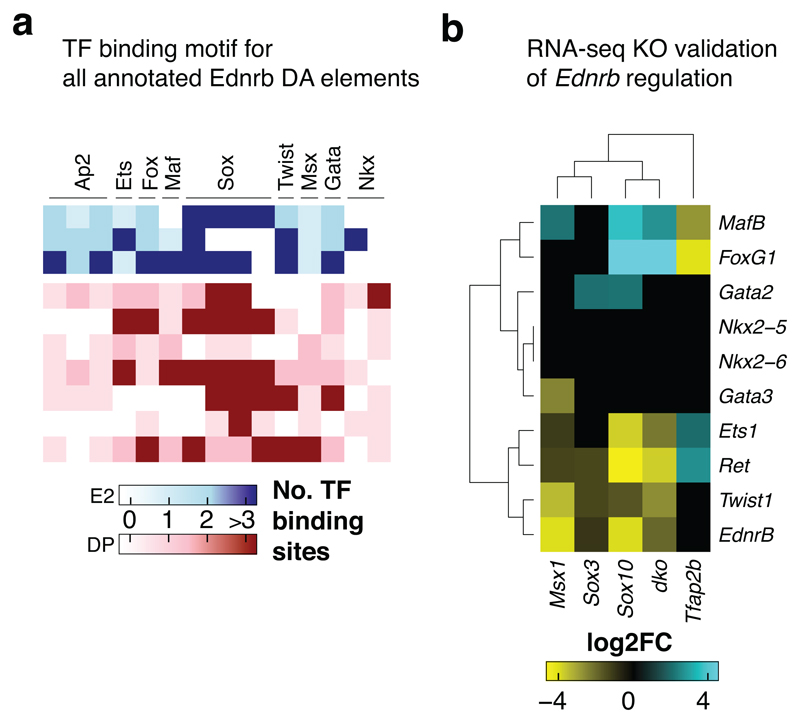
(b) EdnrB GRN deconstructed from motif binding analysis shown in Figure 5c along with other enhancers, biotinChIP-seq dataset and RNA-seq KO experiments in Extended Data Fig 7. Ednrb is indirectly controlled by Tfap2, while Sox10 and SoxB directly input into its enhancers along with MafB, Twist, Fox and Ets.
(c) Proposed VNC GRN highlighting the core TFs and other factors in grey feeding into three lineages; neural, mesenchymal and neuronal.
(d) Motif binding sites on DA elements focusing on a selected number of TFs showing motifs for Tfap2, Etv, Hes and Olig.
(e) UCSC genome browser screenshot depicting tracks of biotinChIP-seq and ATAC-seq experiments highlighting differentially binding and differentially accessible elements within Hes6, Hes5, Etv1 and Olig2 loci.
(f) Proposed Hes GRN circuit with indirect regulation by Sox10 mediated via Msx1, Etv and Olig, which feed directly into Hes enhancers. Hes receives direct regulatory inputs by SoxB and Tfap2B.
(g) Heatmap of differential gene expression following knockout of core TFs validating proposed Hes GRN. FoldChange values are calculated by DESeq2. In Sox10 KO, Hes is upregulated, while its direct transcriptional repressors (Etv and Olig) are downregulated. Upon its upregulation, Hes feeds back to repress Etv and Olig, thereby this feedback loop is dysregulated when Tfap2B and SoxB are knocked out.
To further highlight detail of VNC regulation, we chose the Hes family members, key regulators of neurogenesis36 shown here to be expressed in Sox10+ cells within the gut (Fig. 3c). By integrating enhancer binding motif enrichment (Fig. 8d) with TF binding information (Fig. 8e), we ascertained the that while Hes is directly activated by both Tfap2 and SoxB, it is also indirectly controlled by Sox10, which directly activates its transcriptional repressors Etv and Olig (Fig. 8f). This circuit was functionally validated by our KO experiments (Fig. 8g), highlighting the complex dysregulation of factors involved. Therefore, our datasets have allowed us to dissect the global VNC-GRN and individual gene regulatory circuits that drive VNC cell fate decisions at a greater resolution.
Discussion
Genome-wide analyses parse VNC diversity driven by core TF regulators
The VNC not only majorly contributes to the ENS but also gives rises to derivatives in the thymus37, thyroid gland38, heart39, lungs40, sympathetic ganglia41, and pancreas42. By dissecting the regulatory circuitry that generates VNC-derived glia, neurons or mesenchyme, we uncovered a vast matrix of gene regulatory interactions that precisely activate specific programmes and repress undesired fates using a combination of multiple TFs to guide the cell fate decisions. Our study offered mechanistic insight into the elegant fate-mapping experiments performed by Nicole Le Douarin and colleagues, who found that quail VNC (somites 1-7) grafted to replace the host chick NC at the adrenomedullary level (somites 18-24), still ended up invading the gut of the host and differentiating into enteric ganglia5, 43. The intrinsic bias to colonise the gut regardless of the anatomical level at which the VNC are grafted suggested a degree of predetermination before delamination5, 43.
We focussed our efforts on incorporating chromatin accessibility and gene interactions to define VNC-GRN and identify Tfap2, Sox, Hbox and bHLH families of TFs as core regulators orchestrating the delineation of VNC. We highlighted the role of Tfap2 in combination with Sox10 in driving the neural fate, the role of Tfap2B with other TFs in driving cardiac crest/arches/mesenchymal development and that of SoxB playing a critical role for the neuronal derivatives.
VNC contributes to mesenchymal cells within the ENS
Soldatov et al.15 highlighted a mesenchymal fate split in post-otic mouse NC at E9.5 (HH18 in chicken) and described key regulators like Prrx1 and Twist1 within this NC cell fate cluster, similar to our findings. Here, we have shown that VNC expressed mesenchymal genes at HH18 but importantly, that these genes were also specifically maintained within the VNC-derived cells in the gut at HH25, highlighting NC-derived mesenchymal cells during ENS and gut development. Indeed, VNC cells have previously been shown to be a mediator of mesenchymal-epithelial interactions to control stomach size, patterning, and differentiation44. Additionally, VNC contribution to the mesenchyme of the glands in the neck and pericytes surrounding capillaries and connective tissue in the region45 hints at the possibility that these VNC-derived mesenchymal cells are critical for maintaining ENS structural integrity.
VNC-GRN informs on tissue-specific regulation of Ednrb and Ret
From a gene regulatory perspective, our analyses highlight how key ENS and HSCR disease risk genes, such as EdnrB and Ret are regulated. By integrating our datasets, we deconstructed the EdnrB GRN circuit showing direct and indirect control from core TFs, thus explaining its differential regulation in other NC lineages and persistence of EdnrB expression in these cell types in Sox10-null mouse embryos46. Similarly, our Ret enhancers harboured binding sites for Sox10, Gata and Rarb that were previously described to be an important triad in the RET GRN3 in addition to other motifs such as Maf, in keeping with a recent study that found MafB regulated Sox10, which in turn regulates Ret, during cardiac NC development21.
By assimilating all our validated genome-wide omics datasets, we have uncovered the early establishment of the VNC developmental cis-regulatory landscape underlying a paradigm of core regulatory circuitries with distinct and dynamic conglomeration of TF signatures to drive cell identity, thus enabling future studies focusing on deciphering specific lineage subtypes.
Methods
Embryo culture and electroporations
Fertilised wild-type chicken eggs were obtained from Henry Stewart & Co (Norfolk) and incubated until the desired stage. Embryos were staged according to Hamburger and Hamilton (HH) (1951) references47. All experiments were performed on chicken embryos younger than 12 days of development, and as such were not regulated by the Animals (Scientific Procedures) Act 1986. Ex ovo electroporations were performed as previously described48. For in ovo experiments, HH8/9 embryos were windowed and DNA (2.5 μg/mL) was injected into the lumen of the neural tube prior to passing two sets of electrical current bilaterally. First set of three square 50 ms pulses (12.5 V) with 100 ms rest periods in between were applied, the polarity was inverted before the 2nd set of pulses was applied with the same settings. This approach ensured electroporation of DNA constructs into both sides of the neural tube. However, unilateral electroporations were carried out for the knockout experiments using pcU6_3 sgRNA (Addgene #92359) and pCAG Cas9-2A-Citrine (Addgene #92358) constructs32 at 1.0 μg/mL. For all experiments, eggs were incubated at 37ºC until desired stages. The study is compliant with all relevant ethical regulations regarding animal research. The age of the embryos prevented any selection by sex.
Flow cytometry
Dissected regions from electroporated embryos were dissociated with Dispase (1.5 ml/mL in DMEM/10 mM Hepes pH 7.5) at 37ºC for 15 mins with intermittent pipetting and a final 0.05% Trypsin incubation at 37ºC for 3 minutes. The suspension was then added to an excess of Hanks solution (1X HBSS, 0.25% BSA, 10 mM Hepes pH 7.5) buffer. Cells were spun down for 10 mins at 500g, resuspended in Hanks and passed through a 40 μM cell strainer. Pelleted cells were resuspended in 200-300 μL of Hanks prior to being subjected to FAC-sorting using BD FACS-Aria Fusion. We isolated approximately 300 Citrine+ NC cells per embryo at HH10, 800-1000 NC at HH18 and 800-1000 NC per dissected gut at HH25.
ATAC, library preparation and sequencing
Assay for transposase accessible chromatin followed by sequencing (ATAC-seq) processing following the original protocol with some modifications18, 49. In short, FAC-sorted cells were first lysed using IGEPAL solution and transposed using Illumina Nextera Tn5 transposase (FC-121-1030) for 20-30 minutes at 37ºC. Tagmented DNA was amplified using NEB Next High-Fidelity 2X PCR Master Mix for 11 cycles and tagmentation efficiency was assessed using Agilent Tapestation. ATAC-seq libraries were sequenced using paired-end 40 bp reads on the Illumina NextSeq 500 platform to acquire approximately 20-30M fragments per sample. Three biological replicates were used for each stage (HH10, HH18, HH25) and sample (double positive, single E2-only, Citrine-negative control per stage) and sequences within the same batch to prevent batch effects correlated with the biological condition of interest.
Bulk RNA extraction, RNA-seq library preparation and sequencing
Total RNAs from FAC-sorted cells were isolated using the Ambion RNAqueous Micro Total RNA isolation kit (Cat #AM1931, ThermoFisher Scientific) and integrity checked using Agilent Tapestation (only samples with a RNA Integrity Number >6 were used for library preparations). Samples were stored at -80ºC until all replicates were collected and sample libraries were prepared on the same day to prevent batch effects. Libraries were prepared using Takara SMART-Seq™ v4 Ultra™ Low Input RNA kit (Cat #634889, Takara Bio Clontech) and sequenced using 40 bp paired-end reads on the Illumina NextSeq 500 platform using TG NextSeq® 500/550 High Output Kit v2 (75 cycles). Two biological replicates were used for each stage (HH10, HH18. HH25) and sample (double positive, single E2-only and Citrine-negative control per stage).
Single cell 10X preparation and sequencing
Single-cell RNAseq was performed on the 10X Chromium platform and libraries prepared at the MRC WIMM Institute Single Cell Core Facility using the Chromium Single Cell 3’ Library and Gel Bead Kit v2, 4 rxns PN-120267. E2:Citrine was electroporated in ovo into the lumen of the neural tube and incubated until HH18 stage. The vagal region from somites 1-7 axial level was dissected and dissociated as described above, prior to FAC-sorting. Approximately 2000 FAC-sorted cells were pooled with a collaborator’s experiment using zebrafish cells (carrying mCherry transgene). Final libraries were sequenced on the standalone mode on the Illumina NextSeq 500 platform using TG NextSeq® 500/550 High Output Kit v2 (150 cycles) and settings set to paired-end single index parameters as specified in the manufacturer’s protocol.
Enhancer cloning and preparations
Putative enhancer elements were amplified from purified chick genomic DNA using primers containing specific sequence tails to the modified pTK:Citrine nanotag reporter vector adapted to type IIs restriction enzyme-based cloning as previously described18. Endotoxin-free plasmid preparations (E.Z.N.A. Endo Free Plasmid Mini Kit II, Cat #D6950-02, Omega Bio-Tek or Qiagen endo-free maxi prep kit, Cat#12362, Qiagen) were used for electroporations as described above32.
Cryosectioning and immunostaining
Embryos selected for cryosectioning were fixed in 4% paraformaldehyde (PFA) for 1 hour at RT or overnight at 4ºC. Embryos at HH18 and HH25 were fixed at 4ºC overnight. Fixed embryos were washed in 3 changes of 1X PBS and cryoprotected in 15% sucrose/PBS overnight at 4ºC, brief incubation in 15% sucrose/100% OCT prior to mounting in OCT, stored at -80ºC and later sectioned at 10 μM thickness.
For immunofluorescence assays, slides with collected sections were washed in 1X PBS to remove the OCT. Sections were then blocked using 1% Normal Goat Serum/1% DMSO and 0.1% Triton-X in 1X PBS for at least 20 mins at RT. Slides were rinsed and incubated overnight at 4ºC with primary antibody (1:250 dilution of rabbit anti-GFP Cat #TP401, Torrey Pines Biolabs and 1:200 mouse anti-mCherry Cat#632543, Living Colors®, Takada). Sections were washed in 1X PBS the following day followed by incubation with secondary antibody (Alexa Fluor-488 donkey anti-rabbit IgG diluted at 1:500 in blocking solution and AlexFluor-594 donkey anti-mouse IgG diluted at 1:500 in blocking solution) for at least 2 hours at RT. Sections were then washed extensively in 1X PBS + 0.1%Tween (PBST) and mounted using VectaShield with DAPI (1:1000 Cat#H-1200, Vector Laboratories) and kept at 4ºC prior to confocal imaging.
For whole mount staining, dissected guts were fixed overnight at 4ºC in 4% PFA. Tissues were washed with 1X PBS/1% Triton-X/1%DMSO (PBSDT) and blocked using 1% Normal Goat Serum in PBSDT for at least 20 mins at RT. Embryos were then incubated overnight at 4ºC with primary antibody in PBSDT/Block (anti-GFP) washed extensively in PBSDT the following day prior to incubation with secondary antibody (1:500 Alexa Fluor-647 goat anti-mouse or 1:500 Alexa Fluor® 647 anti-Tubulin B3 (Tubb3/Tuj1) Mouse IgG2a Cat#801209, a kind gift from Tudor Fulga, Oxford, or 1:500 Alexa Fluor® 647 anti-GFAP Mouse IgG2b Clone 2E1.E9 Cat#644706). Embryos were then washed with PBSDT and kept at 4ºC prior to confocal imaging.
In situ Hybridisation Chain Reaction (HCR) assays
HCR kit (v3) containing DNA probe sets, amplifier and hybridisation buffers were purchased from Molecular Instruments for each target mRNA23. The protocol provided by the manufacturer was followed with optimisations. Embryos were fixed in 4% PFA for 1 hr at RT or overnight at 4ºC, then bleached in 3% H2O2/8% KOH until the embryo was cleared of any pigments. Bleached embryos were further fixed in 4% PFA for 20 mins prior to dehydrating in 100% MeOH and stored at -20ºC. Following a rehydration step with graduated series of MeOH/PBST, embryos are digested with 10 μg/mL of Proteinase K for 10 mins (HH10) and 30 mins (HH18) and post-fixed in 4% PFA for 20 mins. Embryos were equilibrated with 5X SSCT and incubated with the probes in hybridisation buffer at 37ºC overnight. Probes were removed and after a series of washes incubated in hairpin solution with amplifying buffer overnight at RT prior to whole mount imaging. For in situ hybridisation with the eGFP HCR targeted against the reporter fluorophore, an additional DNAse digestion step was carried out after the rehydration step using Ambion DNAseI 50 U/mL in 10X DNAseI buffer for 1 hour at 37ºC to remove the remaining episomal plasmid from the embryo. For immunofluorescence after HCR, dissected gut tissues were fixed in 4% PFA for 20 mins followed by several washes of PBST before blocking with PBSDT for 1 hour prior to following the protocol above.
Generation of E2 driven Avi-tagged Sox10 and Tfap2B constructs
Two different modified pTK plasmids were used for the final construct for N-term or C-term cloning. The C-term plasmid has additional cloning sites for NcoI and SnaBI after the chimeric intron followed by linkers, a FLAG tag, a TeV recognition peptide and the AviTag before the polyA region. The N-term plasmid has the AviTag after the chimeric intron followed by a TeV recognition peptide, FLAG tag, an EcoRV restriction enzyme site, followed by a 2A:Citrine. The E2 enhancer was initially cloned into both N-term and C-term plasmids using the aforementioned BsmBI cloning protocol. Subsequently, full length Sox10 cDNA was cloned using InFusion® method into the NcoI-SnaBI linearised C-term plasmid while full length Tfap2B cDNA cloned into the linearised EcoRV N-term plasmid (both to avoid the Avi-tag near the predicted DNA binding sites).
Biotin ChIP-seq
Biotin ChIP-seq protocol was slightly modified from previously published version26. Avi-tagged constructs (1.0 μg/uL) were co-electroporated with a pCI NLS-BirA-2A-mCherry plasmid (0.5 μg/uL) into the neural tube of HH8 embryos bilaterally. 15 HH18 embryos were harvested and their vagal regions (somites 1-7) dissected, offering an approximately 100,000 cells of interest. Tissues were dissociated in nuclei extraction buffer (NEB: 0.5% NP40, 0.25% Triton-X, 10 mM Tris-HCl (pH 7.5), 3mM CaCl2, 0.25M sucrose, 1mM DTT, 0.2 mM PMSF, 1X Proteinase inhibitor) by gentle pipetting. Cells were cross-linked using 1% formaldehyde at RT for 15 mins and quenched with 125 mM of 1M glycine for 5 mins at RT. Cross-linker was washed out 3 times with 1X PBS/PI (1X PBS, 1X PI, 1mM DTT and 0.2 mM PMSF) centrifuging at 2000xg for 4 mins at 4ºC. Pellets were snap-frozen and stored at -80ºC until further replicates were collected. Pellets were thawed and re-suspended in NEB and washed 1X with PBS/PI prior to nuclei lysis in SDS lysis buffer (0.7% SDS, 10mM EDTA, 50 mM Tris-HCl (pH 7.5), 1X PI). Cross-linked chromatin was sonicated at 12A, 10X (10s ON, 30s OFF) followed by 8A, 4x (30s ON, 30s OFF) and ran on a 1.5% agarose gel to ensure appropriate sheared DNA fragments. Sheared chromatin samples were pre-cleared in pre-blocked Streptavidin beads (Dynabeads M-280 streptavidin beads, Invitrogen) o/n at 4ºC on a rotator. 1/20 of biotinChIP was collected as an input fraction and stored at -80ºC. Beads were washed with SDS Wash Buffer (2% SDS, 10 mM Tris-HCl (pH 7.5), 1 mM EDTA) at RT, followed by 4x RIPA washes (50 mM Hepes-KOH (pH 8.0), 500 mM LiCl, 1mM EDTA, 1% NP40, 0.7% Na-Deoxycholate, 1x PI) and 1x Na-Cl TE wash (1x TE, 50mM NaCl) at 4°C. Samples eluted from beads with SDS ChIP Elution buffer (50 mM Tris-HCl (pH 7.5), 10 mM EDTA, 1% SDS) and cross-linked reversed o/n at 65ºC in the thermomixer at 1000 rpm. Chromatin samples were then separated from streptavidin beads. Cellular RNA was digested with RNaseA (0.2 μg/mL) at 37ºC for 1 hour and cellular proteins removed with Proteinase K (0.4 mg/mL) at 55ºC for 2 hours. Samples and input DNA were then extracted by phenol-chloroform. Libraries were prepared using MicroPlex Library Preparation v2 kit (Diagnode) with the number of cycles determined from the amount of starting material. For Sox10 ChIP, 10 cycles were used while for Tfap2B, 14 cycles were used and final libraries quantified and sequenced using NextSeq® 500/550 High Output Kit v2 (75 cycles) on the NextSeq 500 sequencing platform.
CRISPR-Cas9 editing in ovo
The cloning of target guideRNAs into the pcU6_3 sgRNA mini vector (Addgene #92359) and the use of pCAG Cas9-2A-Citrine construct (Addgene #92358) were previously described32. To rule out potential off-target effects from non-specific guide targeting, we designed three sgRNAs for the Sox3 locus using CHOPCHOPv2 platform50, maximising efficiency and specificity scores with zero predicted off-target effects. The guide RNAs were tested by electroporating the cloned pcU6_3 sgRNA plasmid containing individual guides with Cas9 plasmid ex ovo into the epiblast of the HH4 stage embryos and incubating them until HH10 as previously described32, 48. Cas9-only assays were used as a control. Following the incubation, individual embryos were dissected and genomic DNA extracted using PureLink™ Genome DNA Mini Kit (Cat#K182001) according to manufacturer’s protocol. High Resolution Melt Analysis (HRMA) was used as a selection criterion for efficient/functional sgRNAs (Extended Data Fig. 6c). Primers were designed to generate a 164 bp amplicon spanning the sgRNA cut site. HRMA PCR was performed using Hotshot Diamond PCR Mastermix (Client Lifescience, HS002-TS) together with LC Green Plus dye (BioFire Diagnostics, BCHM-ASY-0005) and reactions performed on a C1000 Touch Bio-Rad thermal cycler. The Bio-Rad Precision Melt Analysis™ software was used to visualise and analyse the data. A shift in temperature-normalise melt curve was used as evidence of heteroduplexes in the edited amplicon compared with the controls. The previously published Msx1 guide generated in our lab was used32. For Sox10 and Tfap2B, two sgRNA were designed per gene locus flanking exon 1 and 2 and exon 3 and 4, respectively.
For functional validation experiments, the constructs were electroporated unilaterally in ovo into neural tube of HH8/9 chick embryos at a concentration of 1 μg/μL for both the sgRNA and Cas9-2A-Citrine plasmids. The embryo side that did not receive gene editing components acted as an internal control. After the electroporation, the embryos were incubated for ~36 hours, allowing them to develop until HH18, when embryonic regions at the axial level adjacent to the somites 1-7 were dissected, the neural tube carefully removed and embryonic material dissociated into a single-cell suspension prior to FAC-sorting of Citrine positive (mutant of control cells) for RNA extraction. RNA-seq libraries were prepared as described above. IGV visualisation of mapped transcripts around the excision site provides further validation of the targeted genome engineering events.
Confocal microscopy
For live imaging, embryos were dissected from the vitelline membrane, mounted in PBS and imaged using Zeiss 780 Upright confocal microscope with a 10X, 25X (oil) or 63X (oil) objective. Z-stacks and tiling were used to capture the area of interest. For HCR imaging, since the left side of the embryo served as an uninjected control, we imaged both sides of the embryo using the exact same settings to allow for an accurate comparison.
Statistical analysis and Bioinformatics data processing
ATAC-seq pre-processing
Sequencing files from each sequencing lane were de-multiplexed and resulting files merged. Nextera adaptors sequences were trimmed using TrimGalore (v0.4.1) (settings: --nextera --paired --three_prime_clip_R1 1 --three_prime_clip_R2) prior to being mapped to the chicken genome galGal5 assembly using bowtie (v1.0.0) (settings: -S –X 2000)51. Only aligned pairs were retained based on BAM flags and mitochondrial reads were removed from the BAM file using Samtools (v1.3)52 and unix awk commands. PCR duplicates were then removed using PicardTools (v1.83) and only uniquely mapped reads were retained. Insert sizes were obtained from respective BAM files using samtools view BAM function and unix commands. All samples displayed the expected periodicity of DNA winding around nucleosomes in genome DNA regions. To assess whether each peak read was unique across samples, the complexity curves were generated using Preseq package (v1.0.2)53, and the corresponding plots were generated using GraphPrism. All samples displayed high complexity and large proportion of unique reads. Peaks were then extended by 75 bp in each direction using Bedtools prior to being called using MACS (v2.0.10)54 with the parameter of “–extsize 73 –nomodel” parameters for paired-end reads. For reproducibility analyses, BAM files were first sorted by name instead of the location before being down-sampled to the lowest sequencing read depth using Samtools to remove random read pairs without replacement. A custom Perl script was used to generate smoothened genome browser tracks in BigWig format for data visualisation on the UCSC Genome Browser.
ATAC-seq peak annotation and statistical analysis of differential accessibility
R version 3.5.1 (2018-07-02) was used for all subsequent analyses. The DiffBind package (v1.10.2)55 was used to locate high confidence peaks present in all three replicates. This stringent threshold increases confidence that these peaks are reproducible as each peak must be called in all biological replicates. The consensus peak sets obtained using DiffBind package was subsequently used as reference for downstream analyses. Differential binding accessibility was carried out with the DiffBind package using a negative binomial distribution model implemented in DESeq2 with default parameters and contrast performed includes pairwise comparison with their stage respective negative controls as well as between sample types (i.e. double positive versus E2-only). A highly stringent threshold (FDR <0.01, Fold enrichment >1) was used to define a set of high-confidence DA peaks. Peaks were then annotated using the ChIPseeker R package56 complemented by the BSgenome.Ggallus.UCSC.galGal5 to identify the number of peaks versus the length of each chromosome, TxDb.Ggallus.UCSC.galGal5.refGene to identify transcription start site peaks and finally the annotation database (org.Gg.eg.db) to allocate Ensembl ID to gene symbols. We first identified a peak as belonging to the promoter of a given gene if it fell within 2kb upstream and 1kb downstream of the TSS. Then a 1Mb window upstream and downstream was used to assign peaks to the nearest TSS.
K-Means clustering of ATAC peak datasets
To compare open chromatin signal across all samples, we performed k-means clustering using the seqMINER package (v1.3.4)57 on downsampled ATAC-seq datasets as input. DA peaks called using DiffBind package, and found enriched in signal when compared to their respective negative samples were used as reference genome coordinates. Signal levels were computed genome-wide over DA peaks (±1.5 kb from the centre), using 15-nucleotide binning step and the k-means enrichment linear clustering normalization algorithm, with a target number of clusters set to k=10. Peak mean densities were exported and plotted using GraphPrism. Heatmaps were plotted using Deeptools (v2.4.1) package58 package. Clustered peaks were annotated using ChIPseeker as described above.
RNA-seq analysis
RNA-sequencing outputs were mapped to the chick genome (galGal5) using RNA-STAR (v2.4.2a)59. Duplicates were marked and removed using PicardTools (v1.83) prior to retrieving corresponding count using Subread featureCounts60 (settings: -p –B –t exon –g gene_id). Normalised TPM values were used as a measure of gene expression. A heatmap of RNA expression was produced using the correlation of normalised gene-level TPM values across samples with the ComplexHeatmap R package61. Differential expression analysis was carried out using DESeq2 (v1.14.1)62.
Accessibility and gene expression correlation
Using a custom python script (http://github.com/tsslab/ENS/custom_correlation.py), each differentially accessible annotated peak was matched to the associated differentially expressed gene to obtain the log2fold change correlation between chromatin accessibility and gene expression. This final matrix was used for plotting volcano plots and creating a subset of peaks that was not only differentially accessible (FDR <0.05) but also differentially expressed (padj < 0.05). These peaks were also retained in the analysis to determine the total number of elements per peak to generate Fig. 4a.
Motif and combinatorial analysis
De novo motif search was performed using Homer package27 with findMotifsGenome.pl script using the parameter of “-size given” and motif length between 6 to 18 bp. A peak set containing all merged peaks across all samples including negative controls were used as the background. De novo motifs were annotated using HOMER and TOMTOM63. Top motifs were then used for further combinatorial analysis using annotatePeak.pl script with the “-motif” function to search each peak for a given motif within a window of +/- 200 bp from peak centre as previously described18 to output a file containing motif presence within the peak. Combinations enriched at α=5% (two-tailed Chi-squared test) with Bonferroni correction for multiple hypothesis (m) testing were retained for P-values < α/m. Log10p-adjusted values were then plotted using ComplexHeatmaps61. MEME suite30 was used to predict binding sites within a particular enhancer element +/- 200bp from peak centre. Motifs were then annotated using TOMTOM with the HOCOMOCO v11 (full)64 Human and Mouse database. The gene regulatory network model was drawn using BioTapestry software65.
Motif occurrences and peak differential accessibility correlation
Using a custom python script (http://github.com/tsslab/ENS/custom_correlation.py), peaks from DiffBind outputs were then matched with the motif-annotated peaks from Homer output to generate Fig. 5f. Peaks were ranked and filtered using FDR <0.05 and log2FoldChange > or < 1) and then converted to a matrix of motif presence (1) or absence (0). Assigned peaks were then plotted in GraphPrism for visualisation.
Biotin ChIP-seq analysis
Sequencing reads were processed similarly to ATAC-seq data by trimming raw reads, mapping to galGal5 genome, duplicates removed prior to peak calling with MACS2. Replicate BAM files were merged using Samtools (v1.3)52 and downsampled to the input prior to using Deeptools (v2.4.1) package58 for heatmap and plot profile generation. Differential binding analysis was carrired out with DiffBind R package (v1.10.2)55.
10X Chromium single cell RNA-seq analysis
Single-cell RNAseq reads were demultiplexed using Cellranger (v2.2.0)66 and mapped to the galGal5 transcriptome generated using the Cellranger “mkref” function. Citrine and mCherry transcripts were added to the galGal5 FASTA file and GTF to allow correct assignment of cells to the appropriate organism. We achieved 95% mapping confidence and Q30 Bases in UMI was 96.20%. There were 1309 median genes per cell, 4064 median UMI counts per cell, 12,601 total genes detected and 233,801 Mean reads per cell. Downstream analysis was carried out using Seurat package (v3.0.0)67 in R. Raw UMI count matrices were filtered to remove barcodes with fewer than 200 genes, more than 3000 genes expressed and high percentage of UMIs from mitochondrial features (greater than 10%) that gave a total of 570 cells used for clustering (Extended Data Fig. 3f). Expression values for total UMI counts per cell were then normalized and Jack-Straw permutation tests carried out determine significant principal components in the data before performing linear dimensional reduction (resolution = 0.5). Cell clusters were visualised using t-SNE and UMAP plots.
Cell-differentiation trajectories were reconstructed using R package Monocle (v2.10.1)68 from Seurat objects previously normalised and clustered. Dimensionality reduction was performed with the DDRTree algorithm using highly varied genes as inputs. Cell trajectories were then reconstructed using orderCells function.
Deconvolution of bulk RNA-seq datasets
Using our scRNA-seq data, we selected top marker genes for the three main clusters as listed in Extended Data Fig 3e using a p-adjusted cut-off of <0.05 and log2 FoldChange of >1 as identified using Seurat package. We calculated the reference matrix using BSEQ-sc69 package that measured the average expression levels of these marker genes in each cell type. This reference matrix was then used to deconvolve the normalized bulk-RNA seq data counts and estimate cell type proportions using CIBERSORT70
Statistics and Reproducibility
Bioinformatics statistics were described in individual sections above using the package default statistical tests parameters with a 95% confidence levels for all experiments unless stated otherwise. At least three independent replicates were performed for ATAC-seq and RNA-seq knockout experiments and at least two independent replicates for RNA-seq and Biotin ChIP-seq experiments. Approximately 60-90 HH10 live embryos per replicate were used per experiment for earlier stages and 30-50 live HH18 embryos per replicate and 10-15 live HH25 dissected guts to obtain at least 2500 cells for analysis. No statistical method was used to predetermine sample size. For knockout experiments, no randomisation was carried out and the investigators were not blinded to the outcome. Individual embryos were randomly selected for HCR analysis and confocal microscopy.
Extended Data
Extended Data Fig. 1. Summary of ENS development and current genome wide transcriptomic datasets.
Comparative developmental time points during key ENS developmental events summarised from current literature. All the current genome-wide transcriptomic datasets where the majority of studies were carried out in the mouse using either Wnt1:Cre or Sox10:Cre/Ert2 lines and cells analysed later in ENS development are listed. Red box indicates gap of genome-wide profiles consisting of ATAC-seq, Biotin-ChIP-seq and scRNA-seq unique datasets.
Related to Introduction
Extended Data Fig. 2. Quality control for HH10 NC2 ATAC-seq experiments.
(a) ATAC-seq fragment lengths.
(b) ATAC-seq complexity curves.
(c) Hierarchical clustering of ATAC-seq peaks.
(d) Principal Component Analysis based on ATAC-seq genome-wide normalise reads. Each point represents one replicate experiment. Three NC2+ and three NC2- experiments are shown.
(e) ATAC-seq TSS peak densities.
(f) ATAC-seq peak centre densities.
(g) Box and whiskers plot of ATAC-seq total normalised counts per peak (n=7877 peaks) showing min to max counts.
(h) Boxplot of Pearson correlation scores between samples with line at median obtained from Deeptools analysis of ATAC samples, n=3 biological triplicates per cell type per stage including negative fluorescent cells.
(i) GO-terms of the top 200 genes obtained from DA analysis. Overrepresentation analysis was performed using Panther database and p-values were calculated using binominal test with Bonferroni correction for multiple hypothesis.
(j) Optimisation of co-electroporation assay. E2:Citrine and E2:Cerulean constructs were co-electroporated at HH4 and embryos were incubated till HH12. Embryos were dissociated and subjected to FAC-sorting. Using appropriate gating strategy, only one cell was recovered in single fluorophore channel. Co-electroporation tests indicated that vast majority of cells receive both plasmids. 60 embryos used fin FAC-sort for each independent experiment.
(k-l) Representative FACS plot for negative gating (k) and Citrine and Cerulean positive gating strategy (l). For Citrine only sorts (Figure 1), six independent experiments were carried out.
(m) Immunofluorescence for Citrine and mCherry to mark E2- and NC2-driven reporters respectively in a transverse section of a HH18 embryo at the pharynx level showing distinct E2-only activity at pharyngeal arch 2 (pa2, pink arrowhead). 3 embryos. Scale bars = 100 μm
(n) Whole mount imaging of a HH15 embryo electroporated with E2:Citrine and NC2:mCherry showing lateral view of the cranial and vagal region. Of note, there are NC2:mCherry cells within the cranial region. Pink arrowheads point to distinct E2-only activity in pharyngeal arches. 3 embryos. Scale bars = 100 μm
Extended Data Fig. 3. Single cell analysis and mining of published single cell datasets.
(a) Schematic for the cell preparation of the 10X scRNA-seq experiment
(b) QC plots showing RNA features, counts and percentage of mitochondrial reads per cell. Black dotted line indicates cut off for filtering where only cells with >200 and <3000 features (genes) and <10% mitochondrial gene content were selected for analysis. 700 cells obtained in total with the violin plot indicating median and filtered to 570 cells.
(c) UMAP representation of 570 single cells assigned to four distinct clusters (scC1-4)
(d) Violin plots of the expression levels (log TPM) for NeuroD1 and NeuroD4 genes indicate no neural tube contamination of the single cell sample.
(e) Top 50 differential gene markers for each cluster plotted on the –log10(padj) values. Adjusted p-value (padj) was calculated using Wald statistics with a negative binominal model and corrected using Benjamin-Hochberg method for multiple hypothesis testing.
(f) Violin plots depicting selected cluster markers from Wnt1-traced NC single-cell datasets from post-otic trunk level at E9.5 (Publicly available data from SRP135960)15. Violin Y-axis represents expression levels (log TPM) from Seurat analysis. Individual data points in the plot represent individual cells expressing the gene in that cluster. EdnrB is expressed in all clusters similar to Wnt1 while FoxD3 is only found in a subset of clusters.
(g, h) Volcano plot depicting statistically significant DE genes obtained by RNA-seq comparing DP (left) vs E2 (right) populations at HH10 (g) and HH18 (h). Adjusted p-values (padj), calculated using Wald test with Benjamin-Hochberg correction are plotted against FoldChange enrichment on a log scale. Analysis shows differential enrichment of neural genes in DP and neuronal/mesenchymal ones in E2 population.
(i) Heatmap showing the triplicate average gene TPM expression of the selected differentiation markers enriched at HH25 highlighting their expression dynamics across developmental stages and segregation within E2 or DP populations.
(j) Heatmap depicting average gene expression levels per single cell clusters from Wnt1-traced NC at P21 mouse small bowel myenteric plexus25 corroborating our data shown in (i).
Extended Data Fig. 4. Quality control for ATAC-seq and RNA-seq experiments and correlation of the two datasets.
(a) Hierarchical clustering of ATAC-seq datasets.
(b) Hierarchical clustering of RNA-seq datasets.
(c) Stacked bar plots depicting genomic feature distributions of ATAC-seq peaks as annotated by ChIPseeker package. Annotated features identify a large proportion of peaks as distal intergenic elements.
(d) Principal component analysis for ATAC-seq samples. Each point represents one ATAC-seq replicate experiment
(e) Principal component analysis for RNA-seq samples. Each point represents one RNA-seq replicate experiment
(f) ATAC-seq complexity curves.
(g) ATAC-seq fragment length.
(h) ATAC-seq peak density profiles.
(i) Number of ATAC-seq peak called using MACS and consensus peaksets obtained from all three replicates.
(j) Cumulative number of DA peaks per gene.
(k) Correlation of DA promoter peaks with DE genes. Simply, promoter peak log2FoldChange scores from DA ATAC-seq Deseq2 analysis and log2FoldChange scores from gene DE RNA-seq Deseq2 analysis were tabulated and gene-matched. The associated Log2FoldChange values (statistically significant with padj<0.05, log2FoldChange>1) were plotted, R-squared coefficient score was generated from the slope and p-value from regression analysis (Wald test). Sig, statistically significant.
Extended Data Fig. 5. Common ATAC-seq peaks across stages and single-cell RNA-seq quality control with selected gene expression in individual cells.
(a) ATAC-seq UCSC genome browser tracks for NeuroD4, Mbp, Sox6 and Barx1 showing accessible genomic elements. NeuroD4 elements show an accessibility bias in the E2 population compared to Mbp that showed a bias to DP. Sox6 and Barx1 displayed opened elements in both populations.
(b) The total number of accessible elements across different categories of differentially expressed genes showing dynamic use of elements across stages but also cell types. Size of the bubble indicates total number of differentially accessible elements.
(c) Hierarchical clustering of Biotin ChIP-seq peak sets based on Pearson correlation scores from duplicate experiments.
(d) Hierarchical clustering of Biotin ChIP-seq peaks within DP peaks based on Pearson correlation scores from duplicate experiments
(e) Hierarchical clustering of Biotin ChIP-seq peaks within E2 peaks based on Pearson correlation scores from duplicate experiments.
Extended Data Fig. 6. CRISPR knockout validation and summary analyses.
(a) Principal Component Analysis of all RNA-seq samples. Each dot represents one independent experiment. Duplicate KO experiments were performed per gene. One Sox3 KO experiment (arrow) was removed as a clear outlier.
(b) sgRNA oligo sequence for targeting individual genes.
(c) Temperature-Shifted melt curves representing profiles from Cas9-control individual embryos in red (8 embryos) and Sox3 KO embryos in green (8 embryos) all showing split profiles, thus suggesting high penetrance of efficient genome editing events Difference in Relative Fluorescence Units (RFU) between experimental and control samples is shown on y-axis.
(d) IGV snapshot of BAM-generated mapping around the region of gRNA target sites with the top panel showing one representative replicate of Cas9-only control and the bottom panel showing one representative replicate of the gene knockout. Snapshots obtained at the base of the plots for similar comparison.
(e) Summary of differential expression analysis obtained using DESeq2 analysis of KO and control samples for selected genes.
Related to Figure 7
Extended Data Fig. 7. Deconstructing EdnrB GRN.
(a) TF binding motif enrichment within EdnrB DA elements.
(b) Results of RNA-seq differential expression analysis comparing KO versus control embryos depicting genes involved in EdnrB gene regulatory circuitry.
Related to Figure 8
Supplementary Material
All de novo motifs identified by Homer with a p-value of less than 1e-60 were included. Two motifs per gene were added where a larger motif sequence was identified. All position weighted matrices were then annotated using TOMTOM (HOCOMOCO Human Full p <0.0005, q<0.5) and HOMER (score >0.8) to obtain a consensus name. Where there is no consensus annotation reached, a general family of TF name was allocated to the motif. p-adjusted values were obtained to adjust for multiple comparisons.
Related to Figure 4 and 5
Acknowledgements
We thank all the members of the TSS lab for helpful discussions throughout this project, particularly RM Williams and I Candido-Ferreira. We thank Marianne Bronner and Alan Burns for insightful comments on the manuscript. Next-generation sequencing was performed at the MRC WIMM Sequencing Facility, FACS at the WIMM Flow Cytometry Facility and 10X Single-Cell sequencing at the WIMM Single Cell Core Facility. This work was supported by the MRC, The Lister Institute, John Fell Fund and Leverhulme Trust grants to T.S.S. and the Newlife Charity for Disabled Children small research grant to I.L. I.L. was funded by a NIHR Academic Clinical Fellowship in partnership with Oxford University Clinical Academic Graduate School (OUCAGS).
Funding statement
This publication presents independent research partially funded by the National Institute for Health Research (NIHR). The views expressed are those of the author(s) and not necessarily those of the NHS, the NIHR or the Department of Health and Social Care.
List of Abbreviations
- GRN
Gene Regulatory Network
- NC
Neural Crest
- VNC
Vagal Neural Crest
- ENS
Enteric Nervous System
- HH
Hamburger Hamilton
- TF
Transcription Factor
- DA
Differentially Accessible
- DB
Differential Binding
- DE
Differentially Expressed
Footnotes
Code availability
The custom python script used for gene expression correlation is available at https://github.com/tsslab/ENS/. All other code used in the study can be obtained from the corresponding author on reasonable request.
Data availability
ChIP-seq, ATAC-seq, scRNA-seq and bulk RNA–seq data that support the findings of this study have been deposited in the Gene Expression Omnibus (GEO) under accession code GSE125711. Previously published sequencing data that were re-analysed here are available under accession codes SRP135960 and GSE129114. All other data supporting the findings of this study are available from the corresponding author on reasonable request.
Author Contributions
Conceptualisation, I.L., T.S.S.; Investigation, Validation and Formal Analysis, I.L.; Writing I.L., T.S.S.; Visualisation I.L., T.S.S.; Supervision, T.S.S.; Funding Acquisition, T.S.S., I.L.
Competing interests
We have no financial or non-financial competing interest.
References
- 1.Gershon MD. Development of the Enteric Nervous System: A Genetic Guide to the Perplexed. Gastroenterology. 2018;154:478–480. doi: 10.1053/j.gastro.2018.01.012. [DOI] [PMC free article] [PubMed] [Google Scholar]
- 2.Amiel J, et al. Hirschsprung disease, associated syndromes and genetics: a review. J Med Genet. 2008;45:1–14. doi: 10.1136/jmg.2007.053959. [DOI] [PubMed] [Google Scholar]
- 3.Chatterjee S, et al. Enhancer Variants Synergistically Drive Dysfunction of a Gene Regulatory Network In Hirschsprung Disease. Cell. 2016;167:355–368 e310. doi: 10.1016/j.cell.2016.09.005. [DOI] [PMC free article] [PubMed] [Google Scholar]
- 4.Tilghman JM, et al. Molecular Genetic Anatomy and Risk Profile of Hirschsprung's Disease. N Engl J Med. 2019;380:1421–1432. doi: 10.1056/NEJMoa1706594. [DOI] [PMC free article] [PubMed] [Google Scholar]
- 5.Le Douarin NM, Teillet MA. The migration of neural crest cells to the wall of the digestive tract in avian embryo. J Embryol Exp Morphol. 1973;30:31–48. [PubMed] [Google Scholar]
- 6.Yntema CL, Hammond WS. The origin of intrinsic ganglia of trunk viscera from vagal neural crest in the chick embryo. J Comp Neurol. 1954;101:515–541. doi: 10.1002/cne.901010212. [DOI] [PubMed] [Google Scholar]
- 7.Burns AJ, Douarin NM. The sacral neural crest contributes neurons and glia to the post-umbilical gut: spatiotemporal analysis of the development of the enteric nervous system. Development. 1998;125:4335–4347. doi: 10.1242/dev.125.21.4335. [DOI] [PubMed] [Google Scholar]
- 8.Young HM, Bergner AJ, Muller T. Acquisition of neuronal and glial markers by neural crest-derived cells in the mouse intestine. J Comp Neurol. 2003;456:1–11. doi: 10.1002/cne.10448. [DOI] [PubMed] [Google Scholar]
- 9.Vohra BP, et al. Differential gene expression and functional analysis implicate novel mechanisms in enteric nervous system precursor migration and neuritogenesis. Dev Biol. 2006;298:259–271. doi: 10.1016/j.ydbio.2006.06.033. [DOI] [PMC free article] [PubMed] [Google Scholar]
- 10.Schriemer D, et al. Regulators of gene expression in Enteric Neural Crest Cells are putative Hirschsprung disease genes. Dev Biol. 2016;416:255–265. doi: 10.1016/j.ydbio.2016.06.004. [DOI] [PubMed] [Google Scholar]
- 11.Memic F, et al. Transcription and Signaling Regulators in Developing Neuronal Subtypes of Mouse and Human Enteric Nervous System. Gastroenterology. 2018;154:624–636. doi: 10.1053/j.gastro.2017.10.005. [DOI] [PMC free article] [PubMed] [Google Scholar]
- 12.Heanue TA, Pachnis V. Expression profiling the developing mammalian enteric nervous system identifies marker and candidate Hirschsprung disease genes. Proc Natl Acad Sci U S A. 2006;103:6919–6924. doi: 10.1073/pnas.0602152103. [DOI] [PMC free article] [PubMed] [Google Scholar]
- 13.Roy-Carson S, et al. Defining the transcriptomic landscape of the developing enteric nervous system and its cellular environment. BMC Genomics. 2017;18:290. doi: 10.1186/s12864-017-3653-2. [DOI] [PMC free article] [PubMed] [Google Scholar]
- 14.Lasrado R, et al. Lineage-dependent spatial and functional organization of the mammalian enteric nervous system. Science. 2017;356:722–726. doi: 10.1126/science.aam7511. [DOI] [PubMed] [Google Scholar]
- 15.Soldatov R, et al. Spatiotemporal structure of cell fate decisions in murine neural crest. Science. 2019;364 doi: 10.1126/science.aas9536. [DOI] [PubMed] [Google Scholar]
- 16.Betancur P, Bronner-Fraser M, Sauka-Spengler T. Assembling neural crest regulatory circuits into a gene regulatory network. Annu Rev Cell Dev Biol. 2010;26:581–603. doi: 10.1146/annurev.cellbio.042308.113245. [DOI] [PMC free article] [PubMed] [Google Scholar]
- 17.Sauka-Spengler T, Bronner-Fraser M. A gene regulatory network orchestrates neural crest formation. Nat Rev Mol Cell Biol. 2008;9:557–568. doi: 10.1038/nrm2428. [DOI] [PubMed] [Google Scholar]
- 18.Williams RM, et al. Reconstruction of the Global Neural Crest Gene Regulatory Network In Vivo. Dev Cell. 2019;51:255–276. doi: 10.1016/j.devcel.2019.10.003. [DOI] [PMC free article] [PubMed] [Google Scholar]
- 19.Simoes-Costa M, Bronner ME. Reprogramming of avian neural crest axial identity and cell fate. Science. 2016;352:1570–1573. doi: 10.1126/science.aaf2729. [DOI] [PMC free article] [PubMed] [Google Scholar]
- 20.Simoes-Costa MS, McKeown SJ, Tan-Cabugao J, Sauka-Spengler T, Bronner ME. Dynamic and differential regulation of stem cell factor FoxD3 in the neural crest is Encrypted in the genome. PLoS Genet. 2012;8:e1003142. doi: 10.1371/journal.pgen.1003142. [DOI] [PMC free article] [PubMed] [Google Scholar]
- 21.Tani-Matsuhana S, Vieceli FM, Gandhi S, Inoue K, Bronner ME. Transcriptome profiling of the cardiac neural crest reveals a critical role for MafB. Dev Biol. 2018;S0012-1606(18):30236–7. doi: 10.1016/j.ydbio.2018.09.015. [DOI] [PMC free article] [PubMed] [Google Scholar]
- 22.Bondurand N, Natarajan D, Barlow A, Thapar N, Pachnis V. Maintenance of mammalian enteric nervous system progenitors by SOX10 and endothelin 3 signalling. Development. 2006;133:2075–2086. doi: 10.1242/dev.02375. [DOI] [PubMed] [Google Scholar]
- 23.Choi HMT, et al. Third-generation in situ hybridization chain reaction: multiplexed, quantitative, sensitive, versatile, robust. Development. 2018;145 doi: 10.1242/dev.165753. [DOI] [PMC free article] [PubMed] [Google Scholar]
- 24.Kim BM, Buchner G, Miletich I, Sharpe PT, Shivdasani RA. The stomach mesenchymal transcription factor Barx1 specifies gastric epithelial identity through inhibition of transient Wnt signaling. Dev Cell. 2005;8:611–622. doi: 10.1016/j.devcel.2005.01.015. [DOI] [PubMed] [Google Scholar]
- 25.Zeisel A, et al. Molecular Architecture of the Mouse Nervous System. Cell. 2018;174:999–1014 e1022. doi: 10.1016/j.cell.2018.06.021. [DOI] [PMC free article] [PubMed] [Google Scholar]
- 26.Lukoseviciute M, et al. From Pioneer to Repressor: Bimodal foxd3 Activity Dynamically Remodels Neural Crest Regulatory Landscape In Vivo. Dev Cell. 2018;47:608–628 e606. doi: 10.1016/j.devcel.2018.11.009. [DOI] [PMC free article] [PubMed] [Google Scholar]
- 27.Heinz S, et al. Simple combinations of lineage-determining transcription factors prime cis-regulatory elements required for macrophage and B cell identities. Mol Cell. 2010;38:576–589. doi: 10.1016/j.molcel.2010.05.004. [DOI] [PMC free article] [PubMed] [Google Scholar]
- 28.Zhan X, Liu DJ. SEQMINER: An R-Package to Facilitate the Functional Interpretation of Sequence-Based Associations. Genet Epidemiol. 2015;39:619–623. doi: 10.1002/gepi.21918. [DOI] [PMC free article] [PubMed] [Google Scholar]
- 29.Stefflova K, et al. Cooperativity and rapid evolution of cobound transcription factors in closely related mammals. Cell. 2013;154:530–540. doi: 10.1016/j.cell.2013.07.007. [DOI] [PMC free article] [PubMed] [Google Scholar]
- 30.Bailey TL, et al. MEME SUITE: tools for motif discovery and searching. Nucleic Acids Res. 2009;37:W202–208. doi: 10.1093/nar/gkp335. [DOI] [PMC free article] [PubMed] [Google Scholar]
- 31.Gui H, et al. Whole exome sequencing coupled with unbiased functional analysis reveals new Hirschsprung disease genes. Genome Biol. 2017;18:48. doi: 10.1186/s13059-017-1174-6. [DOI] [PMC free article] [PubMed] [Google Scholar]
- 32.Williams RM, et al. Genome and epigenome engineering CRISPR toolkit for in vivo modulation of cis-regulatory interactions and gene expression in the chicken embryo. Development. 2018;145 doi: 10.1242/dev.160333. dev.160333. [DOI] [PMC free article] [PubMed] [Google Scholar]
- 33.Lane PW, Liu HM. Association of megacolon with a new dominant spotting gene (Dom) in the mouse. J Hered. 1984;75:435–439. doi: 10.1093/oxfordjournals.jhered.a109980. [DOI] [PubMed] [Google Scholar]
- 34.Zhao F, Bosserhoff AK, Buettner R, Moser M. A heart-hand syndrome gene: Tfap2b plays a critical role in the development and remodeling of mouse ductus arteriosus and limb patterning. PLoS One. 2011;6:e22908. doi: 10.1371/journal.pone.0022908. [DOI] [PMC free article] [PubMed] [Google Scholar]
- 35.Bylund M, Andersson E, Novitch BG, Muhr J. Vertebrate neurogenesis is counteracted by Sox1-3 activity. Nat Neurosci. 2003;6:1162–1168. doi: 10.1038/nn1131. [DOI] [PubMed] [Google Scholar]
- 36.Bansod S, Kageyama R, Ohtsuka T. Hes5 regulates the transition timing of neurogenesis and gliogenesis in mammalian neocortical development. Development. 2017;144:3156–3167. doi: 10.1242/dev.147256. [DOI] [PubMed] [Google Scholar]
- 37.Le Lievre CS, Le Douarin NM. Mesenchymal derivatives of the neural crest: analysis of chimaeric quail and chick embryos. J Embryol Exp Morphol. 1975;34:125–154. [PubMed] [Google Scholar]
- 38.Maeda K, et al. Postotic and preotic cranial neural crest cells differently contribute to thyroid development. Dev Biol. 2016;409:72–83. doi: 10.1016/j.ydbio.2015.10.026. [DOI] [PubMed] [Google Scholar]
- 39.Kirby ML, Stewart DE. Neural crest origin of cardiac ganglion cells in the chick embryo: identification and extirpation. Dev Biol. 1983;97:433–443. doi: 10.1016/0012-1606(83)90100-8. [DOI] [PubMed] [Google Scholar]
- 40.Burns AJ, Delalande JM. Neural crest cell origin for intrinsic ganglia of the developing chicken lung. Dev Biol. 2005;277:63–79. doi: 10.1016/j.ydbio.2004.09.006. [DOI] [PubMed] [Google Scholar]
- 41.Espinosa-Medina I, et al. Dual origin of enteric neurons in vagal Schwann cell precursors and the sympathetic neural crest. Proc Natl Acad Sci U S A. 2017;114:11980–11985. doi: 10.1073/pnas.1710308114. [DOI] [PMC free article] [PubMed] [Google Scholar]
- 42.Fontaine J, Le Lievre C, Le Douarin NM. What is the developmental fate of the neural crest cells which migrate into the pancreas in the avian embryo? Gen Comp Endocrinol. 1977;33:394–404. doi: 10.1016/0016-6480(77)90055-7. [DOI] [PubMed] [Google Scholar]
- 43.Le Douarin NM, Teillet MA. Experimental analysis of the migration and differentiation of neuroblasts of the autonomic nervous system and of neurectodermal mesenchymal derivatives, using a biological cell marking technique. Dev Biol. 1974;41:162–184. doi: 10.1016/0012-1606(74)90291-7. [DOI] [PubMed] [Google Scholar]
- 44.Faure S, McKey J, Sagnol S, de Santa Barbara P. Enteric neural crest cells regulate vertebrate stomach patterning and differentiation. Development. 2015;142:331–342. doi: 10.1242/dev.118422. [DOI] [PubMed] [Google Scholar]
- 45.Bockman DE, Kirby ML. Dependence of thymus development on derivatives of the neural crest. Science. 1984;223:498–500. doi: 10.1126/science.6606851. [DOI] [PubMed] [Google Scholar]
- 46.Hakami RM, et al. Genetic evidence does not support direct regulation of EDNRB by SOX10 in migratory neural crest and the melanocyte lineage. Mech Dev. 2006;123:124–134. doi: 10.1016/j.mod.2005.11.004. [DOI] [PMC free article] [PubMed] [Google Scholar]
- 47.Hamburger V, Hamilton HL. A series of normal stages in the development of the chick embryo. J Morphol. 1951;88:49–92. [PubMed] [Google Scholar]
- 48.Sauka-Spengler T, Barembaum M. Gain- and loss-of-function approaches in the chick embryo. Methods Cell Biol. 2008;87:237–256. doi: 10.1016/S0091-679X(08)00212-4. [DOI] [PubMed] [Google Scholar]
- 49.Buenrostro JD, Giresi PG, Zaba LC, Chang HY, Greenleaf WJ. Transposition of native chromatin for fast and sensitive epigenomic profiling of open chromatin, DNA-binding proteins and nucleosome position. Nat Methods. 2013;10:1213–1218. doi: 10.1038/nmeth.2688. [DOI] [PMC free article] [PubMed] [Google Scholar]
- 50.Labun K, Montague TG, Gagnon JA, Thyme SB, Valen E. CHOPCHOP v2: a web tool for the next generation of CRISPR genome engineering. Nucleic Acids Res. 2016;44:W272–276. doi: 10.1093/nar/gkw398. [DOI] [PMC free article] [PubMed] [Google Scholar]
- 51.Langmead B, Trapnell C, Pop M, Salzberg SL. Ultrafast and memory-efficient alignment of short DNA sequences to the human genome. Genome Biol. 2009;10:R25. doi: 10.1186/gb-2009-10-3-r25. [DOI] [PMC free article] [PubMed] [Google Scholar]
- 52.Li H, et al. The Sequence Alignment/Map format and SAMtools. Bioinformatics. 2009;25:2078–2079. doi: 10.1093/bioinformatics/btp352. [DOI] [PMC free article] [PubMed] [Google Scholar]
- 53.Daley T, Smith AD. Predicting the molecular complexity of sequencing libraries. Nat Methods. 2013;10:325–327. doi: 10.1038/nmeth.2375. [DOI] [PMC free article] [PubMed] [Google Scholar]
- 54.Zhang Y, et al. Model-based analysis of ChIP-Seq (MACS) Genome Biol. 2008;9:R137. doi: 10.1186/gb-2008-9-9-r137. [DOI] [PMC free article] [PubMed] [Google Scholar]
- 55.Ross-Innes CS, et al. Differential oestrogen receptor binding is associated with clinical outcome in breast cancer. Nature. 2012;481:389–393. doi: 10.1038/nature10730. [DOI] [PMC free article] [PubMed] [Google Scholar]
- 56.Yu G, Wang LG, He QY. ChIPseeker: an R/Bioconductor package for ChIP peak annotation, comparison and visualization. Bioinformatics. 2015;31:2382–2383. doi: 10.1093/bioinformatics/btv145. [DOI] [PubMed] [Google Scholar]
- 57.Ye T, et al. seqMINER: an integrated ChIP-seq data interpretation platform. Nucleic Acids Res. 2011;39:e35. doi: 10.1093/nar/gkq1287. [DOI] [PMC free article] [PubMed] [Google Scholar]
- 58.Ramirez F, Dundar F, Diehl S, Gruning BA, Manke T. deepTools: a flexible platform for exploring deep-sequencing data. Nucleic Acids Res. 2014;42:W187–191. doi: 10.1093/nar/gku365. [DOI] [PMC free article] [PubMed] [Google Scholar]
- 59.Dobin A, et al. STAR: ultrafast universal RNA-seq aligner. Bioinformatics. 2013;29:15–21. doi: 10.1093/bioinformatics/bts635. [DOI] [PMC free article] [PubMed] [Google Scholar]
- 60.Liao Y, Smyth GK, Shi W. featureCounts: an efficient general purpose program for assigning sequence reads to genomic features. Bioinformatics. 2014;30:923–930. doi: 10.1093/bioinformatics/btt656. [DOI] [PubMed] [Google Scholar]
- 61.Gu Z, Eils R, Schlesner M. Complex heatmaps reveal patterns and correlations in multidimensional genomic data. Bioinformatics. 2016;32:2847–2849. doi: 10.1093/bioinformatics/btw313. [DOI] [PubMed] [Google Scholar]
- 62.Love MI, Huber W, Anders S. Moderated estimation of fold change and dispersion for RNA-seq data with DESeq2. Genome Biol. 2014;15:550. doi: 10.1186/s13059-014-0550-8. [DOI] [PMC free article] [PubMed] [Google Scholar]
- 63.Gupta S, Stamatoyannopoulos JA, Bailey TL, Noble WS. Quantifying similarity between motifs. Genome Biol. 2007;8:R24. doi: 10.1186/gb-2007-8-2-r24. [DOI] [PMC free article] [PubMed] [Google Scholar]
- 64.Kulakovskiy IV, et al. HOCOMOCO: towards a complete collection of transcription factor binding models for human and mouse via large-scale ChIP-Seq analysis. Nucleic Acids Res. 2018;46:D252–D259. doi: 10.1093/nar/gkx1106. [DOI] [PMC free article] [PubMed] [Google Scholar]
- 65.Longabaugh WJ, Davidson EH, Bolouri H. Computational representation of developmental genetic regulatory networks. Dev Biol. 2005;283:1–16. doi: 10.1016/j.ydbio.2005.04.023. [DOI] [PubMed] [Google Scholar]
- 66.Zheng GX, et al. Massively parallel digital transcriptional profiling of single cells. Nat Commun. 2017;8 doi: 10.1038/ncomms14049. 14049. [DOI] [PMC free article] [PubMed] [Google Scholar]
- 67.Butler A, Hoffman P, Smibert P, Papalexi E, Satija R. Integrating single-cell transcriptomic data across different conditions, technologies, and species. Nat Biotechnol. 2018;36:411–420. doi: 10.1038/nbt.4096. [DOI] [PMC free article] [PubMed] [Google Scholar]
- 68.Trapnell C, et al. The dynamics and regulators of cell fate decisions are revealed by pseudotemporal ordering of single cells. Nat Biotechnol. 2014;32:381–386. doi: 10.1038/nbt.2859. [DOI] [PMC free article] [PubMed] [Google Scholar]
- 69.Baron M, et al. A Single-Cell Transcriptomic Map of the Human and Mouse Pancreas Reveals Inter- and Intra-cell Population Structure. Cell Syst. 2016;3:346–360 e344. doi: 10.1016/j.cels.2016.08.011. [DOI] [PMC free article] [PubMed] [Google Scholar]
- 70.Newman AM, et al. Robust enumeration of cell subsets from tissue expression profiles. Nat Methods. 2015;12:453–457. doi: 10.1038/nmeth.3337. [DOI] [PMC free article] [PubMed] [Google Scholar]
Associated Data
This section collects any data citations, data availability statements, or supplementary materials included in this article.
Supplementary Materials
All de novo motifs identified by Homer with a p-value of less than 1e-60 were included. Two motifs per gene were added where a larger motif sequence was identified. All position weighted matrices were then annotated using TOMTOM (HOCOMOCO Human Full p <0.0005, q<0.5) and HOMER (score >0.8) to obtain a consensus name. Where there is no consensus annotation reached, a general family of TF name was allocated to the motif. p-adjusted values were obtained to adjust for multiple comparisons.
Related to Figure 4 and 5


