

Abstract
Background and Aims
Elevated serum calcium and phosphorus have been associated with increased risk of cardiovascular disorders. We evaluated whether abnormal calcium and high serum phosphorus are associated cross-sectionally with echocardiographic measures of left ventricular (LV) structure and function, as doing so may provide insight into the etiology of cardiac disorders.
Methods and Results
Included in the analysis were 5,213 Atherosclerosis Risk in Communities Study (ARIC) participants who in 2011–2013 had echocardiography and serum calcium and phosphorus measurements. We evaluated the association of serum calcium (corrected for albumin) and phosphorus quintiles with the measures of LV structure and function, after adjusting for other cardiovascular risk factors. Participants were on average 75.3 years old; 59.1% were female and 19.8% were African American. Mean (± SD) concentrations of calcium and phosphorus were 9.33 ± 0.38 and 3.46 ± 0.45 mg/dL, respectively. Higher calcium was associated with lower LV end-diastolic diameter (LVEDD) but greater prevalence of concentric remodeling (p-trend: 0.005 and 0.004 respectively). We observed association between high phosphorus and high septal E/e’ (p-trend: 0.02). Likewise, higher serum phosphorus was associated with higher left atrial volume index (p-trend: 0.001) and LV hypertrophy prevalence (p-trend: 0.04).
Conclusions
In conclusion, higher calcium was associated with more concentric remodeling but lower LVEDD, suggesting complex associations between calcium and cardiac function. Serum phosphorus was related to worse indices of LV diastolic function and LV hypertrophy, but not to LV systolic function. However, the magnitudes of association were modest, so clinical implications of these findings may be limited.
Keywords: Serum calcium, serum phosphorus, echocardiography, left ventricular function, left ventricular structure
INTRODUCTION
Calcium and phosphorus are electrolytes essential for maintaining normal human physiology and biochemistry. Calcium is crucial for excitation, contraction, and relaxation of the heart. Disturbances in calcium release and removal can result in decreased muscle contraction leading to systolic dysfunction, and impaired relaxation leading to diastolic dysfunction1. Similarly, phosphorus is important in maintaining function of the heart because of its role in energy production, regulation of calcium, and acid-base balance2. Elevated serum calcium levels have been associated with greater risk of cardiovascular risk factors (e.g. diabetes3, hypertension4), diseases5,6 and mortality7, though results are not entirely consistent. Likewise, high serum phosphorus has also been independently associated with greater risk of cardiovascular disorders8–11. Additionally, among individuals with cardiovascular12 and nephrotic disorders13, elevated phosphorous is associated with poorer prognosis. Within ARIC, elevated concentrations of both calcium and phosphorous have been associated with greater heart failure risk10.
Echocardiographic markers of left ventricular (LV) structure and function are typically used to evaluate heart failure14, and abnormal indices have been associated with greater risk of incident atrial fibrillation15, coronary artery disease16, and stroke17. It is possible that evaluating serum calcium and phosphorus in relation to echocardiographic measures of heart structure and function may provide etiologic clues regarding how these serum biomarkers influence risk of heart failure and other cardiovascular conditions.
Previous research has examined the association of these two electrolytes with measures of LV structure and function among patients with preexisting conditions. High phosphorus and increased calcium-phosphorus product have been associated with impaired LV systolic function in renal patients18 and impaired diastolic function in uremic patients19. Likewise, acute hypercalcemia from calcium infusion was associated with LV diastolic dysfunction in patients with renal failure and secondary hyperparathyroidism20. In contrast, other studies found that low serum calcium was associated with LV diastolic dysfunction in renal patients21 and coronary artery disease patients22 However, it is unclear whether these results hold true in general population.
Therefore, utilizing rich echocardiographic data collected as part of the Atherosclerosis Risk in Communities (ARIC) study clinic visit 5, we evaluated the cross-sectional associations of serum calcium and phosphorus with measures of LV structure and function. We hypothesized that high serum calcium and high serum phosphorus concentration would be associated with worse indices of LV systolic and diastolic function, higher left ventricular hypertrophy, and concentric remodeling.
METHODS
Study Population
The prospective and multicenter ARIC study started in 1987–89 when a total of 15,792 participants aged 45–64 years were recruited from four U.S. field centers (suburban Minneapolis, Minnesota; Jackson, Mississippi; Forsyth County, North Carolina; and Washington County, Maryland)23. Several clinic visits have taken place since, during which participants completed numerous questionnaires and extensive physical examinations: Visit 1 (1987–1989), Visit 2 (1990–1992), Visit 3 (1993–1995), Visit 4 (1996–1998), Visit 5 (2011–2013), Visit 6 (2016–2017), Visit 7 (ongoing). The participants were also followed by phone and through linkage to hospital and death records to identify any cardiovascular events24. The study was approved by institutional review boards of all four field centers, and all participants gave written informed consent. For this analysis, we studied the association of serum calcium and phosphorus with measures of left ventricular structure and function among participants who attended ARIC Visit 5.
As shown in Figure 1, of the 6,538 participants who attended ARIC Visit 5, we excluded participants who did not have echocardiography (n = 420), those identified as having a race other than black or white (n = 16), blacks from Minneapolis and Washington County due to small numbers (n = 26), those with missing values for serum calcium or phosphorus (n = 45) and those with prevalent heart failure (n = 818). A total of 5,213 participants were included in our final analysis.
Figure 1:
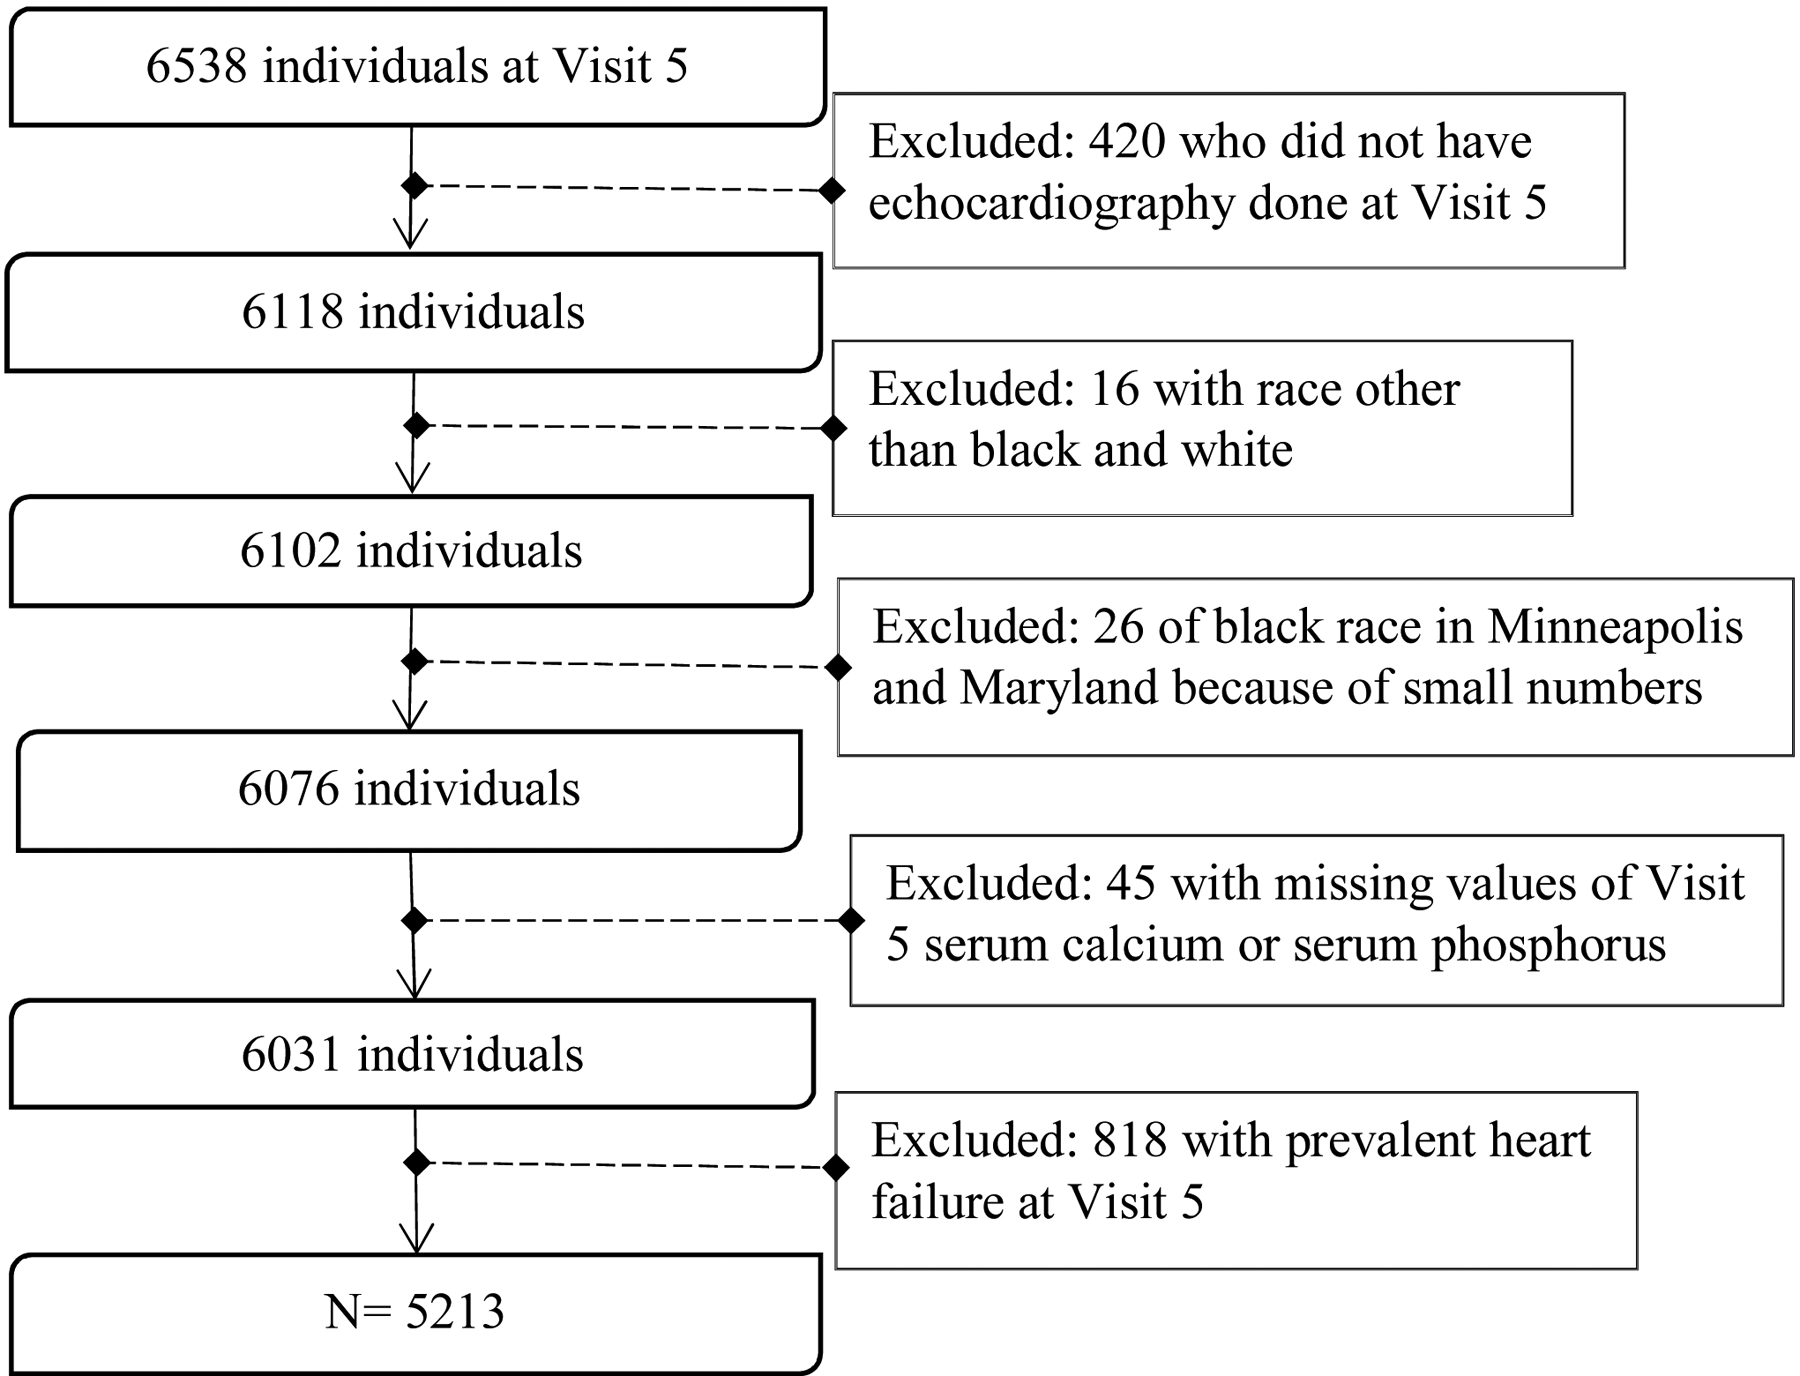
Exclusion Criteria for the final analysis
Measurement of exposure and other covariates
At Visit 5, interviewers collected information on participant’s demographics, medical history, and other lifestyle factors including smoking and drinking status, and physical activity. Participants brought medication bottles to the clinic visit; medication names were transcribed and coded. Participants were asked to fast overnight and blood samples were obtained and stored at −80 degrees Celsius until testing. Serum calcium was measured using the Roche COBAS 6000 chemistry analyzer by the colorimetric (NM-BAPTA) method; the lower limit of detection for calcium was 0.4 mg/dL25. The coefficient of variation based on ARIC blind duplicate specimens which were split at the time of blood draw was 1.1%. Serum albumin was measured using Roche Modular P800 Chemistry Analyzer (Roche Diagnostics Corporation) by the bromocresol purple method. The lower and upper level of detection was 1 g/dL and 16 g/dL respectively, and the coefficient of variation was 1.8%. As has been done previously in ARIC,3,10,26 we corrected serum calcium concentrations for serum albumin using the following formula: corrected calcium = [(0.8 * (4 - serum albumin)) + serum calcium]. Corrected total calcium was used for all analyses since it represents ionized calcium more accurately than uncorrected total calcium if a person has an abnormal serum albumin concentration27. For serum phosphorus, the Roche COBAS 6000 chemistry analyzer was used, and the serum concentration was measured by the photometric (molybdate) method. The lower limit of detection for serum phosphorus was 0.3 mg/dL28, and the coefficient of variation based on blind duplicates was 2.0%. The range of 8.410.2 mg/dL was regarded as normal for serum calcium25 and the range of 2.7–4.5 mg/dL was considered normal for serum phosphorus28.
Physical activity was measured as a composite score of sport during leisure time. Cigarette smoking status and drinking status were self-reported. Body mass index (BMI) was calculated as weight (in kg) divided by height (in meters) squared. Total plasma cholesterol and triglycerides were measured by enzymatic methods. HDL cholesterol levels were determined enzymatically after dextran sulfate-magnesium precipitation29. LDL cholesterol levels were estimated with the Friedewald formula30. Diabetes was considered present if the participant had fasting blood glucose ≥126 mg/dL, a non-fasting glucose ≥200 mg/dL, used medication for diabetes or self-reported a physician diagnosis of diabetes. Three blood pressure measurements were taken by trained staff, after a 5-minute rest. The mean of the 2nd and 3rd measurements were averaged for use in analysis. Hypertension was defined by mean systolic blood pressure ≥140 mm Hg, mean diastolic blood pressure ≥90 mm Hg, or use of blood pressure lowering medications. Estimated glomerular filtration rate (eGFR) was calculated based on creatinine level using the CKD-EPI (CKD-Epidemiology Collaboration) equation31 and was divided into three categories: normal (≥90 mL/min per 1.73 m2), mildly reduced (60.0-<90 mL/min per 1.73 m2), and reduced (<60 mL/min per 1.73 m2).
Echocardiography
Echocardiography at Visit 5 was done by trained and certified sonographers as per the ARIC protocol32 and quantitative measures were performed by the trained analysts at the central laboratory as recommended by American Society of Echocardiography (ASE)33–35. In addition to that, the results were over-read by certified sonographers which further ensured the accuracy of these measurements. The methods and results of interobserver variability and temporal drift are described in detail in previous paper32. Briefly, the analysts repeated the previously completed analysis in the blinded manner and the results were compared to calculate interobserver variability. In ARIC, the coefficient of variation was 7.7%, 6.4%, and 9.7% for longitudinal strain in the apical 4-chamber view, longitudinal strain in the apical 2-chamber view, and circumferential strain, respectively32. End-diastolic volume, left ventricular mass, and left atrial volume were indexed to body surface area (BSA) to account for the variation in body size among participants. LV end-diastolic diameter (LVEDD), LV mean wall thickness (LVMWT), LV end diastolic volume index (EDVI), LV mass index (LVMI), LV hypertrophy (LVH), LV mass to volume ratio, and LV relative wall thickness (RWT) were used as markers of LV structure. RWT was calculated as [(2*posterior wall thickness)/ LVEDD]. LV dimensions like LVEDD, LV wall thickness were measured in ARIC from the parasternal long axis view. LV ejection fraction (EF) and longitudinal strain (LS) were used to assess LV systolic function. Tissue Doppler Imaging (TDI) septal early diastolic myocardial velocity (TDI septal e’), septal E/e’ ratio (i.e. peak E wave velocity/ TDI septal e’) and left atrial volume index (LAVI) were used to measure LV diastolic function. Left ventricular hypertrophy (LVH) was defined as left ventricular mass index >115 g/m2 for men and >95 g/m2 for women. We also divided the participants into 4 categories based on their LV geometry: normal geometry (no LVH, RWT ≤0.42), concentric remodeling (no LVH, RWT >0.42), concentric hypertrophy (LVH present, RWT >0.42), and eccentric hypertrophy (LVH present, RWT ≤0.42). We also categorized participants based on their EF: preserved EF (EF >50%) and reduced EF (EF ≤50%).
Statistical Analysis
SAS version 9.4 was used to perform the statistical analyses. Descriptive characteristics were calculated according to quintiles of serum calcium and phosphorus. We used ANOVA to determine the multivariable-adjusted means and 95% confidence intervals of the markers of LV structure, and diastolic and systolic function across different categories of calcium and phosphorus. We also conducted tests for trend, by modeling serum calcium and phosphorous quintiles as ordinal variables. P-values <0.05 were considered statistically significant without adjustment for multiple comparisons. For the primary analysis, we adjusted for age, sex, race-center (a 5-level variable, reflecting combinations present in ARIC: Minnesota whites, Maryland whites, North Carolina blacks, North Carolina whites, and Mississippi blacks), body mass index (BMI), eGFR, heart rate, systolic blood pressure (SBP), physical activity (sport index), cigarette smoking status (current, former, never), drinking status (current, former, never), diabetes, high density lipoprotein cholesterol (HDL-C), low density lipoprotein (LDL-C), use of lipid-lowering drugs, use of anti-hypertensive medications, and prevalent coronary heart disease at Visit 5. We also evaluated whether eGFR modifies the association between serum biomarkers and echo markers.
Several supplemental analyses were conducted: 1) We examined the association excluding participants with prevalent CHD at Visit 5. 2) We studied the association of calcium and phosphorus with LV structural and diastolic parameters among those with preserved EF. 3) We also explored using the calcium-phosphorus product as an exposure. The calcium-phosphorus product was calculated by multiplying serum calcium and serum phosphorus, and was divided into quintiles for analysis.
RESULTS
The 5,213 participants in our final analytic sample had a mean age of 75.3 ± 5.1 years, 59.1% were women and 19.8% blacks. Participants in highest quintile of serum calcium were, in general, more likely to be female, black, diabetic, hypertensive, less physically active, and to have more adverse levels of cardiovascular risk factors (e.g. higher BMI, cholesterol) compared to participants in the lowest quintile of calcium (Table 1). Participants in the highest quintile of serum phosphorus were more likely to be female, white, less physically active, and have low BMI compared to participants in the lowest phosphorus quintile (Table 2). For corrected calcium, only 2.2% of participants had values outside the reference range. For serum phosphorus only 3.9% had values beyond the clinically reference range. In addition, 98.5% of the participants had preserved EF, while only 1.5% of participants had reduced EF.
Table 1.
Participant characteristics across quintiles of serum calcium: The ARIC Study, 2011–2013
| Visit 5 | Calcium Quintiles | ||||
|---|---|---|---|---|---|
| 7.0–9.0 mg/dL | 9.1–9.2 mg/dL | 9.3–9.3 mg/dL | 9.4–9.6 mg/dL | 9.7–13.0 mg/dL | |
| N | 1210 | 1113 | 627 | 1379 | 882 |
| Demographics | |||||
| Age in years, Mean (SD) | 75.2 (5.1) | 75 (4.9) | 75.3 (5.0) | 75.4 (5.1) | 75.9 (5.2) |
| Men, N (%) | 743 (61.4) | 549 (49.3) | 231 (36.8) | 438 (31.8) | 170 (19.3) |
| Whites, N (%) | 1094 (90.4) | 950 (85.4) | 497 (79.3) | 1038 (75.3) | 601 (68.1) |
| Body Mass Index, kg/m2, Mean (SD) | 27.7 (4.9) | 28.4 (5.1) | 28.6 (5.5) | 28.8 (5.8) | 28.9 (5.9) |
| Medical Information | |||||
| Current Smoker, N (%) | 62 (5.4) | 68 (6.5) | 35 (6.0) | 88 (6.9) | 66 (8.1) |
| Former Smoker, N (%) | 642 (55.7) | 549 (52.3) | 310 (52.8) | 616 (47.9) | 376 (46.0) |
| Current Drinker, N (%) | 642 (55.7) | 549 (52.3) | 310 (52.8) | 616 (47.9) | 376 (46.0) |
| Former Drinker, N (%) | 289 (24.7) | 294 (27.1) | 168 (27.8) | 385 (28.7) | 251 (29.6) |
| Diabetes, N (%) | 279 (23.3) | 311 (28.1) | 189 (30.4) | 425 (31.1) | 322 (36.7) |
| Hypertension, N (%) | 776 (64.7) | 757 (68.6) | 452 (72.7) | 1042 (76.3) | 695 (79.9) |
| Systolic Blood Pressure, mm Hg, Mean (SD) | 130 (17) | 130 (17) | 129 (18) | 130 (18) | 132 (19) |
| Diastolic Blood Pressure, mm Hg, Mean (SD) | 66 (10) | 67 (10) | 67 (11) | 67 (11) | 67 (11) |
| Heart rate, bpm, mean (SD) | 64 (10) | 64 (10) | 66 (12) | 66 (11) | 67 (12) |
| Sport index, mean (SD) | 2.7 (0.8) | 2.7 (0.8) | 2.6 (0.8) | 2.5 (0.8) | 2.5 (0.8) |
| Prevalent CHD, N (%) | 155 (13) | 130 (11.9) | 58 (9.4) | 109 (8.1) | 67 (7.7) |
| Laboratory Data | |||||
| Low density lipoprotein cholesterol, mg/dL, | |||||
| Mean (SD) | 103 (33) | 105 (33) | 106 (36) | 107 (34) | 107 (33) |
| High-density lipoprotein cholesterol, mg/dL, | |||||
| Mean (SD) | 51 (15) | 52 (13) | 53 (13) | 54 (14) | 54 (14) |
| Total cholesterol, mg/dL, Mean (SD) | 178 (41) | 182 (40) | 184 (43) | 187 (42) | 187 (41) |
| Triglyceride, mg/dL, Mean (SD) | 120 (58) | 126 (66) | 125 (60) | 128 (66) | 129 (64) |
| eGFR category, N (%) | |||||
| ≥90 mL/min per 1.73 m2 | 104 (8.6) | 110 (9.9) | 52 (8.3) | 121 (8.8) | 83 (9.4) |
| 60-<90 mL/min per 1.73 m2 | 833 (68.8) | 758 (68.1) | 418 (66.7) | 884 (64.1) | 497 (56.4) |
| <60 mL/min per 1.73 m2 | 273 (22.6) | 245 (22.0) | 157 (25.0) | 374 (27.1) | 302 (34.2) |
| Medications | |||||
| Antihypertensives, N (%) | 781 (64.6) | 762 (68.6) | 452 (72.2) | 1054 (76.5) | 691 (78.5) |
| Cholesterol lowering drugs, N (%) | 613 (50.9) | 601 (54.3) | 341 (54.6) | 743 (54.2) | 504 (57.6) |
| Diabetic Medications, N (%) | 147 (12.2) | 161 (14.5) | 112 (17.9) | 274 (20.0) | 219 (25.0) |
eGFR = estimated glomerular filtration rate
Table 2.
Participant characteristics across quintiles of serum phosphorus: The ARIC Study, 2011–2013
| Visit 5 | Phosphorus Quintiles | ||||
|---|---|---|---|---|---|
| 1.8–3.0 mg/dL | 3.1–3.3 mg/dL | 3.4–3.5 mg/dL | 3.6–3.8 mg/dL | 3.9–6.2 mg/dL | |
| N | 911 | 1178 | 910 | 1222 | 992 |
| Demographics | |||||
| Age in years, Mean (SD) | 75.5 (5.1) | 75.3 (5.2) | 75.4 (5.1) | 75.3 (4.9) | 75.1 (5.1) |
| Men, N (%) | 636 (69.8) | 604 (51.3) | 371 (40.8) | 330 (27.0) | 192 (19.4) |
| Whites, N (%) | 683 (75.0) | 931 (79.0) | 727 (79.9) | 993 (81.3) | 848 (85.5) |
| Body Mass Index, kg/m2, Mean (SD) | 28.8 (5.4) | 28.6 (5.3) | 28.4 (5.5) | 28.3 (5.7) | 28.1 (5.3) |
| Medical Information | |||||
| Current Smoker, N (%) | 41 (4.9) | 80 (7.1) | 45 (5.2) | 88 (7.7) | 65 (7.0) |
| Former Smoker, N (%) | 482 (57.7) | 587 (52.3) | 433 (50.3) | 535 (46.6) | 458 (49.4) |
| Current Drinker, N (%) | 452 (51.0) | 599 (53.0) | 447 (50.7) | 585 (49.3) | 531 (55.0) |
| Former Drinker, N (%) | 275 (31.0) | 315 (27.9) | 249 (28.3) | 329 (27.7) | 219 (22.7) |
| Diabetes, N (%) | 283 (31.3) | 336 (28.6) | 263 (29.2) | 359 (29.6) | 286 (29.1) |
| Hypertension, N (%) | 654 (72.4) | 828 (71.1) | 666 (73.9) | 854 (70.5) | 720 (73.3) |
| Systolic Blood Pressure, mm Hg, Mean (SD) | 131 (18) | 130 (18) | 130 (17) | 130 (18) | 130 (18) |
| Diastolic Blood Pressure, mm Hg, Mean (SD) | 68 (11) | 67 (10) | 67 (10) | 66 (10) | 65 (11) |
| Heart rate, bpm, mean (SD) | 65 (11) | 65 (11) | 64 (11) | 66 (11) | 66 (11) |
| Sport index, mean (SD) | 2.7 (0.8) | 2.6 (0.8) | 2.6 (0.8) | 2.6 (0.8) | 2.5 (0.8) |
| Prevalent CHD, N (%) | 100 (11.2) | 121 (10.5) | 97 (10.8) | 104 (8.7) | 97 (9.9) |
| Laboratory Data | |||||
| Low density lipoprotein cholesterol, mg/dL, | |||||
| Mean (SD) | 104 (34) | 107 (34) | 105 (33) | 107 (35) | 105 (34) |
| High-density lipoprotein cholesterol, mg/dL, | |||||
| Mean (SD) | 49 (13) | 52 (14) | 53 (14) | 55 (14) | 55 (14) |
| Total cholesterol, mg/dL, Mean (SD) | 177 (41) | 183 (41) | 183 (42) | 187 (41) | 186 (41) |
| Triglyceride, mg/dL, Mean (SD) | 124 (65) | 124 (59) | 125 (64) | 125 (64) | 128 (66) |
| eGFR category, N (%) | |||||
| ≥90 mL/min per 1.73 m2 | 224 (24.6) | 287 (24.4) | 243 (26.7) | 316 (25.9) | 281 (28.3) |
| 60-<90 mL/min per 1.73 m2 | 607 (66.6) | 786 (66.7) | 594 (65.3) | 785 (64.2) | 620 (62.5) |
| <60 mL/min per 1.73 m2 | 80 (8.8) | 105 (8.9) | 73 (8.0) | 121 (9.9) | 91 (9.2) |
| Medications | |||||
| Antihypertensives, N (%) | 658 (72.3) | 819 (69.7) | 676 (74.5) | 867 (71) | 721 (72.8) |
| Cholesterol lowering drugs, N (%) | 477 (52.7) | 604 (51.7) | 479 (52.9) | 666 (54.7) | 577 (58.3) |
| Diabetic Medications, N (%) | 169 (18.7) | 181 (15.5) | 157 (17.4) | 229 (18.8) | 178 (18.0) |
eGFR = estimated glomerular filtration rate
Serum calcium and markers of L V structure and function
After multivariate adjustment (Table 3), we observed the association of higher calcium with lower LVEDD and LVEDVI (p-trend: 0.005) without any significant association with LV wall thickness and LV mass. We also observed better indices of mean (95% CI) septal e’ (cm/sec) in quintile 1 [5.87 (5.74, 6.00)] compared to quintile 5 [5.61 (5.47, 5.75)], p-trend: 0.002. However, opposite trend was seen with E/e’ septal ratio and LAVI. The mean (95% CI) E/e’ septal ratio was higher in calcium quintile 1 [12.5 (12.1, 12.8)] compared to quintile 5 [12.1 (11.8, 12.5], p-trend: 0.01. Similarly, mean (95% CI) LAVI (ml/m2) was higher in calcium quintile 1 [26.3 (25.6, 27.1)] vs quintile 5 [24.6 (23.8, 25.4)], p-trend: <0.001. Although we saw significant association, the adjusted mean (95% CI) of the diastolic parameters across all the calcium quintiles were within the range considered clinically normal and the magnitudes of association were quite modest. Serum calcium quintiles were not significantly associated with measures of LV systolic function. While the p-values for trend were not significant for LVMWT or LVH, upon separately looking at LV geometry (Figure 2), there was a trend of higher calcium concentrations being associated with more concentric remodeling (p-trend: 0.004), in the fully adjusted models. There was no effect modification by eGFR on the association of serum calcium and echo parameters.
Table 3.
Association of serum calcium with measures of LV structure and function: The ARIC Study, 2011–2013
| Visit 5 | Calcium Quintiles | P for trend | ||||
|---|---|---|---|---|---|---|
| 7.0–9.0 mg/dL | 9.1–9.2 mg/dL | 9.3–9.3 mg/dL | 9.4–9.6 mg/dL | 9.7–13.0 mg/dL | ||
| N | 1210 | 1113 | 627 | 1379 | 882 | |
| LV structure | ||||||
| End Diastolic Diameter (cm) | 4.43 (4.39,4.46) | 4.40 (4.37,4.44) | 4.40 (4.35,4.44) | 4.38 (4.34,4.41) | 4.38 (4.34,4.42) | 0.005 |
| End Diastolic Volume Index (mL /m2) | 44.4 (43.6,45.1) | 43.5 (42.7,44.3) | 43.5 (42.5,44.4) | 43.2 (42.4,43.9) | 43.2 (42.3,44.1) | 0.005 |
| LV Mean wall thickness (cm) | 1.00 (0.99,1.01) | 1.00 (0.99,1.01) | 0.99 (0.98,1.01) | 1.00 (0.99,1.01) | 1.01 (1.00,1.02) | 0.34 |
| LV mass index (g/m2) | 80.5 (78.9,82.0) | 80.8 (79.3,82.4) | 79.5 (77.7,81.3) | 79.2 (77.7,80.7) | 80.9 (79.2,82.5) | 0.45 |
| LV hypertrophy, (%) | 10.1 (7.52,12.6) | 10.0 (7.46,12.6) | 9.39 (6.40,12.4) | 8.75 (6.33,11.2) | 9.99 (7.25,12.7) | 0.53 |
| LV mass/end-diastolic volume | 1.83 (1.79,1.87) | 1.87 (1.83,1.92) | 1.85 (1.80,1.90) | 1.86 (1.82,1.90) | 1.90 (1.86,1.95) | 0.02 |
| Relative wall thickness | 0.43 (0.42,0.43) | 0.43 (0.42,0.44) | 0.43 (0.42,0.44) | 0.43 (0.43,0.44) | 0.44 (0.43,0.45) | <0.001 |
| LV systolic function | ||||||
| Ejection Fraction (%) | 66.2 (65.6,66.7) | 65.9 (65.4,66.5) | 65.6 (65,66.2) | 65.8 (65.3,66.2) | 65.7 (65.1,66.2) | 0.07 |
| Longitudinal strain (%) | −17.8 (−18.1,−17.6) | −17.8 (−18.0,−17.6) | −17.6 (−17.8,−17.3) | −17.9 (−18.1,−17.7) | −17.9 (−18.1,−17.7) | 0.29 |
| LV diastolic function | ||||||
| TDI septal e’ (cm/sec) | 5.87 (5.74,6.00) | 5.75 (5.62,5.88) | 5.66 (5.51,5.81) | 5.75 (5.62,5.87) | 5.61 (5.47,5.75) | 0.002 |
| Septal E/e’ ratio | 12.5 (12.1,12.8) | 12.4 (12.1,12.7) | 12.4 (12.0,12.8) | 12.0 (11.7,12.3) | 12.1 (11.8,12.5) | 0.01 |
| Left atrial volume index (mL/m2) | 26.3 (25.6,27.1) | 25.5 (24.8,26.2) | 25.6 (24.8,26.5) | 24.9 (24.2,25.6) | 24.6 (23.8,25.4) | <.001 |
All values are shown as Mean (95% Confidence Interval) adjusted for age, sex, race-center, BMI, eGFR, heart rate, systolic blood pressure, sport index, cigarette smoking status, drinking status, diabetes, HDL-C, LDL-C, use of lipid lowering medications, use of antihypertensives, prevalent CHD at Visit 5
Figure 2:

Associations of serum calcium with left ventricular geometry: The ARIC Study, 2011–2013
In the sensitivity analysis, when we excluded 612 participants (i.e. 519 with prevalent CHD and 93 with missing status at Visit 5), the results were mostly similar (Supplemental Table 1); however, on doing so, we saw a trend whereby higher serum calcium concentrations were associated with lower EF (p-trend: 0.03). Likewise, when we studied LV diastolic and structural parameters on those with preserved EF (n=4976), the findings were similar to Table 3 (Supplemental Table 2).
Serum Phosphorus and markers of L V structure and function
We found higher mean (95% CI) septal E/e’ ratio in quintile 5 [12.4 (12.1, 12.8)] compared to quintile 1 [11.9 (11.5, 12.3)], p-trend: 0.02. We observed significant effect modification by eGFR (p-value: 0.002) in the association of serum phosphorus and LAVI. In analyses stratifying 3 eGFR categories, we observed significant trend (p-trend: 0.001) of higher serum phosphorus being associated with higher LAVI among those with reduced eGFR (i.e. eGFR<60 mL/min per 1.73 m2). We didn’t observe significant trend of phosphorus and LAVI among those with normal and mildly reduced eGFR (Table 4). There were no other significant trends between serum phosphorus quintiles and measures of LV structure, LV systolic function (Table 4) or LV geometry (Supplemental Figure 1).
Table 4.
Association of serum phosphorus with measures of LV structure and function: The ARIC Study, 2011–2013
| Visit 5 | Phosphorus Quintiles | P for trend | ||||
|---|---|---|---|---|---|---|
| 1.8–3.0 mg/dL | 3.1–3.3 mg/dL | 3.4–3.5 mg/dL | 3.6–3.8 mg/dL | 3.9–6.2 mg/dL | ||
| N | 911 | 1178 | 910 | 1222 | 992 | |
| LV structure | ||||||
| End Diastolic Diameter (cm) | 4.41 (4.37,4.45) | 4.40 (4.37,4.44) | 4.40 (4.36,4.44) | 4.37 (4.34,4.41) | 4.39 (4.35,4.43) | 0.16 |
| End Diastolic Volume Index (mL /m2) | 43.4 (42.6,44.3) | 43.2 (42.5,44.0) | 43.4 (42.6,44.3) | 43.7 (42.9,44.4) | 43.9 (43.1,44.7) | 0.17 |
| LV Mean wall thickness (cm) | 1.01 (0.99,1.02) | 1.00 (0.99,1.01) | 0.99 (0.98,1.00) | 1.00 (0.99,1.01) | 1.01 (1.00,1.02) | 0.33 |
| LV mass index (g/m2) | 80.9 (79.2,82.6) | 79.8 (78.3,81.3) | 79.3 (77.6,80.9) | 79.7 (78.2,81.2) | 81.3 (79.7,83.0) | 0.63 |
| LV hypertrophy, (%) | 9.14 (6.40,11.9) | 8.87 (6.36,11.4) | 8.36 (5.67,11.1) | 9.90 (7.41,12.4) | 11.7 (9.00,14.3) | 0.06 |
| LV mass/end-diastolic volume | 1.88 (1.84,1.93) | 1.87 (1.83,1.91) | 1.85 (1.80,1.89) | 1.85 (1.80,1.89) | 1.88 (1.83,1.92) | 0.55 |
| Relative wall thickness | 0.43 (0.43,0.44) | 0.43 (0.42,0.44) | 0.43 (0.42,0.44) | 0.43 (0.43,0.44) | 0.44 (0.43,0.44) | 0.12 |
| LV systolic function | ||||||
| Ejection Fraction (%) | 66.0 (65.4,66.5) | 65.8 (65.3,66.4) | 66.0 (65.5,66.6) | 65.7 (65.2,66.2) | 65.7 (65.2,66.3) | 0.37 |
| Longitudinal strain (%) | −17.9 (−18.1,−17.7) | −17.9 (−18.1,−17.7) | −17.8 (−18.1,−17.6) | −17.8 (−18.0,−17.6) | −17.8 (−18.0,−17.6) | 0.30 |
| LV diastolic function | ||||||
| TDI septal e’ (cm/sec) | 5.81 (5.67,5.95) | 5.74 (5.61,5.87) | 5.80 (5.66,5.94) | 5.69 (5.57,5.82) | 5.68 (5.55,5.82) | 0.08 |
| Septal E/e’ ratio | 11.9 (11.5,12.3) | 12.2 (11.9,12.6) | 12.3 (12.0,12.7) | 12.3 (12.0,12.6) | 12.4 (12.1,12.8) | 0.02 |
| Left atrial volume index (mL/m2)* | 24.8(24.0,25.6) | 25.4(24.6,26.1) | 25.1(24.4,25.9) | 25.7(25.0,26.4) | 25.7(24.9,26.4) | 0.03 |
| eGFR: >90 mL/min per 1.73 m2 | 24.8 (22.7,27.0) | 25.1 (23.3,27.0) | 25.1 (22.9,27.4) | 26.1 (24.3,27.9) | 24.0 (22.0,26.1) | 0.92 |
| eGFR: 60-<90 mL/min per 1.73 m2 | 24.7 (23.7,25.7) | 25.1 (24.2,26.0) | 25.1 (24.2,26.1) | 24.7 (23.8,25.6) | 25.4 (24.4,26.3) | 0.51 |
| eGFR: <60 mL/min per 1.73 m2 | 23.8 (22.3,25.4) | 24.9 (23.4,26.3) | 24.0 (22.5,25.5) | 26.8 (25.4,28.1) | 25.8 (24.4,27.3) | 0.001 |
All values are shown as Mean (95% Confidence Interval) adjusted for age, sex, race-center, BMI, eGFR, heart rate, systolic blood pressure, sport index, cigarette smoking status, drinking status, diabetes, HDL-C, LDL-C, use of lipid lowering medications, use of antihypertensives, prevalent CHD at Visit
Since we observed significant interaction by eGFR in the association of serum phosphorus and LAVI (p-value: 0.002), analyses of LAVI was stratified across the eGFR categories.
In sensitivity analyses, when we excluded prevalent CHD cases at Visit 5 (Supplemental Table 3), the results were mainly the same except we observed a trend of higher serum phosphorus quintiles being associated with greater mean LV EDVI (p-trend: 0.02) and LVH (p-trend: 0.04). In addition, the p-value for trend became insignificant for septal E/e’ ratio. Similar to the main results, we also found an inverse association of phosphorus and EF in our supplemental analyses restricted to those with preserved EF (Supplemental Table 4).
Calcium Phosphorus product and markers of L V structure and function
The calcium-phosphorus product for all observations were within the normal range36 of less than 55 mg2/dL2. After multivariate adjustment, we found that higher calcium-phosphorus product quintiles were associated with lower LVEDD, and TDI septal e’. We did not observe any significant association of the calcium-phosphorus product with LV systolic function (Supplemental Table 5).
DISCUSSION
Overall, we found that higher calcium concentrations were associated with more concentric remodeling and lower LVEDD. Only on excluding prevalent CHD, did we see that higher calcium concentrations were associated with lower LV ejection fraction. On the other hand, high phosphorus was associated with worse indices of LV diastolic function but not with systolic function after adjusting for other cardiovascular risk factors. Higher phosphorus was also significantly associated with more LVH among those with preserved EF. Importantly, these patterns were observed within ranges of serum calcium and phosphorus generally classified as normal; for serum calcium, only 2.2% had values outside the clinically normal range while for serum phosphorous only 3.9% were abnormal. While significant associations were observed, the mean (95% C.I.) of the echo parameters were within the clinical normal range across the quintiles of calcium and phosphorus and the magnitudes of association were relatively small, thus the clinical implications of these findings may be limited.
Prior work supports our finding that ejection fraction tended to be lower among participants with high serum calcium. Most notably, in the Effect of VItamin D on All-Cause MorTAlity in Heart Failure (EVITA) randomized trial, which assigned 400 heart failure patients to 4,000 IU vitamin D supplements daily or matching placebo, vitamin D supplementation increased serum calcium significantly and was associated with poorer cardiac function (evidenced by the secondary outcome, need for mechanical circulatory support implantation)37. Moreover, in post-hoc analyses of this same trial, vitamin D supplementation was associated with improved LVEF values only in patients without significant changes in serum calcium, but not in patients with a significant increase in serum calcium38. Also, a study done among coronary artery disease patients found an association of low calcium with greater systolic dysfunction22. In contrast to our results, a study conducted among chronic kidney disease patients found that participants with low early diastolic velocity had lower serum calcium in comparison with participants with normal diastolic velocity21.
High phosphorus was associated with worse indices of LV diastolic function among ARIC study participants. This finding is supported by prior studies, conducted in clinical samples, which found that elevated serum phosphorus was associated with worse diastolic function19,39,40 and cardiac hypertrophy19,41,42. Notably, the association between serum phosphorus and hypertrophy was only present in the ARIC participants with preserved EF, and those without prevalent CHD. Although a prior study of chronic kidney disease patients found that serum phosphorus was significantly associated with eccentric LVH42, in our sample there was no association of serum phosphorus with LV geometry.
This study has some limitations that need to be considered. Firstly, since we are using cross-sectional data, we cannot establish temporality and therefore causal inference is limited. In addition, measurement error may exist, as serum electrolytes may change over time, and we have only considered serum values of calcium and phosphorus at one point in the life-course. There is also a possibility of selection bias as individuals who participated in visit 5 are healthier compared to those unwilling or unable to attend the visit because of infirmity. Multiple factors can impact the levels of calcium and phosphorus in the blood such as level of parathyroid hormone and intake of excessive vitamin D and calcium supplements. In addition to that, imbalance in the fibroblast growth factor 23 and klotho axis can also influence calcium and phosphorus hemostasis resulting in abnormal level of these biomarkers in blood43,44. Unfortunately, these additional markers of mineral metabolism were not measured at ARIC visit 5, and therefore they are not included in our study. Related, serum biomarkers may also be influenced by endocrine disorders. However, since endocrine disorders are not captured by ARIC, we couldn’t account for this during the analysis. Another consideration is that we have used fasting serum calcium and phosphorus for our study. However, non-fasting serum calcium and phosphorus of the participants may be significantly higher than fasting levels since the calcium and phosphorus levels can be affected by dietary intake, physical activity, and the time of the day45,46. It is currently unknown whether fasting or nonfasting concentrations are most relevant in evaluating associations between these biomarkers and echocardiographic parameters. Also, even though we have adjusted for major cardiovascular risk factors, residual confounding may remain. Finally, we did not adjust p-values for multiple comparisons and so some associations may have been due to chance.
In conclusion, in this community-based sample of elderly individuals, higher calcium was related to greater concentric modeling and lower LVEDD. In addition, we found the association of higher serum phosphorus with diastolic dysfunction and LVH. These results provide some insights regarding how serum calcium and phosphorus may influence risk of heart failure and other cardiovascular conditions. However, the overall magnitude of effects observed were relatively small, so serum calcium and phosphorus may not be clinically relevant in terms of risk prediction in the general population.
Supplementary Material
Highlights.
Higher calcium was associated with more concentric remodeling and lower LVEDD.
Higher serum phosphorus was related to worse LV diastolic function and hypertrophy.
These findings provide insights about the role of calcium and phosphorous in CVD risk.
ACKNOWLEDGEMENTS
Funding Sources: The Atherosclerosis Risk in Communities Study is supported by National Heart, Lung, and Blood Institute contracts (HHSN268201100005C, HHSN268201100006C, HHSN268201100007C, HHSN268201100008C, HHSN2682011-00009C, HHSN268201100010C, HHSN268201100011C, and HHSN268201100012C).
Dr. Shah is supported by NIH/NHLBI grants R01HL135008 and R01HL143224.
Footnotes
Publisher's Disclaimer: This is a PDF file of an unedited manuscript that has been accepted for publication. As a service to our customers we are providing this early version of the manuscript. The manuscript will undergo copyediting, typesetting, and review of the resulting proof before it is published in its final form. Please note that during the production process errors may be discovered which could affect the content, and all legal disclaimers that apply to the journal pertain.
Disclosures: Dr Shah receives research support through Brigham and Women’s Hospital from Novartis. He serves as a consultant from Bellerophon Therapeutics and Philips Ultrasound.
References:
- 1.Marks AR. Calcium and the heart: a question of life and death J Clin Invest, 2003:597–600. [DOI] [PMC free article] [PubMed] [Google Scholar]
- 2.Fantar S What Does Phosphorus Do for the Heart? Healthy Eating | SF Gate, 2018. [Google Scholar]
- 3.Rooney MR, Pankow JS, Sibley SD, Selvin E, Reis JP, Michos ED, Lutsey PL. Serum calcium and incident type 2 diabetes: the Atherosclerosis Risk in Communities (ARIC) study Am J Clin Nutr, 2016:1023–1029. [DOI] [PMC free article] [PubMed] [Google Scholar]
- 4.Yagi S, Aihara K, Kondo T, Endo I, Hotchi J, Ise T, Iwase T, Akaike M, Matsumoto T, Sata M. High serum parathyroid hormone and calcium are risk factors for hypertension in Japanese patients. Endocr J 2014;61:727–733. [DOI] [PubMed] [Google Scholar]
- 5.Foley RN, Collins AJ, Ishani A, Kalra PA. Calcium-phosphate levels and cardiovascular disease in community-dwelling adults: the Atherosclerosis Risk in Communities (ARIC) Study. American heart journal 2008;156:556–563. [DOI] [PubMed] [Google Scholar]
- 6.Lind L, Skarfors E, Berglund L, Lithell H, Ljunghall S. Serum calcium: a new, independent, prospective risk factor for myocardial infarction in middle-aged men followed for 18 years. Journal of clinical epidemiology 1997;50:967–973. [DOI] [PubMed] [Google Scholar]
- 7.Sato H, Nagasawa T, Saito A, Miyazaki M. Risk of cardiovascular mortality predicted by the serum calcium level and calcification score at the initiation of dialysis. Clinical and experimental nephrology 2018. [DOI] [PubMed] [Google Scholar]
- 8.Lopez FL, Agarwal SK, Grams ME, Loehr LR, Soliman EZ, Lutsey PL, Chen LY, Huxley RR, Alonso A. Relation of serum phosphorus levels to the incidence of atrial fibrillation (from the Atherosclerosis Risk In Communities [ARIC] study). The American journal of cardiology 2013;111:857–862. [DOI] [PMC free article] [PubMed] [Google Scholar]
- 9.Dhingra R, Gona P, Benjamin EJ, Wang TJ, Aragam J, D’Agostino RB, Kannel WB, Vasan RS. Relations of serum phosphorus levels to echocardiographic left ventricular mass and incidence of heart failure in the community Eur J Heart Fail, 2010:812–818. [DOI] [PMC free article] [PubMed] [Google Scholar]
- 10.Lutsey PL, Alonso A, Michos ED, Loehr LR, Astor BC, Coresh J, Folsom AR. Serum magnesium, phosphorus, and calcium are associated with risk of incident heart failure: the Atherosclerosis Risk in Communities (ARIC) Study. The American journal of clinical nutrition 2014;100:756–764. [DOI] [PMC free article] [PubMed] [Google Scholar]
- 11.Dhingra R, Sullivan LM, Fox CS, Wang TJ, D’Agostino RB Sr., Gaziano JM, Vasan RS. Relations of serum phosphorus and calcium levels to the incidence of cardiovascular disease in the community. Archives of internal medicine 2007;167:879–885. [DOI] [PubMed] [Google Scholar]
- 12.Tonelli M, Sacks F, Pfeffer M, Gao Z, Curhan G. Relation between serum phosphate level and cardiovascular event rate in people with coronary disease. Circulation 2005;112:2627–2633. [DOI] [PubMed] [Google Scholar]
- 13.Block GA, Hulbert-Shearon TE, Levin NW, Port FK. Association of serum phosphorus and calcium x phosphate product with mortality risk in chronic hemodialysis patients: a national study. American journal of kidney diseases : the official journal of the National Kidney Foundation 1998;31:607–617. [DOI] [PubMed] [Google Scholar]
- 14.Paulus WJ, Sanderson JE, Flachskampf FA, Rademakers FE, Smiseth OA, Leite-Moreira AF, Fraser AG, Brutsaert DL. How to diagnose diastolic heart failure: a consensus statement on the diagnosis of heart failure with normal left ventricular ejection fraction by the Heart Failure and Echocardiography Associations of the European Society of Cardiology. European heart journal 2018;28:2539–2550. [DOI] [PubMed] [Google Scholar]
- 15.Bekwelem W, Misialek JR, Konety S, Solomon SD, Soliman EZ, Loehr LR, Lopez FL, Fox ER, Mosley TH, Alonso A. Echocardiographic measures of cardiac structure and function are associated with risk of atrial fibrillation in blacks: the Atherosclerosis Risk in Communities (ARIC) study. PloS one 2014;9:e110111. [DOI] [PMC free article] [PubMed] [Google Scholar]
- 16.Lam CSP, Gamble GD, Ling LH, Sim D, Leong KTG, Yeo PSD, Ong HY, Jaufeerally F, Ng TP, Cameron VA, Poppe K, Lund M, Devlin G, Troughton R, Richards AM, Doughty RN. Mortality associated with heart failure with preserved vs. reduced ejection fraction in a prospective international multi-ethnic cohort study. Eur Heart J 2018. [DOI] [PubMed] [Google Scholar]
- 17.Hays AG, Sacco RL, Rundek T, Sciacca RR, Jin Z, Liu R, Homma S, Tullio MRD. Left Ventricular Systolic Dysfunction and the Risk of Ischemic Stroke in a Multiethnic Population 2006. [DOI] [PMC free article] [PubMed] [Google Scholar]
- 18.Hayashi SY, Brodin LA, Alvestrand A, Lind B, Stenvinkel P, Mazza do Nascimento M, Qureshi AR, Saha S, Lindholm B, Seeberger A. Improvement of cardiac function after haemodialysis. Quantitative evaluation by colour tissue velocity imaging. Nephrol Dial Transplant 2004;19:1497–1506. [DOI] [PubMed] [Google Scholar]
- 19.Galetta F, Cupisti A, Franzoni F, Femia FR, Rossi M, Barsotti G, Santoro G. Left ventricular function and calcium phosphate plasma levels in uraemic patients. Journal of internal medicine 2005;258:378–384. [DOI] [PubMed] [Google Scholar]
- 20.Virtanen VK, Saha HH, Groundstroem KW, Seppälä ES, Pasternack AI. Calcium infusion and left ventricular diastolic function in patients with chronic renal failure. Nephrology Dialysis Transplantation 1998;13:384–388. [DOI] [PubMed] [Google Scholar]
- 21.Gromadzinski L, Januszko-Giergielewicz B, Pruszczyk P. Hypocalcemia is related to left ventricular diastolic dysfunction in patients with chronic kidney disease. J Cardiol 2014;63:198–204. [DOI] [PubMed] [Google Scholar]
- 22.Wang Y, Ma H, Hao X, Yang J, Chen Q, Lu L, Zhang R. Low serum calcium is associated with left ventricular systolic dysfunction in a Chinese population with coronary artery disease. Scientific Reports 2016;6:22283. [DOI] [PMC free article] [PubMed] [Google Scholar]
- 23.The Atherosclerosis Risk in Communities (ARIC) Study: design and objectives. The ARIC investigators. Am J Epidemiol 1989;129:687–702. [PubMed] [Google Scholar]
- 24.Atherosclerosis Risk in Communities Study Description | Atherosclerosis Risk in Communities. [Google Scholar]
- 25.Data Dictionary for Visit 5 Calcium Data | Atherosclerosis Risk in Communities, 2017. [Google Scholar]
- 26.Li J, Wu N, Dai W, Jiang L, Li Y, Li S, Wen Z. Association of serum calcium and heart failure with preserved ejection fraction in patients with type 2 diabetes. Cardiovasc Diabetol 2016;15. [DOI] [PMC free article] [PubMed] [Google Scholar]
- 27.Higgins C Ionized calcium acutecaretestingorg: acutecaretesting.org. [Google Scholar]
- 28.Data Dictionary for Visit 5 Phosphorus Data | Atherosclerosis Risk in Communities, 2017. [Google Scholar]
- 29.Warnick GR, Benderson J, Albers JJ. Dextran sulfate-Mg2+ precipitation procedure for quantitation of high-density-lipoprotein cholesterol. Clin Chem 1982;28:1379–1388. [PubMed] [Google Scholar]
- 30.Friedewald WT, Levy RI, Fredrickson DS. Estimation of the concentration of low-density lipoprotein cholesterol in plasma, without use of the preparative ultracentrifuge. Clin Chem 1972;18:499–502. [PubMed] [Google Scholar]
- 31.Inker LA, Schmid CH, Tighiouart H, Eckfeldt JH, Feldman HI, Greene T, Kusek JW, Manzi J, Van Lente F, Zhang YL, Coresh J, Levey AS. Estimating Glomerular Filtration Rate from Serum Creatinine and Cystatin C. N Engl J Med 2012;367:20–29. [DOI] [PMC free article] [PubMed] [Google Scholar]
- 32.Shah AM, Cheng S, Skali H, Wu J, Mangion JR, Kitzman D, Matsushita K, Konety S, Butler KR, Fox ER, Cook N, Ni H, Coresh J, Mosley TH, Heiss G, Folsom AR, Solomon SD. Rationale and design of a multicenter echocardiographic study to assess the relationship between cardiac structure and function and heart failure risk in a biracial cohort of community-dwelling elderly persons: the Atherosclerosis Risk in Communities study. Circ Cardiovasc Imaging 2014;7:173–181. [DOI] [PMC free article] [PubMed] [Google Scholar]
- 33.Lang RM, Bierig M, Devereux RB, Flachskampf FA, Foster E, Pellikka PA, Picard MH, Roman MJ, Seward J, Shanewise JS, Solomon SD, Spencer KT, Sutton MS, Stewart WJ. Recommendations for chamber quantification: a report from the American Society of Echocardiography’s Guidelines and Standards Committee and the Chamber Quantification Writing Group, developed in conjunction with the European Association of Echocardiography, a branch of the European Society of Cardiology. J Am Soc Echocardiogr 2005;18:1440–1463. [DOI] [PubMed] [Google Scholar]
- 34.Nagueh SF, Appleton CP, Gillebert TC, Marino PN, Oh JK, Smiseth OA, Waggoner AD, Flachskampf FA, Pellikka PA, Evangelista A. Recommendations for the evaluation of left ventricular diastolic function by echocardiography. J Am Soc Echocardiogr 2009;22:107–133. [DOI] [PubMed] [Google Scholar]
- 35.Rudski LG, Lai WW, Afilalo J, Hua L, Handschumacher MD, Chandrasekaran K, Solomon SD, Louie EK, Schiller NB. Guidelines for the echocardiographic assessment of the right heart in adults: a report from the American Society of Echocardiography endorsed by the European Association of Echocardiography, a registered branch of the European Society of Cardiology, and the Canadian Society of Echocardiography. J Am Soc Echocardiogr 2010;23:685–713; quiz 786–688. [DOI] [PubMed] [Google Scholar]
- 36.K/DOQI clinical practice guidelines for bone metabolism and disease in chronic kidney disease. Am J Kidney Dis 2003;42:S1–201. [PubMed] [Google Scholar]
- 37.Zittermann A, Ernst JB, Prokop S, Fuchs U, Dreier J, Kuhn J, Knabbe C, Birschmann I, Schulz U, Berthold HK, Pilz S, Gouni-Berthold I, Gummert JF, Dittrich M, Borgermann J. Effect of vitamin D on all-cause mortality in heart failure (EVITA): a 3-year randomized clinical trial with 4000 IU vitamin D daily. Eur Heart J 2017;38:2279–2286. [DOI] [PubMed] [Google Scholar]
- 38.Zittermann A, Ernst JB, Prokop S, Fuchs U, Gruszka A, Dreier J, Kuhn J, Knabbe C, Berthold HK, Gouni-Berthold I, Pilz S, Gummert JF, Paluszkiewicz L. Vitamin D supplementation of 4000IU daily and cardiac function in patients with advanced heart failure: The EVITA trial. Int J Cardiol 2019;280:117–123. [DOI] [PubMed] [Google Scholar]
- 39.Mitsnefes MM, Kimball TR, Border WL, Witt SA, Glascock BJ, Khoury PR, Daniels SR. Impaired left ventricular diastolic function in children with chronic renal failure. Kidney International 2004;65:1461–1466. [DOI] [PubMed] [Google Scholar]
- 40.Sonkar SK BM, Sonkar GK, Pandey SK, Chandra S, Bhosale V. Vitamin D levels and other biochemical parameters of mineral bone disorders and their association with diastolic dysfunction and left ventricular mass in young nondiabetic adult patients with chronic kidney disease. Saudi J Kidney Dis Transpl 2017;28:758–763. [PubMed] [Google Scholar]
- 41.Strózecki P, Adamowicz A, Nartowicz E, Odrowąż-Sypniewska G, Włodarczyk Z, Manitius J. Parathrom, calcium, phosphorus, and left ventricular structure and function in normotensive hemodialysis patients. Renal failure 2001;23:115–126. [DOI] [PubMed] [Google Scholar]
- 42.Zou J, Yu Y, Wu P, Lin FJ, Yao Y, Xie Y, Jiang GR. Serum phosphorus is related to left ventricular remodeling independent of renal function in hospitalized patients with chronic kidney disease. Int J Cardiol 2016;221:134–140. [DOI] [PubMed] [Google Scholar]
- 43.Kamr AM, Dembek KA, Hildreth BE 3rd, Morresey PR, Rathgeber RA, Burns TA, Zaghawa AA, Toribio RE. The FGF-23/klotho axis and its relationship with phosphorus, calcium, vitamin D, PTH, aldosterone, severity of disease, and outcome in hospitalised foals. Equine Vet J 2018;50:739–746. [DOI] [PubMed] [Google Scholar]
- 44.Hu MC, Shiizaki K, Kuro-o M, Moe OW. Fibroblast Growth Factor 23 and Klotho: Physiology and Pathophysiology of an Endocrine Network of Mineral Metabolism. Annu Rev Physiol 2013;75:503–533. [DOI] [PMC free article] [PubMed] [Google Scholar]
- 45.Siyam FF, Klachko DM. What Is Hypercalcemia? The Importance of Fasting Samples. Cardiorenal Med 2013;3:232–238. [DOI] [PMC free article] [PubMed] [Google Scholar]
- 46.Charnow AJ. Fasting Phosphorus Levels Are a Stronger Mortality Predictor - Renal and Urology News: renalandurologynews, 2013. [Google Scholar]
Associated Data
This section collects any data citations, data availability statements, or supplementary materials included in this article.