

SUMMARY
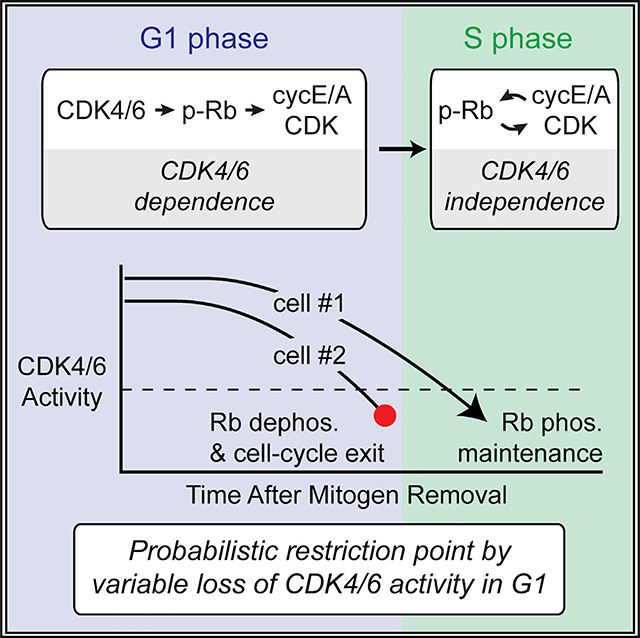
Cells escape the need for mitogens at a restriction point several hours before entering S phase. The restriction point has been proposed to result from CDK4/6 initiating partial Rb phosphorylation to trigger a bistable switch whereby cyclin E-CDK2 and Rb mutually reinforce each other to induce Rb hyperphosphorylation. Here, using single-cell analysis, we unexpectedly found that cyclin E/A-CDK activity can only maintain Rb hyperphosphorylation starting at the onset of S phase and that CDK4/6 activity, but not cyclin E/A-CDK activity, is required to hyperphosphorylate Rb throughout G1 phase. Mitogen removal in G1 results in a gradual loss of CDK4/6 activity with a high likelihood of cells sustaining Rb hyperphosphorylation until S phase, at which point cyclin E/A-CDK activity takes over. Thus, it is short-term memory, or transient hysteresis, in CDK4/6 activity following mitogen removal that sustains Rb hyperphosphorylation, demonstrating a probabilistic rather than an irreversible molecular mechanism underlying the restriction point.
In Brief
Chung et al. show that the commitment to mitogen-independent cell-cycle progression in G1, termed the restriction point (R), is not executed by an assumed feedback loop from cyclin E-CDK2 to Rb but rather by probabilistic short-term maintenance of CDK4/6 activity.
Graphical Abstract
INTRODUCTION
Regulation of cell-cycle entry is critical for the growth, repair, and maintenance of mammalian tissues. Mitogen-stimulated cells can enter the cell cycle by exiting quiescence, or G0, to enter G1 phase before replicating their DNA in S phase and undergoing cell division in mitosis. Early work in mammalian tissue culture led to the concept of a mammalian cell-cycle restriction point, a point in time in G1 phase when cells transition from mitogen dependence to mitogen independence and commit to completing the cell cycle (Pardee, 1974; Zetterberg and Larsson, 1991). The ability of cells to complete S phase, once initiated, protects against incomplete DNA replication and is thought to play an important role in maintaining genome stability (Henley and Dick, 2012; Matson and Cook, 2017). Cell-cycle progression depends on the inactivation of the retinoblastoma protein Rb, which critically inhibits the transcription factor E2F (Fisher, 2016; Malumbres and Barbacid, 2009; Matson and Cook, 2017; Sage et al., 2003). Our laboratory has previously demonstrated that the inactivation of APC/CCdh1 at the G1/S transition is bistable with respect to stress (Cappell et al., 2016, 2018), but how the regulation of Rb exhibits memory with respect to mitogens remains an open question of fundamental importance.
The ability of Rb to bind E2F is regulated by cyclin-dependent kinase (CDK) activity. Full phosphorylation of Rb (termed hyperphosphorylation) liberates E2F transcription factors and allows target gene expression. Mitogens induce the expression of cyclin D, the activating subunit of CDK4 and its close paralog CDK6 (hereafter CDK4/6), and CDK4/6 has been hypothesized to partially phosphorylate Rb, resulting in partial E2F activation. In turn, E2F activity induces the expression of cyclin E to activate CDK2. Finally, CDK2 has been proposed to complete the hyperphosphorylation of Rb in a self-sustaining positive feedback loop (Harbour et al., 1999; Lundberg and Weinberg, 1998; Merrick et al., 2011).
As mitogen removal has been shown to result in the loss of cyclin D1 expression (Matsushime et al., 1991), the CDK2-Rb feedback loop has been proposed to trigger a bistable switch that mediates irreversible Rb hyperphosphorylation, E2F activation, and CDK2 activation as a plausible mechanism to explain passage of the restriction point in G1 (Fisher, 2016; Matson and Cook, 2017). Although additional mechanisms of bistability have been proposed for sustaining E2F activity, including positive feedback from E2F autoregulation and Skp2 autoinduction (Johnson et al., 1994; Yung et al., 2007), irreversible Rb hyperphosphorylation would theoretically suffice to mediate irreversible E2F activity, and as such, the CDK2-Rb feedback loop remains the primary model explaining sustained Rb hyperphosphorylation and inactivation following the removal of mitogens. Nevertheless, reports conflict on the relationship between CDK2 and the restriction point (Ekholm et al., 2001; Hitomi et al., 2006; Schwarz et al., 2018), and the relationship between Rb, CDK4/6, CDK2, and the restriction point remain to be elucidated.
Several studies showed that cell-cycle signaling pathways exhibit significant plasticity, calling for refined working models. In particular, studies demonstrated substantial redundancy among CDK1, CDK2, and CDK3 in binding either E- or A-type cyclins (Aleem et al., 2005; Connell-Crowley et al., 1998; Kalaszczynska et al., 2009), while E- and A-type cyclins are also functionally redundant for DNA replication (Geng et al., 2003; Kalaszczynska et al., 2009). Nevertheless, cyclin A is normally degraded in G1 phase (Cappell et al., 2016; Peters, 2006), cyclin E and A preferentially bind CDK2 over CDK1 (Merrick et al., 2008), and CDK3 expression is thought to be very low in most cells (Meyerson et al., 1992). This argues that cyclin E-CDK2 is typically the main activity in G1 promoting the start of S phase. Nevertheless, cyclin E and A likely cooperate to activate CDK1, CDK2, and possibly CDK3 after G1. Additionally, as D-type cyclins have been shown to bind and activate CDK2 toward substrates traditionally associated with D-type cyclins but not E- or A-type cyclins (Malumbres et al., 2004), the relevant activity of the holoenzymes generated by cyclin E/A and CDK1/2/3 are perhaps best expressed as a function of the cyclins, and we will use the terms “cyclin E/A-CDK” and “CDK4/6” to describe the collective activities of these two types of active holoenzymes.
Here we investigate the regulation of Rb by CDK4/6 and cyclin E/A-CDK to elucidate the molecular basis for the restriction point. We find that cyclin E/A-CDK activity can indeed maintain Rb hyperphosphorylation following acute inhibition of CDK4/6, but only starting at the onset of S phase. Surprisingly, we show that CDK4/6 activity is required throughout G1 for cells to sustain Rb hyperphosphorylation and enter S phase, while cyclin E/A-CDK activity is dispensable for hyperphosphorylating Rb in G1. Consistently, cells crossing the restriction point continue to require CDK4/6 to sustain Rb hyperphosphorylation and enter the cell cycle. A rationale for the original cyclin E-CDK2-Rb feedback model was the observed rapid degradation of cyclin D1 following the loss of mitogens. However, we find that loss of cyclin D1 expression and CDK4/6 activity following mitogen removal in G1 is slow enough to sustain Rb hyperphosphorylation until S-phase entry in most, but not all cells. CDK4/6 activity following mitogen removal thus exhibits short-term memory, or transient hysteresis, with respect to mitogens, and Rb hyperphosphorylation in G1 does not require bistability or irreversibility previously associated with the restriction point. Consistently, we observe that mitogen removal in cells with hyperphosphorylated Rb and activated cyclin E/A-CDK results in a fraction of these cells eventually losing CDK4/6 activity, Rb hyperphosphorylation, and the ability to enter S phase. We thus conclude that the restriction point in G1 represents a probabilistic concept whereby, following mitogen removal, variable persistence in CDK4/6 activity enables some but not all cells to enter S phase, at which point cyclin E/A-CDK activity stably maintains Rb hyperphosphorylation to complete the cell cycle. Thus, CDK4/6 activity has a central role in controlling Rb hyperphosphorylation throughout G1, highlighting the relevance of altered CDK4/6 activity in proliferative pathologies such as cancer and aging.
RESULTS
Heterogeneity in Cyclin E/A-CDK Activity Obscures Regulatory Mechanisms of Rb Hyperphosphorylation in Bulk Cell Analysis
The model that positive feedback from cyclin E/A-CDK to Rb underlies an irreversible switch predicts that cyclin E/A-CDK activity can maintain Rb hyperphosphorylation independent of mitogens and CDK4/6 activity. This model can be translated into the testable prediction that a threshold activity level exists above which cyclin E/A-CDK activity can sustain Rb hyperphosphorylation upon acute inhibition of CDK4/6 (Figure 1A).
Figure 1. Heterogeneity in Cyclin E/A-CDK Activity Obscures Regulatory Mechanisms of Rb Hyperphosphorylation in Bulk-Cell Analysis.

(A) Schematic highlighting possible threshold or cell-cycle timing-dependent maintenance of Rb hyperphosphorylation by cyclin E/A-CDK following acute CDK4/6 inhibition.
(B) MCF-10A cells mitogen-released for indicated times prior to harvesting and western blot analysis. For 12 and 18 h time points, cells were treated with palbociclib 1 μM or vehicle (0.1% DMSO) for 15 min prior to harvesting.
(C) Schematic of cyclin E/A-CDK activity reporter.
(D) MCF-10A expressing cyclin E/A-CDK activity reporter and H2B-mTurquoise (for tracking) were mitogen-released and live-cell-imaged. Left: 50 random traces with automated detection of initial activation shown for illustration. Right: percentage of cells that have started to activate cyclin E/A-CDK by a given time since mitogen release. Error bars are SD; n = 3 replicates; n ≥ 105 cells per replicate.
Rb hyperphosphorylation has traditionally been detected using western blot. To analyze the effects of CDK4/6 inhibition on Rb hyperphosphorylation, we synchronized MCF-10A cells in quiescence by mitogen starvation, after which we stimulated cells with mitogens for different durations (hereafter mitogen release). To acutely inhibit CDK4/6, we added the CDK4/6-specific inhibitor palbociclib (Chen et al., 2016; Jorda et al., 2018; O’Leary et al., 2016) for just 15 min prior to harvesting for western blot analysis (Figure 1B). Here we observed that Rb hyperphosphorylation was achieved both 12 and 18 h after mitogen release, but acute CDK4/6 inhibition abolished hyperphosphorylation only for the 12 h condition. These results suggest that cells with hyperphosphorylated Rb do not necessarily have enough cyclin E/A-CDK activity to stably maintain the hyperphosphorylated state of Rb following acute CDK4/6 inhibition.
To assess the levels of cyclin E/A-CDK activity reached at the 12 and 18 h time points, we transduced MCF-10A cells with a previously characterized reporter that measures cyclin E/A-CDK activity and is believed to mostly reflect cyclin E-CDK2 activity before S phase in unperturbed conditions (Barr et al., 2016; Daigh et al., 2018; Gu et al., 2004; Hahn et al., 2009; Schwarz et al., 2018; Spencer et al., 2013) (Figure 1C). Consistent with previous results (Spencer et al., 2013), we observed that cells synchronized by mitogen starvation exhibit significant heterogeneity in the times at which cyclin E/A-CDK is activated, with a percentage of cells having activated cyclin E/A-CDK for a few hours by the 12 h time point and a larger percentage of cells having activated cyclin E/A-CDK for a longer period of time by the 18 h time point (Figure 1D). The cell-to-cell heterogeneity in cyclin E/A-CDK activation thus obscures the precise relationship between cyclin E/A-CDK and Rb hyperphosphorylation in bulk-cell analysis, arguing that single-cell analysis is needed to determine this relationship.
A Single-Cell Approach to Infer Rb Hyperphosphorylation
To overcome the issue of cell-to-cell heterogeneity in cyclin E/A-CDK activity, we sought to infer the hyperphosphorylated form of Rb by measuring Rb phosphorylation at the single-cell level. Such an analysis is challenging, as there are 15 putative CDK phosphorylation sites in Rb (Lee et al., 1998), and different Rb molecules in the same cell may be phosphorylated at different sites. Narasimha et al. (2014) demonstrated that Rb exists primarily in an unphosphorylated, stochastically monophosphorylated, or hyperphosphorylated form, with no evidence of intermediate or partially phosphorylated isoforms under unperturbed conditions. We therefore reasoned that antibodies against a specific phosphorylation site on Rb could be exploited to infer Rb hyperphosphorylation using quantitative single-cell analysis. This approach assumes that a cell in which most of the Rb protein is hyperphosphorylated has each specific CDK phosphorylation site phosphorylated on most copies of Rb, whereas a cell with monophosphorylated Rb has the same residue phosphorylated on only a small fraction of the Rb proteins, and a cell with unphosphorylated Rb has the same residue phosphorylated on almost none of the Rb proteins in the cell (Figure 2A). Using immunofluorescence to stain individual cells with phospho-specific Rb antibodies, one would therefore predict that cells with hyperphosphorylated Rb would show a much stronger signal than cells with unphosphorylated or monophosphorylated Rb.
Figure 2. A Single-Cell Approach to Infer Rb Hyperphosphorylation.

(A) Cartoon illustrating strategy for inferring Rb hyperphosphorylation by single-cell analysis of a phospho-specific antibody signal. The existence of primarily three different phosphorylation states of Rb predicts that cells with hyperphosphorylated Rb would specifically generate a high signal, distinct from the un- or mono-phosphorylated states.
(B) Cycling MCF-10A fixed and stained by immunofluorescence (IF) for Rb (regardless of phospho-status) and Rb(p-S807/S811) (scale bar, 20 μm). Nuclear intensities quantified, and single-cell ratios of Rb(p-S807/S811) over Rb calculated. Histogram is the distribution of these single-cell ratios normalized against the maximum observed ratio.
(C) Cycling MCF-10A harvested, blotted, and imaged using multiplex fluorescent antibody detection.
(D) MCF-10A fixed and iteratively stained by IF and eluted using 4i protocol (Gut et al., 2018). Each row shows representative images of cells stained for Rb, Rb(p-S807/S811), and the additional indicated phospho-antibody (scale bar, 20 μm). The normalized single-cell ratios of Rb(p-S807/S811) over Rb and the additional phospho-Rb antibody over Rb were calculated, and the single-cell correlations were plotted. n = 5,000 cells per scatterplot.
(E) MCF-10A mitogen-released and incubated with EdU 10 μM for 15 min prior to fixing and staining for normalized Rb(p-S807/S811). For each time point, n = 2,700 cells, and cells assigned to either the G1 (EdU-negative) or S (EdU-positive) histogram.
(F) MCF-10A mitogen-released in parallel to infer Rb hyperphosphorylation and Rb inactivation. Top: representative IF images of Rb following in situ extraction and fixing of mitogen-released cells (scale bar, 10 μm). Left: standard fixing and staining for normalized Rb(p-S807/S811) with percentages of cells with signal > 0.5 indicated (sensitivity analysis in Figure S2). Right: quantification of residual Rb following in situ extraction. Percentage of cells with low signal (inactivated Rb) indicated. Errors are SD; n = 3 replicates; n > = 11,000 cells per condition.
See also Figure S1.
We tested a phospho-antibody against Rb(p-S807/S811) as a potential single-cell marker for distinguishing cells with hyperphosphorylated Rb, on the basis of previous studies showing a statistical correlation between Rb(p-S807/S811) and E2F target gene expression (Cappell et al., 2016; Yang et al., 2017). We simultaneously stained cycling MCF-10A cells with small interfering RNA (siRNA)-validated antibodies against Rb(p-S807/S811) as well as against total Rb (regardless of phospho-status) to calculate a phosphorylation signal that is normalized against the Rb expression level in each cell (Figures 2B, S1A, and S1B). Using this ratiometric analysis, we observed a highly bimodal signal, raising the question of whether the upper peak of the normalized Rb(p-S807/S811) signal exclusively reflects the hyperphosphorylated state, or whether it also includes cells in the monophosphorylated state. We thus performed several critical tests to determine whether this single-cell normalized Rb(p-S807/S811) signal can be used to specifically infer whether a cell has most of its Rb hyperphosphorylated.
To test whether, at the protein level, the Rb(p-S807/S811) antibody detects hyperphosphorylated and not hypophosphorylated Rb, we performed western blot analysis on cycling MCF-10A cells with antibodies against both Rb(p-S807/S811) and Rb, and we monitored the two antibodies using multiplex fluorescent antibody detection (Figure 2C). Here we observed similar levels of Rb in both bands but much higher Rb(p-S807/S811) signal in the upper band. This result is consistent with the upper peak of the single-cell normalized Rb(p-S807/S811) signal specifically reflecting cells with hyperphosphorylated Rb.
To determine whether, in intact cells, the upper peak of the single-cell normalized Rb(p-S807/S811) signal excludes cells with primarily monophosphorylated Rb, we used iterative indirect immunofluorescence imaging (Gut et al., 2018) to sequentially stain cells with antibodies against Rb(p-S807/S811) as well as three other CDK phosphorylation sites, and we further stained cells with an antibody against Rb to normalize the phospho-signals (Figure 2D; method controls in Figures S1C–S1E). Here we observed that cells in the upper peak of the normalized Rb(p-S807/S811) signal were also in the upper peak of the normalized Rb(p-T373), Rb(p-S608), and Rb(p-S780) signals, consistent with the interpretation that the high normalized Rb(p-S807/S811) signal excludes cells with primarily monophosphorylated Rb. The bimodal distribution of the normalized Rb(p-S807/S811) signal suggests that individual cycling cells do not typically exhibit hyperphosphorylation of an intermediate fraction of Rb at steady state, and instead most Rb proteins in a single cell are either hyperphosphorylated or not. To additionally test whether the initial establishment of Rb hyperphosphorylation in cells exiting quiescence might occur in a graded fashion, we fixed and stained mitogen-released cells at different time points for normalized Rb(p-S807/S811), and we additionally incubated the cells with 5-ethynyl-2′-deoxyuridine (EdU) prior to fixation to identify cells actively replicating their DNA in S phase (Figure 2E). Here we observed a bimodal distribution of normalized Rb(p-S807/S811) from the earliest observed establishment of the signal, and the upper peak of this signal matched the upper peak observed in S phase, when maximal Rb hyperphosphorylation occurs, suggesting that the initial establishment of Rb hyperphosphorylation also occurs in an all-or-none manner. Together, these data are consistent with the interpretation that high normalized Rb(p-S807/S811) signal excludes cells with monophosphorylated Rb and specifically reflects a state where most of the Rb protein in a cell is hyperphosphorylated.
The inactivation of Rb has previously been shown to be associated with reduced binding of Rb to the nuclear compartment (Mittnacht and Weinberg, 1991). Concretely, in situ extraction of soluble proteins with a low-salt buffer results in the loss of hyperphosphorylated Rb and the retainment of nucleus-bound hypophosphorylated Rb. To test for a correlation between normalized Rb(p-S807/S811) and reduced nuclear binding, we performed in situ extraction and standard fixation in parallel experiments on mitogen-released cells (Figure 2F). Here we observed that the percentage of cells with low nuclear binding closely matched the percentage of cells with high normalized Rb(p-S807/S811) (we arbitrarily used a threshold of 0.5, though this percentage was relatively stable from 0.3 to 0.6; Figure S1F). These results are consistent with high normalized Rb(p-S807/S811) signal reflecting the hyperphosphorylated and inactive state of Rb. Taken together, these different measurements and controls suggest that in MCF-10A cells, a high normalized Rb(p-S807/S811) signal can be used to infer that most of the Rb proteins in an individual cell are hyperphosphorylated.
CDK4/6 Activity Is Continuously Required throughout G1 to Maintain Rb Hyperphosphorylation
Having established a means to infer Rb hyperphosphorylation at the single-cell level, we investigated the relationship between cyclin E/A-CDK activity and Rb hyperphosphorylation upon acute inhibition of CDK4/6. We first monitored cyclin E/A-CDK activity in cycling MCF-10A cells before treating cells with CDK4/6i for only 15 min, followed by fixing and staining for normalized Rb(p-S807/S811) (Figure 3A). Under control conditions, we observed low or high Rb(p-S807/S811) signals already at the lowest levels of cyclin E/A-CDK activity that could not be distinguished from background. Any measurable increase in cyclin E/A-CDK activity level was paralleled by an exclusively high Rb(p-S807/S811) signal. However, after acute CDK4/6 inhibition, there was a sharp transition, with cells maintaining high Rb(p-S807/S811) only when the activity of cyclin E/A-CDK exceeded a level of approximately 0.8. These data suggest that a threshold level of cyclin E/A-CDK activity must be reached for cells to maintain Rb hyperphosphorylation following acute CDK4/6 inhibition.
Figure 3. CDK4/6 Activity Is Continuously Required throughout G1 to Maintain Rb Hyperphosphorylation.

(A) Cycling MCF-10A expressing cyclin E/A-CDK activity reporter were live-cell-imaged and treated with CDK4/6i or vehicle for 15 min, followed by fixing andstaining for normalized Rb(p-S807/S811). Scale bar, 5 μm. Single-cell correlation of cyclin E/A-CDK activity just prior to drug treatment versus the resulting phospho-Rb signal. n = 7,000 cells per condition.
(B) Same cells as in (A) treated with EdU for 15 min prior to fixing. Scatterplot of cyclin E/A-CDK activity just prior to EdU treatment versus EdU incorporation.n = 20,000 cells.
(C) Same cells and assay as (A), except EdU included with 15 min drug treatment. Cells additionally stained with Hoechst and gated as shown in Figure S2A for G1 (green) or S (gold). Top: scatterplot of cyclin E/A-CDK activity just prior to drug treatment versus the resulting phospho-Rb signal. Bottom: same data for scatterplots binned by cyclin E/A-CDK activity. Error bars are SD; n = 8,000 cells per condition.
(D) Similar assay as (C), but in situ extraction performed prior to fixing and staining for Rb. n = 8,000 cells per condition.
(E) Cycling MCF-10A treated with indicated drugs + EdU for 15 min prior to fixing and staining for normalized Rb(p-S807/S811). CDK1/2i III 3 μM used. Cells stained for Hoechst and computationally gated by G1 (top) and S (bottom). Percentage of cells with normalized Rb(p-S807/S811) > 0.5 indicated. n > 2,318 cells per condition.
(F) Live-plus-fixed imaging with mRNA expression measured with RNA FISH, followed by computational gating for E/A = 0.8 ± 0.05 at the time of drug treatment.Scale bar, 10 μm. Fifty sample traces shown. n > 95 cells per condition; n = 4 biological replicates; error bars are SEM; two-sample t test: E2F1, p = 3.71E-3; CCNE1, p = 6.95E-3.
(G) Cycling MCF-10A expressing cyclin E/A-CDK activity reporter, APC/C degron reporter to report S-phase entry (see Figures S2G and S2H), and H2B-mTurquoise were live-cell-imaged and treated with vehicle or CDK4/6i for 12 h, then gated for E/A = 0.7 ± 0.05 and no increase in APC/C degron at time of drug treatment. High future E/A activity defined as > 1.2 after 12 h. High future APC/C deg defined as >100 after 12 h. Fifty sample traces shown. n > 83 cells per condition; n = 3 replicates; SD; two-sample t test: E/A, p = 2.36E-6; APC/C, p = 3.54E-6.
(H) Same experiment as (G), except cells gated for E/A = 0.9 ± 0.05 and rising APC/C degron at time of drug treatment. Fifty sample traces.
(I) Mitogen-released MCF-10A expressing cyclin E/A-CDK activity reporter live-imaged and treated with CDK2i III 60 μM for 2 h prior to fixing and staining for Rb(p-S807/S811). Cells gated for E/A = 0.8 ± 0.05 at time of drug treatment.
(J) Indicated MEFs expressing cyclin E/A-CDK activity reporter treated as shown and live-imaged. Scale bar, 40 μm. Fifty sample traces per condition shown.
Percentages of cells with E/A > 0.65 at 24 h. Errors are SD of n = 3 replicates.
(K) Same assay as (J), except cells released along with CDK4/6i or vehicle and harvested at indicated times for western blot. Hyperphosphorylation of Rb can be seen as an upper band in the 18 h control lanes. Representative of two replicates. Control/vehicle (DMSO), CDK4/6i (palbociclib) 1 μM, and EdU 10 μM wherever indicated.
See also Figure S2.
We next investigated whether the sharp transition in the ability of cyclin E/A-CDK to maintain Rb hyperphosphorylation corresponds to a specific point in the cell cycle. Here we noted that the level of cyclin E/A-CDK activity at which the transition occurs corresponds closely to the point at which DNA replication has previously been reported to begin (Spencer et al., 2013), and we confirmed these results by incubating cycling cells with EdU prior to fixation (Figure 3B). By including analysis of DNA content, as reflected by Hoechst staining, cells can be gated for G1, S, and G2 phases (Figure S2A). Treating cycling cells with CDK4/6i along with EdU, followed by fixing and staining for normalized Rb(p-S807/S811) and DNA content, we could isolate the single-cell relationship between cyclin E/A-CDK activity and Rb(p-S807/S811) in G1 versus S phase (Figure 3C). Here we found that upon acute CDK4/6 inhibition, cyclin E/A-CDK can only maintain high Rb(p-S807/S811) after the onset of S phase, contrary to prior assumptions that cyclin E-CDK2 is sufficient to sustain Rb hyperphosphorylation in G1. The inverse behavior occurred when comparing nuclear-bound Rb following in situ extraction (Figure 3D), arguing that a loss of Rb hyperphosphorylation in G1 translates to a rapid reactivation of Rb.
We observed similar phase-specific palbociclib sensitivity in hTERT-immortalized retinal pigment epithelial cells (RPE1), as well as passage-limited fibroblast (HS68) and human umbilical vein endothelial cells (HUVECs) (Figure S2B), suggesting that this is a regulatory principle exhibited across several human cell types. Addition of a CDK1/2 inhibitor abolished the palbociclib-resistant hyperphosphorylation in S phase, confirming that cyclin E/A-CDK sustains Rb hyperphosphorylation in S phase (Figure 3E). As a control, we observed the same phase-specific sensitivity of Rb(p-S807/S811) using two alternative CDK4/6 inhibitors (Figure S2C), suggesting that our results are indeed due to CDK4/6 inhibition. To additionally confirm that palbociclib does not have off-target effects on cyclin E/A-CDK activity, we sought to decouple any potential off-target inhibition of cyclin E/A-CDK from the expected on-target inhibition of E2F-mediated cyclin E expression due to the loss of Rb hyperphosphorylation. We first used a chemical stabilization system with DHFR-conjugated cyclin E1 that can be induced by the small molecule TMP, and we observed no effect of palbociclib on ectopically induced (Rb/E2F-independent) cyclin E-CDK activity in serumstarved cells (Figure S2D). To better match the acute conditions tested thus far, we also used cycling cells and acutely inhibited transcription with actinomycin D prior to palbociclib treatment, and we observed no additional effect of palbociclib on cyclin E/A-CDK activity (Figure S2E). These control experiments confirm the specificity of palbociclib (hereafter CDK4/6i) toward CDK4/6. Finally, Rb exhibited similar phosphorylation changes in response to ectopically induced cyclin E-CDK activity under long-term CDK4/6 inhibition (Figure S2F), consistent with in vitro results that cyclin E-CDK2 can directly hyperphosphorylate Rb (Connell-Crowley et al., 1997). Taken together, these results argue that CDK4/6 activity is continuously required throughout G1 to maintain Rb hyperphosphorylation, while cyclin E-CDK2 activity in G1 is insufficient on its own to sustain Rb hyperphosphorylation.
We next assessed the downstream functional consequences of acute CDK4/6 inhibition and loss of Rb hyperphosphorylation in G1. Using live-cell tracking of cyclin E/A-CDK activity followed by fixation and single-molecule RNA fluorescence in situ hybridization (FISH) analysis, we found that inhibition of CDK4/6 in cells with high cyclin E/A-CDK activity significantly inhibited expression of the E2F target genes E2F1 and CCNE1 (Figure 3F). This suggests that CDK4/6 activity is also continuously required throughout G1 to sustain E2F activity by keeping Rb inactive. In order to analyze the effects of acute CDK4/6 inhibition on longer term cell-cycle progression, we transduced MCF-10A cells with both the cyclin E/A-CDK activity reporter fused to mVenus and the APC/C degron reporter fused to mCherry to mark the G1/S transition (Sakaue-Sawano et al., 2008) (Figures S2G and S2H). Inhibition of CDK4/6 in cells with activated cyclin E/A-CDK prior to APC/CCdh1 inactivation significantly inhibited further cyclin E/A-CDK activation as well as future APC/CCdh1 inactivation (Figure 3G). Conversely, inhibition of CDK4/6 just after APC/CCdh1 inactivation did not block further cyclin E/A-CDK activation (Figure 3H). These results suggest that cells are normally dependent on CDK4/6 activity throughout G1 in order to enter S phase, after which cyclin E/A-CDK is sufficient to stably maintain Rb hyperphosphorylation and cell-cycle progression.
We noted that in addition to cyclin E/A-CDK activity, there is likely another event at the onset of S phase that potentiates cyclin E/A-CDK activity toward Rb, as equivalent levels of cyclin E/A-CDK activity (specifically 0.8–0.9) in G1 and S vary in their ability to sustain Rb hyperphosphorylation (Figures 3C and 3D). To test whether S-phase entry potentiates cyclin E/A-CDK activity toward Rb, we accelerated APC/CCdh1 inactivation by knocking down Cdh1. Cdh1 knockdown resulted in earlier S-phase entry (as measured by EdU incorporation) for a given level of cyclin E/A-CDK activity (Figure S2I), as well as greater CDK4/6-independent Rb hyperphosphorylation for a given level of cyclin E/A-CDK activity (Figure S2J). These results suggest that an event at the G1/S transition potentiates cyclin E/A-CDK activity toward Rb.
Although we showed that cyclin E/A-CDK activity levels in G1 are typically insufficient to hyperphosphorylate Rb in the presence of CDK4/6 inhibitors, it remained unclear whether a low level of cyclin E/A-CDK is necessary to hyperphosphorylate Rb. We thus inhibited cyclin E/A-CDK with a CDK2 inhibitor and were surprised to observe no inhibition of Rb hyperphosphorylation (Figure 3I), suggesting that cyclin E-CDK2 activity is not required to sustain Rb hyperphosphorylation. To test for a requirement of either E- or A-type cyclins, we used a CreLox system to conditionally abolish all E- and A-type cyclins in mitogen-released mouse embryonic fibroblasts (MEFs). Control experiments showed that the knockout extinguished cyclin E/A-CDK activity (Figure 3J), yet we still observed CDK4/6-dependent Rb hyperphosphorylation to a similar degree as for the unfloxed condition. Furthermore, the E2F target Cdc6 was still expressed in a CDK4/6-dependent manner in the absence of E- and A-type cyclins (Figure 3K). Similar results were also observed following acute CDK4/6 inhibition under continuous growth conditions (Figure S2K). Taken together, these results are consistent with an interpretation that cyclin E/A-CDK activity is not required to sustain or substantially trigger Rb hyperphosphorylation in G1, while CDK4/6 is required to hyperphosphorylate Rb during this time window.
CDK4/6 Activity following Mitogen Removal in G1 Sustains Rb Hyperphosphorylation and Cell-Cycle Progression
We next investigated the relationship among cyclin E/A-CDK, CDK4/6, and the restriction point. To analyze the temporal relationship between cyclin E/A-CDK activity and the restriction point, we performed live-cell imaging of mitogen-released cells transduced with the cyclin E/A-CDK activity reporter and the APC/C degron reporter. We then withdrew mitogens at various times following mitogen release to monitor the percentage of cells that would subsequently enter the cell cycle as indicated by inactivation of APC/CCdh1 (Figure 4A). Here we observed that passage of the restriction point showed little temporal correlation with activation of cyclin E/A-CDK, challenging the hypothesis that cyclin E-CDK2 has a functional role in mediating passage of the restriction point. Indeed, early mitogen removal, when most cells have low cyclin E/A-CDK activity, still resulted in a substantial percentage of cells entering the cell cycle (Figure 4A). Conversely, although most cells with high cyclin E/A-CDK activity were past the restriction point, the majority of these cells were still dependent on CDK4/6 to sustain cell-cycle progression (Figure 4B), demonstrating the continued requirement for CDK4/6 to mediate passage of the restriction point. Consistent with a role for Rb in cells crossing the restriction point, cells exhibited marked hysteresis, or memory, in Rb hyperphosphorylation following extended mitogen removal, and this sustained hyperphosphorylation was inhibited by CDK4/6i treatment (Figure 4C). These data suggest that cells cross the restriction point by sustaining CDK4/6-mediated hyperphosphorylation of Rb until the G1/S transition.
Figure 4. CDK4/6 Activity following Mitogen Removal in G1 Sustains Rb Hyperphosphorylation and Cell-Cycle Progression.

(A) MCF-10A expressing cyclin E/A-CDK activity reporter and APC/C degron reporter. Left: 50 sample traces with automated detection of E/A activation and APC/C inactivation illustrated. Middle: 50 sample traces when mitogen removed 6 h after release. High future E/A activity (green traces) defined as >1.0 at 24 h post-release. High future APC/C deg (green traces) defined as increasing >10 a.u. from drug treatment to 24 h post-release. Error is SD of n = 3. Right: percentage of cells with E/A-on (green) or APC/C-off (orange) since mitogen release. In parallel, mitogens removed at various times following mitogen release, and the percentage of cells that will eventually inactivate APC/C by 24 h post-mitogen release is shown (black). Error bars are SD; n > 580 cells per condition; n = 3 replicates.
(B) Similar assay as (A), with cells gated for E/A = 0.8 ± 0.05 at the time of perturbation. Error bars are SEM; n > 35 cells per condition; n = 3 replicates; two-sample t test: E/A, p = 1.92E-4; APC/C, p = 8.34E-4.
(C) MCF-10A treated as illustrated and stained for normalized Rb(p-S807/S811). For 12+4/6i condition, cells treated 12 h post-release with CDK4/6i for 15 min prior to fixing. Representative histograms shown. Percentage of cells with normalized Rb(p-S807/S811) signal > 0.5 calculated. Error bars are SD of n = 3 replicates; n > 8,908 cells per condition. CDK4/6i (palbociclib) 1 μM wherever indicated.
See also Figure S3.
We next assessed whether G1 cyclin E/A-CDK activity confers at least a marginal reduction in CDK4/6-dependence for Rb phosphorylation by measuring sensitivity to CDK4/6i in the initial establishment of Rb hyperphosphorylation versus acute CDK4/6i treatment in cells with high cyclin E/A-CDK activity prior to APC/CCdh1 inactivation (Figure S3A). Here we observed little difference in CDK4/6i sensitivity, arguing that cyclin E/A-CDK activity does not contribute to the observed hysteresis in Rb hyperphosphorylation following mitogen removal. Taken together, our results challenge the classic hypothesis of a cyclin E-CDK2-Rb feedback loop underlying the restriction point and instead support a novel hypothesis in which CDK4/6 activity following mitogen removal sustains Rb hyperphosphorylation and passage of the restriction point in G1.
Transient Hysteresis in CDK4/6 Activity following Mitogen Removal Underlies Probabilistic Passage of the Restriction Point
A model where CDK4/6 activity sustains Rb hyperphosphorylation and cell-cycle progression following mitogen removal appears contrary to earlier observations that cyclin D1 is rapidly degraded following a loss of mitogens (Matsushime et al., 1991). However, we previously measured the half-life of cyclin D1 protein following mitogen removal to be over 3 h long, in part because of longer lived cyclin D1 mRNA (Yang et al., 2017), raising the possibility that cyclin D1 is degraded slowly enough to sustain CDK4/6 activity in cells crossing the restriction point. Consistently, the same conditions that resulted in sustained Rb hyperphosphorylation showed reduced yet residual cyclin D1 protein 4 h after mitogen removal (Figure 5A and siRNA validation in Figure S4A). Immunoprecipitation of ectopically expressed CDK6 (Figure 5B) or CDK4 (Figure S4B) confirmed reduced but residual bound cyclin D1, as well as reduced but residual kinase activity. These data suggest that mitogen removal results in a loss of CDK4/6 activity that occurs slowly enough to sustain Rb hyperphosphorylation and cell-cycle progression in cells crossing the restriction point. Thus, it is short-term memory, or transient hysteresis, in CDK4/6 activity following mitogen removal that underlies sustained Rb hyperphosphorylation and passage of the restriction point in G1.
Figure 5. Transient Hysteresis in CDK4/6 Activity following Mitogen Removal Underlies Probabilistic Passage of the Restriction Point.

(A) MCF-10A treated as illustrated and stained and quantified for nuclear cyclin D1 expression. Scale bar, 25 μm. Representative of n = 3 replicates.
(B) MCF-10A expressing 3xFLAG-CDK6 treated as in (A) and harvested at the indicated times for IP and IP-kinase measurement of cyclin D1 binding and phosphorylation of a GST-Rb fragment (see STAR Methods). Representative of two replicates.
(C) MCF-10A transduced with cyclin E/A-CDK activity reporter and APC/C degron reporter were mitogen-released and live-cell-imaged for 24 h. Mitogens removed at 10 h time point, and cells computationally gated for E/A = 0.7 ± 0.05 at the time of mitogen removal (MR). Fifty sample traces shown for clarity. Percentage of cells with E/A > 1.0 (right, top) or APC/C increase > 25 a.u. (right, bottom) at 24 h post-release. Error bars are SEM; n > 35 cells per condition; n = 3 replicates; two-sample t test: E/A full growth media (FGM), p = 1.76E-3; EGF only, p = 8.94E-3; APC/C FGM, p = 1.03E-2; EGF, p = 6.25E-3.
(D) Similar experiment as (C), but cells immediately fixed or tracked for another 2 or 4 h prior to fixing and staining to calculate percentage of cells with normalizedRb(p-S807/S811) signal > 0.5. Error bars are SEM; n > 70 cells per condition; n = 3 replicates; two-sample t test: FGM 0 versus 2 h MR, p = 9.99E-1; 0 versus 4 h MR, p = 2.55E-2; 2 h mock versus 2 h MR, p = 7.05E-1; 4 h mock versus 4 h MR, p = 4.19E-2; EGF 0 versus 2 h MR, p = 5.7E-2; 0 versus 4 h MR, p = 1.19E-2; 2 h mock versus 2 h MR, p = 5.22E-2; 4 h mock versus 4 h MR, p = 1.95E-2.
(E) Same assay as (D) but MCF-10A also expressing inducible degron DHFR fused to cyclin D1 and stabilizing molecule TMP 5 μM added at time of mitogen removal. EGF only. n > 120 cells per condition; n = 3 replications; two-sample t test: 0 versus 4 h mock, p = 5.94E-1; 0 versus 4 h MR, p = 1.95E-3; 0 versus 4 h TMP, p = 4.99E-1; 4 h mock versus 4 h MR, p = 9.67E-3; 4 h mock versus 4 h TMP, p = 3.42E-1; 4 h MR versus 4 h TMP, p = 1.40E-3.
(F) Model for restriction point passage in G1. Transient hysteresis in CDK4/6 activity following mitogen removal results in stochastic maintenance of Rb hyperphosphorylation to mediate probabilistic passage of the restriction point in G1, after which cyclin E/A-CDK stably maintains Rb hyperphosphorylation to complete the cell cycle.
See also Figure S4.
CDK4/6 activity is required for cells past the restriction point to complete S-phase entry (Figure 4B). Transient hysteresis in CDK4/6 activity following mitogen removal thus reflects a reversible process underlying cell-cycle commitment, contrary to current models of the restriction point. We therefore predicted to observe a degree of reversibility in cell-cycle commitment whereby, even in cells with activated cyclin E/A-CDK, mitogen removal might cause some cells to exit the cell cycle. Consistently, mitogen removal in cells with activated cyclin E/A-CDK prevented a fraction of cells from sustaining cyclin E/A-CDK activity or inactivating APC/CCdh1 (Figure 5C). A model in which transient hysteresis in CDK4/6 accounts for this observed cell-cycle reversibility also raised the possibility that different growth factor stimuli would confer varying degrees of hysteresis in CDK4/6 activation. Thus far, the full growth MCF-10A media used to release cells from quiescence or maintain cycling cells has contained a combination of EGF, insulin, and adult horse serum. Withdrawal of a simplified stimulus containing only EGF as a source of mitogens resulted in a larger drop in the percentage of cells entering the cell cycle, consistent with reduced hysteresis in CDK4/6 activity (Figure 5C). Stochastic loss of CDK4/6 activity prior to reaching S phase should result in loss of Rb hyperphosphorylation. To test for this, we performed live-cell analysis followed by fixing and staining for normalized Rb(p-S807/S811) at variable times following mitogen removal (Figure 5D). Here we observed an eventual loss in the percentage of cells with hyperphosphorylated Rb after mitogen removal and a much greater loss following removal of EGF stimulus alone. This loss of Rb hyperphosphorylation was rescued by ectopic induction of cyclin D1 at the time of mitogen removal (Figure 5E). Taken together, these results suggest that transient hysteresis in CDK4/6 activity following mitogen removal underlies stochastic loss of Rb hyperphosphorylation and cell-cycle exit, while cells that reach S phase are able to stably sustain Rb hyperphosphorylation and cyclin E/A-CDK activity (Figure 5F). Cells thus remain intrinsically sensitive to growth factors throughout G1, arguing that a probabilistic signaling system, rather than a discrete and irreversible event, underlies the restriction point.
DISCUSSION
We use single-cell analyses to define the regulatory principles governing Rb hyperphosphorylation and elucidate the mechanisms underlying the restriction point. The molecular basis of the restriction point, although a subject of debate, has most commonly been attributed to a feedback loop from cyclin E-CDK2 to Rb early in G1. Our results now demonstrate that such a feedback does not engage until the onset of S phase and that E- and A-type cyclins are not required for Rb hyperphosphorylation. As shown in our acute CDK4/6 inhibition experiments, CDK4/6 activity is instead continuously required for Rb hyperphosphorylation in G1, highlighting the importance of mechanisms regulating CDK4/6 activity. Our results suggest that the use of CDK4/6 inhibitors as a cancer therapeutic can block Rb phosphorylation and cell-cycle entry throughout G1 phase, implying that resistance mechanisms must achieve alternative means of initiating the principal cell-cycle entry steps of Rb inactivation, cyclin E-CDK2 activation, and APC/CCDH1 inactivation.
The transition to CDK4/6-independent maintenance of Rb hyperphosphorylation does not occur until the onset of S phase, at which point cyclin E/A-CDK stably maintains Rb hyperphosphorylation. Notably, a high level of cyclin E/A-CDK activity is required for DNA replication, and cyclin D or CDK4/6 activity alone cannot replace cyclin E/A-CDK in starting S phase (Daigh et al., 2018; Kalaszczynska et al., 2009). Although the levels of cyclin E/A-CDK activity achieved in S phase are critical to sustain CDK4/6-independent Rb hyperphosphorylation, we also found evidence that additional regulatory mechanisms must exist that potentiate cyclin E/A-CDK activity toward Rb at the transition to S phase. Overall, the different mechanisms underlying the cyclin E/A-CDK feedback loop are likely critical for maintaining genome stability once cells initiate DNA replication.
Our study confirms that cells exiting quiescence can transition to mitogen independence in G1 several hours before S-phase entry. This transition has previously been thought to represent a singular irreversible event and was termed the restriction point. Our study instead uncovers a reversible process whereby a gradual loss of CDK4/6 activity following mitogen removal sustains Rb hyperphosphorylation long enough for most cells to reach S phase. Nevertheless, a significant fraction of cells loses CDK4/6 activity and Rb hyperphosphorylation prior to reaching S phase and consequently exits the cell cycle. Our results thus suggest that the restriction point is more accurately described as a probabilistic process whereby variable persistence in CDK4/6 activity dictates whether cells execute cell-cycle commitment. Our results also suggest that the degree of hysteresis in CDK4/6 activity varies with different growth factor stimuli, raising the possibility that hysteresis in CDK4/6 activity following mitogen removal is modulated and that different cellular niches tune this key factor to control the probability of cell-cycle commitment.
STAR★METHODS
LEAD CONTACT AND MATERIALS AVAILABILITY
Further information and requests for resources and reagents should be directed to and will be fulfilled by the Lead Contact, Tobias Meyer (tobias1@stanford.edu).
EXPERIMENTAL MODEL AND SUBJECT DETAILS
All experiments were done using MCF-10A human mammary epithelial cells (ATCC, #CRL-10317) unless otherwise noted. Unless otherwise noted, MCF-10A cycled or were released in the following full-growth media: phenol red-free DMEM/F12 (Invitrogen) supplemented with 5% horse serum, 20 ng/mL EGF, 10 μg/mL insulin, 500 μg/mL hydrocortisone, 100 ng/mL cholera toxin, and 50 U/mL penicillin and 50 μg/mL streptomycin (1% P/S). MCF-10A starvation media consisted of DMEM/F12 plus 0.3% BSA w/v, 500 μg/mL hydrocortisone, 100 ng/mL cholera toxin. When EGF alone was used for mitogen release, starvation media was supplemented with EGF at the concentration used for growth media. HS68 primary human foreskin fibroblasts (ATCC, #CRL-1635) were cultured in DMEM plus 10% FBS and 1% P/S. HUVEC human umbilical vein endothelial cells (Lonza, C2519A) were cultured in an EGM2 (Lonza, CC-3162) kit. RPE1-hTERT human retinal pigment epithelial cells (ATCC, #CRL-4000) were cultured in DMEM:F12 plus 10% FBS and 0.01 mg/mL hygromycin B. Immortalized cyclin E1–/–E2–/–A1–/–A2f/f MEFs were cultured in DMEM plus 10% FBS and 1% P/S and starved in DMEM plus 0.3% BSA. All cells tested negative for mycoplasma.
METHOD DETAILS
Cell Culture
All experiments were done using MCF-10A human mammary epithelial cells (ATCC, #CRL-10317) unless otherwise noted. Unless otherwise noted, MCF-10A cycled or were released in the following full-growth media: phenol red-free DMEM/F12 (Invitrogen) supplemented with 5% horse serum, 20 ng/mL EGF, 10 μg/mL insulin, 500 μg/mL hydrocortisone, 100 ng/mL cholera toxin, and 50 U/mL penicillin and 50 μg/mL streptomycin (1% P/S). MCF-10A starvation media consisted of DMEM/F12 plus 0.3% BSA w/v, 500 μg/mL hydrocortisone, 100 ng/mL cholera toxin. When EGF alone was used for mitogen release, starvation media was supplemented with EGF at the concentration used for growth media. HS68 primary human foreskin fibroblasts (ATCC, #CRL-1635) were cultured in DMEM plus 10% FBS and 1% P/S. HUVEC human umbilical vein endothelial cells (Lonza, C2519A) were cultured in an EGM2 (Lonza, CC-3162) kit. RPE1-hTERT human retinal pigment epithelial cells (ATCC, #CRL-4000) were cultured in DMEM:F12 plus 10% FBS and 0.01 μg/mL hygromycin B. Immortalized cyclin E1–/–E2–/–A1–/–A2f/f MEFs were cultured in DMEM plus 10% FBS and 1% P/S and starved in DMEM plus 0.3% BSA. All cells tested negative for mycoplasma.
Constructs and stable cell lines
MCF-10A cells were transduced with lentiviral vectors encoding CSII-pEF1a-H2B-mTurquoise, CSII-pEF1a-DHB(aa994–1087)-mVenus, and CSII-pEF1a-mCherry-Geminin(aa1–110) as described previously (Cappell et al., 2016; Spencer et al., 2013). DHFR-mCherry-cyclin E1 was cloned into a pCru5 retroviral vector and transduced into MCF-10A cells expressing the H2B-mTurquoise and DHB-mVenus constructs described above. DHFR-cyclin D1-IRES-puro was cloned into a pCru5 retroviral vector and transduced into MCF-10A cells expressing the H2B-mTurquoise, DHB-mVenus, and mCherry-Geminin constructs. Cyclin E1–/–E2–/–A1–/–A2f/f MEFs were transduced with the H2B-mTurquoise and DHB-mVenus constructs and were subsequently transduced with a retroviral vector encoding pCru5-DHFR-Cre.
Immunofluorescence
Cells were fixed in 4% paraformaldehyde. Pre-extraction protocol was as described previously (Håland et al., 2015), but rather than trypsinizing and FACS, pre-extraction and fixing were performed with the 96-well plate on an ice block. Iterative indirect immunofluorescence imaging (4i) performed as previously described (Gut et al., 2018). Primary antibodies were visualized using a secondary antibody conjugated to Alexa Fluor-488, −568, or −647. For assays involving EdU staining, cells were treated with 10μM EdU (Thermo #A10044) for the specified time, then fixed and processed with azide-modified Alexa Fluor 647 according to manufacturer’s instructions (Invitrogen, #C10269). In the case where cells expressed fluorescent reporters that limited the use of fluorophores, cells were chemically bleached (Lin et al., 2015) and imaged to confirm complete removal of fluorescence prior to performing IF, EdU click reaction, or Hoechst (Thermo #H3570) staining. Spectral crosstalk or bleed-through quantified by imaging single fluorophores and corrected during image analysis.
Antibodies
α-Rb (Cell Signaling Technology, #9309) validated by knockdown, α-Rb (BD Biosciences #554136) validated by knockout (Sage et al., 2000), α-Rb(p-S807/811) (CST #8516) cross-validated against Rb(p-S608) and Rb(p-S780) peptides by manufacturer, α-Rb(p-T373) (Abcam #ab52975), α-Rb(p-S608) (CST #2181), α-Rb(p-S780) (BD #558385), α-cyclin D1 (Thermo Scientific RM9104-S0), α-Cyclin A (sc-596), α-Cdc6 (sc-9964), α-actin (Millipore #MAB1501), α-GAPDH (CST #5174), α-FLAG (Sigma-Aldrich F3165).
RNA FISH
RNA in situ hybridization was carried out using the Affymetrix Quantigene ViewRNA ISH cell assay. Briefly, cells were fixed in 4% paraformaldehyde and permeabilized with 0.2% Triton TX-100 in PBS for 20min at 4’C. Cells were then incubated with probes specific for E2F1 or CCNE1, which were then amplified by three rounds of branched DNA hybridization that included labeling with fluorescent probes excitable at 550nm. As this assay was used following live-cell imaging (Figure 3F), the nuclear marker H2B-mTurquoise was used to identify nuclei and estimate cellular boundaries (see Image Analysis below). While thousands of cells were stained per well, only cells with desired live-cell cyclin E/A-CDK activity dynamics were gated in silico, resulting in the mRNA being quantified in at least 96 cells per replicate.
Inhibitors
Palbociclib (PD-0332991) (Selleck Chem S1116), CDK1/2i III (EMD #217714), Ribociclib (LEE011) (S7440), Abemaciclib (LY2835219) (SC S7158), CDK2i III (EMD 238803), Actinomycin D (Sigma-Aldrich A1410).
Western Blot
Cells were plated in a 60mm diameter cell culture dish. At the time of harvest, cells were washed once with cold PBS prior to addition of 100μl 1x Laemmli buffer (diluted from 6x stock: 0.375M Tris pH 6.8, 12% SDS, 60% glycerol, 0.6M DTT, 0.06% Bromophenol blue), then scraped off the plate. Membrane and DNA were sheared using a 25G (0.5mm) insulin syringe, and protein was further denatured at 90C for 4min. Samples were separated by SDS-PAGE using Tris-Glycine gels (Bio-Rad #4561026) and Tris-Glycine SDS running buffer (Bio-Rad, #161–0772). The protein was then blotted onto PVDF membranes (EMD Millipore, #IPFL00010) by semi-dry transfer (Bio-Rad trans-blot SD. Semi-Dry Transfer Cell) in Tris-Glycine + 10% methanol (Bio-Rad 1610734). The membrane was then washed with TBST and blocked in TBST + 5% milk. Membranes were blotted with antibodies in TBST + 5% BSA + 0.01% NaN3, then stained with secondary antibodies conjugated to HRP and incubated with chemiluminescent substrate (Thermo Scientific #34580) prior to exposing to film. For multiplex fluorescent antibody detection (Figure 2C), membranes were blocked in TBS + 5% milk, similarly blotted with primary antibodies, then stained with the secondaries Alexa Fluor-680 and 800 and scanned using an Odyssey Infrared Imaging System (LI-COR Biosciences).
IP and IP-Kinase
Cells were plated in a 100mm diameter cell culture dish. At the time of harvest, cells were washed once with cold PBS prior to addition of 225ul lysis buffer (50mM HEPES pH 7.5, 150mM NaCl, 1mM EDTA, 2.5mM EGTA, 10% glycerol, 0.1% Tween-20) including PhosSTOP (Sigma-Aldrich 4906837001), 1mM DTT, and EDTA-free Halt Protease Inhibitor Cocktail (Thermo Fisher Scientific 78439). Cells were lysed on ice for 30min with occasional vortexing, then centrifuged at 10,000 g for 10min at 4C. Supernatant was taken for both IP (300ul) and input (30ul). Input was denatured by addition of 6x Laemmli buffer and boiled. IP was performed by incubation with anti-FLAG magnetic beads (Sigma-Aldrich M8823) for 30min at 4C, then washed 3×800ul lysis buffer and 2×800ul 50mM HEPES pH 7.5 + 1mM DTT. Kinase assay performed by resuspending in 30μl kinase reaction buffer (50mM HEPES pH 7.5, 10mM MgCl2, 2.5mM EGTA, 1mM DTT, 50μM ATP (Cytoskeleton #BSA04), 1μg GST-RbC (sc-4112)) and incubated at 37°C for 30min with continuous agitation. IP and substrate were denatured by adding 6x Laemmli buffer and boiling. Westerns were performed as above, and kinase activity was determined by blotting for Rb(p-S807/S811), secondary HRP amplification, reaction with chemiluminescent substrate (Thermo Fisher Scientific #34080), and film exposure.
siRNA Transfection
Cells were transfected using Dharmafect 1 Transfection Reagent (Thermo Scientific T-2001) according to the manufacturer’s instructions. The following siRNAs were used: control: Dharmacon On-Target-Plus Control pool (D-00180–10-05) 20nM, RB1: Dharmacon siGENOME pool 20nM, CDH1: Dharmacon siGENOME pool 20nM, CCND1: Dharmacon siSMART pool 20nM.
Microscopy
Images were taken on an IXMicro microscope (Molecular Devices). 10X objective (0.3 N.A.) with no binning used for live-cell imaging and fixed-cell IF imaging. 20X objective (0.75 N.A.) with 2-by-2 pixel binning for imaging RNA FISH staining. For live-cell imaging, images taken every 12 or 15min, and total light exposure time was kept under 600ms for each time point. Cells were imaged in a humidified, 37°C chamber in 5% CO2.
QUANTIFICATION AND STATISTICAL ANALYSIS
Image Analysis
All image analyses were performed with custom MATLAB scripts as previously described (Cappell et al., 2016). Briefly, optical illumination bias was empirically derived by sampling background areas across all wells in an imaging session and subsequently used to flatten all images. This enabled measurement and subtraction of a global background for each image. Cells were segmented for their nuclei based on either Hoechst staining (fixed-cell imaging) or H2B-mTurquoise (live-cell imaging). For DHB-mVenus measurements, cells were segmented for their cytoplasmic regions by spatially approximating a ring with an inner radius of 2μm outside of the nuclear mask and an outer radius a maximum of 10μm outside of the nuclear mask. Regions within 10μm of another nucleus were excluded. For RNA FISH measurements, cells were segmented for their whole-cell regions by spatially approximating an area encompassing the nucleus and reaching as far as 50μm outside of the nuclear mask without overlapping other cell regions. For signal measurement: DNA content was calculated as the sum nuclear Hoechst intensity. EdU signal was calculated as the mean nuclear EdU intensity. Nuclear immunofluorescence, nuclear DHB-mVenus, and mCherry-Geminin signals were calculated as median nuclear intensity, as these signals were often excluded from the nucleoli. Cytoplasmic DHB-mVenus signals were calculated as the median intensity within the cytoplasmic ring, excluding pixel intensities indistinguishable from background. RNA FISH was quantified as follows: a foreground mask of FISH puncta was generated by top hat-filtering the raw image with a circular kernel of radius 4μm and thresholding on absolute intensity. RNA puncta count was calculated as the number of foreground pixels within a given whole-cell region.
Statistical Analysis
Statistical analyses were performed by 2-sample t test, with quantifications represented as mean ± standard deviation or SEM as specified in figure legends. P value asterisk convention: * = p < 0.05, ** = p < 0.01, and *** = p < 0.001. Further statistical details of experiments can be found in the figure legends.
DATA AND CODE AVAILABILITY
Original data for immunoblot scans and representative microscopy images are available at Mendeley Data under the following link: https://doi.org/10.17632/85ft6ssw5x.1. The code for the image analysis pipeline is available at https://github.com/scappell/Cell_tracking. Additional modified scripts are available from the Lead Contact upon reasonable request.
Supplementary Material
KEY RESOURCES TABLE.
| REAGENT or RESOURCE | SOURCE | IDENTIFIER |
|---|---|---|
| Antibodies | ||
| α-Rb mouse mAb [4H1] | Cell Signaling Technology | Cat#9309, RRID:AB_823629 |
| α-RB mouse mAb [G3-245] | BD Biosciences | Cat#556538, RRID:AB_396458 |
| α-Rb(p-S807/S811) rabbit mAb [D20B12] | Cell Signaling Technology | Cat#8516, RRID:AB_11178658 |
| α-Rb(p-T373) rabbit mAb [EP821Y] | Abcam | Cat#ab52975, RRID:AB_2177344 |
| α-Rb(p-S608) rabbit pAb | Cell Signaling Technology | Cat#2181, RRID:AB_331517 |
| α-Rb(p-S780) mouse mAb [J146-35] | BD Biosciences | Cat#558385, RRID:AB_647294 |
| α-cyclin D1 rabbit mAb [SP4] | Thermo Scientific | Cat#RM-9104-S0, RRID:AB_149914 |
| α-cyclin A rabbit pAb [C-19] | Santa Cruz Biotechnology | Cat#sc-596, RRID:AB_631330 |
| α-Cdc6 mouse mAb [180.2] | Santa Cruz Biotechnology | Cat#sc-9964, RRID:AB_627236 |
| α-actin mouse mAb [C4] | Millipore | Cat#MAB1501, RRID:AB_2223041 |
| α-GAPDH rabbit mAb | Cell Signaling Technology | Cata#5174, RRID:AB_10622025 |
| α-FLAG mouse mAb [M2] | Sigma-Aldrich | Cat#F3165, RRID:AB_259529 |
| Chemicals, Peptides, and Recombinant Proteins | ||
| CDK1/2i III | EMD Millipore | Cat#217714, CAS#443798-55-8 |
| Ribociclib | Selleckchem | Cat#S7440, CAS#1211441-98-3 |
| Abemaciclib | Selleckchem | Cat#S7158, CAS#1231929-97-7 |
| CDK2i III | EMD Millipore | Cat#238803, CAS#199986-75-9 |
| Actinomycin D | Sigma-Aldrich | Cat#A1410, CAS#50-76-0 |
| Trimethoprim | Cayman Chemical | Cat#16473, CAS#738-70-5 |
| PhosSTOP phosphatase inhibitor cocktail | Sigma-Aldrich | Cat#4906837001 |
| EDTA-free Halt Protease Inhibitor Cocktail | Thermo Fisher Scientific | Cat#78439 |
| ATP | Cytoskeleton | Cat#BSA04, CAS#34369-07-8 |
| GST-RbC (769) | Santa Cruz Biotechnology | Cat#sc-4112 |
| Chemiluminescent Substrate | Thermo Fisher Scientific | Cat#34080 |
| Hoechst 33342, Trihydrochloride, Trihydrate | Thermo Fisher Scientific | H3570, CAS#23491-52-3 |
| EdU (5-ethynyl-2′-deoxyuridine) | Thermo Fisher Scientific | A10044 |
| Palbociclib | Selleckchem | Cat#S1116, CAS#571190-30-2 |
| Critical Commercial Assays | ||
| Click-iT Cell Reaction Buffer Kit | Thermo Fisher Scientific | Cat#C10269 |
| Deposited Data | ||
| Raw scans and images | Mendeley Data | https://doi.org/10.17632/85ft6ssw5x.1 |
| Experimental Models: Cell Lines | ||
| Human: HS68 | ATCC | Cat#CRL-1635, RRID:CVCL_0839 |
| Human: HUVEC | Lonza | Cat#C2519A |
| Human: RPE1-hTERT | ATCC | Cat#CRL-4000, RRID:CVCL_4388 |
| Mouse: E1−/−E2−/−A1−/−A2f/f MEF | Kalaszczynska et al., 2009. | N/A |
| Human: MCF-10A | ATCC | Cat#CRL-10317, RRID:CVCL_0598 |
| Oligonucleotides | ||
| non-targeting siRNA (negative control) | Dharmacon | Cat#D-00180-10-05 |
| RB1 siRNA | Dharmacon | siGENOME pool |
| CDH1 siRNA | Dharmacon | siGENOME pool |
| siRNA CCND1 | Dharmacon | siSMART pool |
| RNA FISH probe for E2F1 | Affymetrix | Cat#VX-06 |
| RNA FISH probe for CCNE1 | Affymetrix | Cat#VX-06 |
| Recombinant DNA | ||
| CSII-pEF1a-DHB(aa994-1087)-mVenus | Spencer et al., 2013 | N/A |
| CSII-pEF1a-mCherry-Geminin(aa1-110) | Cappell et al., 2016 | N/A |
| pCru5-DHFR-mCherry-cyclin E1 | This Paper | N/A |
| pCru5-DHFR-cyclin D1-IRES-puro | This Paper | N/A |
| pCru5-DHFR-Cre | This Paper | N/A |
| CSII-pEF1a-H2B-mTurquoise | Spencer et al., 2013 | N/A |
| Software and Algorithms | ||
| Image analysis | Cappell et al., 2016 | N/A |
Highlights.
CDK4/6 activity is continuously required to sustain Rb hyperphosphorylation in G1
Cyclin E/A-CDK can only sustain Rb hyperphosphorylation from the start of S
CDK4/6 activity following mitogen removal sustains Rb hyperphosphorylation
Transient hysteresis in CDK4/6 activity underlies stochastic passage of R
ACKNOWLEDGMENTS
We thank Yan Geng and Piotr Sicinski for the E/A-null MEF cell line; Damien Garbett, Lindsey Pack, Arnold Hayer, Kathy Siemers, Yilin Fan, Akiko Seki, Bo Gu, and Matthew Bauer for help with troubleshooting experiments; the Stanford Shared FACS Facility for cell sorting; Ariel Jaimovich, James Ferrell, Karlene Cimprich, Julien Sage, Charles Sherr, Markus Covert, and Sabrina L. Spencer for helpful discussions; and Ariel Jaimovich, Lindsey Pack, and Damien Garbett for reviewing the manuscript. This work was supported by the Stanford Center for Systems Biology. S.D.C. was supported by a Damon Runyon Cancer Research Foundation Fellowship (DRG-2141). T.M. is supported by a National Institute of General Medical Sciences (NIGMS) R35 grant (GM127026).
Footnotes
DECLARATION OF INTERESTS
The authors declare no competing interests.
SUPPLEMENTAL INFORMATION
Supplemental Information can be found online at https://doi.org/10.1016/j.molcel.2019.08.020.
REFERENCES
- Aleem E, Kiyokawa H, and Kaldis P (2005). Cdc2-cyclin E complexes regulate the G1/S phase transition. Nat. Cell Biol 7, 831–836. [DOI] [PubMed] [Google Scholar]
- Barr AR, Heldt FS, Zhang T, Bakal C, and Novák B (2016). A dynamical framework for the all-or-none G1/S transition. Cell Syst. 2, 27–37. [DOI] [PMC free article] [PubMed] [Google Scholar]
- Cappell SD, Chung M, Jaimovich A, Spencer SL, and Meyer T (2016). Irreversible APC(Cdh1) inactivation underlies the point of no return for cell-cycle entry. Cell 166, 167–180. [DOI] [PMC free article] [PubMed] [Google Scholar]
- Cappell SD, Mark KG, Garbett D, Pack LR, Rape M, and Meyer T (2018). EMI1 switches from being a substrate to an inhibitor of APC/CCDH1 to start the cell cycle. Nature 558, 313–317. [DOI] [PMC free article] [PubMed] [Google Scholar]
- Chen P, Lee NV, Hu W, Xu M, Ferre RA, Lam H, Bergqvist S, Solowiej J, Diehl W, He Y-A, et al. (2016). Spectrum and degree of CDK drug interactions predicts clinical performance. Mol. Cancer Ther 15, 2273–2281. [DOI] [PubMed] [Google Scholar]
- Connell-Crowley L, Harper JW, and Goodrich DW (1997). Cyclin D1/Cdk4 regulates retinoblastoma protein-mediated cell cycle arrest by site-specific phosphorylation. Mol. Biol. Cell 8, 287–301. [DOI] [PMC free article] [PubMed] [Google Scholar]
- Connell-Crowley L, Elledge SJ, and Harper JW (1998). G1 cyclin-dependent kinases are sufficient to initiate DNA synthesis in quiescent human fibroblasts. Curr. Biol 8, 65–68. [DOI] [PubMed] [Google Scholar]
- Daigh LH, Liu C, Chung M, Cimprich KA, and Meyer T (2018). Stochastic endogenous replication stress causes ATR-triggered fluctuations in CDK2 activity that dynamically adjust global DNA synthesis rates. Cell Syst. 7, 17–27.e3. [DOI] [PMC free article] [PubMed] [Google Scholar]
- Ekholm SV, Zickert P, Reed SI, and Zetterberg A (2001). Accumulation of cyclin E is not a prerequisite for passage through the restriction point. Mol. Cell. Biol 21, 3256–3265. [DOI] [PMC free article] [PubMed] [Google Scholar]
- Fisher RP (2016). Getting to S: CDK functions and targets on the path to cell-cycle commitment. F1000Res. 5, 2374. [DOI] [PMC free article] [PubMed] [Google Scholar]
- Geng Y, Yu Q, Sicinska E, Das M, Schneider JE, Bhattacharya S, Rideout WM, Bronson RT, Gardner H, and Sicinski P (2003). Cyclin E ablation in the mouse. Cell 114, 431–443. [DOI] [PubMed] [Google Scholar]
- Gu J, Xia X, Yan P, Liu H, Podust VN, Reynolds AB, and Fanning E (2004). Cell cycle-dependent regulation of a human DNA helicase that localizes in DNA damage foci. Mol. Biol. Cell 15, 3320–3332. [DOI] [PMC free article] [PubMed] [Google Scholar]
- Gut G, Herrmann MD, and Pelkmans L (2018). Multiplexed protein maps link subcellular organization to cellular states. Science 361, eaar7042. [DOI] [PubMed] [Google Scholar]
- Hahn AT, Jones JT, and Meyer T (2009). Quantitative analysis of cell cycle phase durations and PC12 differentiation using fluorescent biosensors. Cell Cycle 8, 1044–1052. [DOI] [PMC free article] [PubMed] [Google Scholar]
- Håland TW, Boye E, Stokke T, Grallert B, and Syljuåsen RG (2015). Simultaneous measurement of passage through the restriction point and MCM loading in single cells. Nucleic Acids Res. 43, e150. [DOI] [PMC free article] [PubMed] [Google Scholar]
- Harbour JW, Luo RX, Dei Santi A, Postigo AA, and Dean DC (1999). Cdk phosphorylation triggers sequential intramolecular interactions that progressively block Rb functions as cells move through G1. Cell 98, 859–869. [DOI] [PubMed] [Google Scholar]
- Henley SA, and Dick FA (2012). The retinoblastoma family of proteins and their regulatory functions in the mammalian cell division cycle. Cell Div. 7, 10. [DOI] [PMC free article] [PubMed] [Google Scholar]
- Hitomi M, Yang K, Guo Y, Fretthold J, Harwalkar J, and Stacey DW (2006). p27Kip1 and cyclin dependent kinase 2 regulate passage through the restriction point. Cell Cycle 5, 2281–2289. [DOI] [PubMed] [Google Scholar]
- Johnson DG, Ohtani K, and Nevins JR (1994). Autoregulatory control of E2F1 expression in response to positive and negative regulators of cell cycle progression. Genes Dev. 8, 1514–1525. [DOI] [PubMed] [Google Scholar]
- Jorda R, Hendrychová D, Voller J, Řezníčková E, Gucky T, and Krystof V (2018). How selective are pharmacological inhibitors of cell cycle-regulating cyclin-dependent kinases? J. Med. Chem 61, 9105–9120. [DOI] [PubMed] [Google Scholar]
- Kalaszczynska I, Geng Y, Iino T, Mizuno S, Choi Y, Kondratiuk I, Silver DP, Wolgemuth DJ, Akashi K, and Sicinski P (2009). Cyclin A is redundant in fibroblasts but essential in hematopoietic and embryonic stem cells. Cell 138, 352–365. [DOI] [PMC free article] [PubMed] [Google Scholar]
- Lee JO, Russo AA, and Pavletich NP (1998). Structure of the retinoblastoma tumour-suppressor pocket domain bound to a peptide from HPV E7. Nature 391, 859–865. [DOI] [PubMed] [Google Scholar]
- Lin J-R, Fallahi-Sichani M, and Sorger PK (2015). Highly multiplexed imaging of single cells using a high-throughput cyclic immunofluorescence method. Nat. Commun 6, 8390. [DOI] [PMC free article] [PubMed] [Google Scholar]
- Lundberg AS, and Weinberg RA (1998). Functional inactivation of the retinoblastoma protein requires sequential modification by at least two distinct cyclin-CDK complexes. Mol. Cell. Biol 18, 753–761. [DOI] [PMC free article] [PubMed] [Google Scholar]
- Malumbres M, and Barbacid M (2009). Cell cycle, CDKs and cancer: a changing paradigm. Nat. Rev. Cancer 9, 153–166. [DOI] [PubMed] [Google Scholar]
- Malumbres M, Sotillo R, Santamaría D, Galán J, Cerezo A, Ortega S, Dubus P, and Barbacid M (2004). Mammalian cells cycle without the D-type cyclin-dependent kinases Cdk4 and Cdk6. Cell 118, 493–504. [DOI] [PubMed] [Google Scholar]
- Matson JP, and Cook JG (2017). Cell cycle proliferation decisions: the impact of single cell analyses. FEBS J. 284, 362–375. [DOI] [PMC free article] [PubMed] [Google Scholar]
- Matsushime H, Roussel MF, Ashmun RA, and Sherr CJ (1991). Colonystimulating factor 1 regulates novel cyclins during the G1 phase of the cell cycle. Cell 65, 701–713. [DOI] [PubMed] [Google Scholar]
- Merrick KA, Larochelle S, Zhang C, Allen JJ, Shokat KM, and Fisher RP (2008). Distinct activation pathways confer cyclin-binding specificity on Cdk1 and Cdk2 in human cells. Mol. Cell 32, 662–672. [DOI] [PMC free article] [PubMed] [Google Scholar]
- Merrick KA, Wohlbold L, Zhang C, Allen JJ, Horiuchi D, Huskey NE, Goga A, Shokat KM, and Fisher RP (2011). Switching Cdk2 on or off with small molecules to reveal requirements in human cell proliferation. Mol. Cell 42, 624–636. [DOI] [PMC free article] [PubMed] [Google Scholar]
- Meyerson M, Enders GH, Wu CL, Su LK, Gorka C, Nelson C, Harlow E, and Tsai LH (1992). A family of human cdc2-related protein kinases. EMBO J. 11, 2909–2917. [DOI] [PMC free article] [PubMed] [Google Scholar]
- Mittnacht S, and Weinberg RA (1991). G1/S phosphorylation of the retinoblastoma protein is associated with an altered affinity for the nuclear compartment. Cell 65, 381–393. [DOI] [PubMed] [Google Scholar]
- Narasimha AM, Kaulich M, Shapiro GS, Choi YJ, Sicinski P, and Dowdy SF (2014). Cyclin D activates the Rb tumor suppressor by monophosphorylation. eLife 3, e02872. [DOI] [PMC free article] [PubMed] [Google Scholar]
- O’Leary B, Finn RS, and Turner NC (2016). Treating cancer with selective CDK4/6 inhibitors. Nat. Rev. Clin. Oncol 13, 417–430. [DOI] [PubMed] [Google Scholar]
- Pardee AB (1974). A restriction point for control of normal animal cell proliferation. Proc. Natl. Acad. Sci. U S A 71, 1286–1290. [DOI] [PMC free article] [PubMed] [Google Scholar]
- Peters J-M (2006). The anaphase promoting complex/cyclosome: a machine designed to destroy. Nat. Rev. Mol. Cell Biol 7, 644–656. [DOI] [PubMed] [Google Scholar]
- Sage J, Mulligan GJ, Attardi LD, Miller A, Chen S, Williams B, Theodorou E, and Jacks T (2000). Targeted disruption of the three Rb-related genes leads to loss of G(1) control and immortalization. Genes Dev. 14, 3037–3050. [DOI] [PMC free article] [PubMed] [Google Scholar]
- Sage J, Miller AL, Pérez-Mancera PA, Wysocki JM, and Jacks T (2003). Acute mutation of retinoblastoma gene function is sufficient for cell cycle re-entry. Nature 424, 223–228. [DOI] [PubMed] [Google Scholar]
- Sakaue-Sawano A, Kurokawa H, Morimura T, Hanyu A, Hama H, Osawa H, Kashiwagi S, Fukami K, Miyata T, Miyoshi H, et al. (2008). Visualizing spatiotemporal dynamics of multicellular cell-cycle progression. Cell 132, 487–498. [DOI] [PubMed] [Google Scholar]
- Schwarz C, Johnson A, Kõ ivoma€gi M, Zatulovskiy E, Kravitz CJ, Doncic A, and Skotheim JM (2018). A precise Cdk activity threshold determines passage through the restriction point. Mol. Cell 69, 253–264.e5. [DOI] [PMC free article] [PubMed] [Google Scholar]
- Spencer SL, Cappell SD, Tsai FC, Overton KW, Wang CL, and Meyer T (2013). The proliferation-quiescence decision is controlled by a bifurcation in CDK2 activity at mitotic exit. Cell 155, 369–383. [DOI] [PMC free article] [PubMed] [Google Scholar]
- Yang HW, Chung M, Kudo T, and Meyer T (2017). Competing memories of mitogen and p53 signalling control cell-cycle entry. Nature 549, 404–408. [DOI] [PMC free article] [PubMed] [Google Scholar]
- Yung Y, Walker JL, Roberts JM, and Assoian RK (2007). A Skp2 autoinduction loop and restriction point control. J. Cell Biol 178, 741–747. [DOI] [PMC free article] [PubMed] [Google Scholar]
- Zetterberg A, and Larsson O (1991). Coordination between cell growth and cell cycle transit in animal cells. Cold Spring Harb. Symp. Quant. Biol 56, 137–147. [DOI] [PubMed] [Google Scholar]
Associated Data
This section collects any data citations, data availability statements, or supplementary materials included in this article.
Supplementary Materials
Data Availability Statement
Original data for immunoblot scans and representative microscopy images are available at Mendeley Data under the following link: https://doi.org/10.17632/85ft6ssw5x.1. The code for the image analysis pipeline is available at https://github.com/scappell/Cell_tracking. Additional modified scripts are available from the Lead Contact upon reasonable request.