

Abstract
The process by which actin polymerization generates pulling forces in cellular processes such as endocytosis is well understood than pushing-force generation. To clarify the basic mechanisms of pulling-force generation, we perform stochastic polymerization simulations for a square array or of polymerizing semiflexible actin filaments, having different interactions with the membrane. The filaments near the array center have a strong attractive component. Filament bending and actin-network elasticity are treated explicitly. We find that the outer filaments push on the membrane and the inner filaments pull, with a net balance of forces. The total calculated pulling force is maximized when the central filaments have a very deep potential well, and the outer filaments have no well. The steady-state force is unaffected by the gel rigidity, but equilibration takes longer for softer gels. The force distributions are flat over the pulling and pushing regions. Actin polymerization is enhanced by softening the gel or reducing the filament binding to the membrane. Filament-membrane detachment can occur for softer gels, even if the total binding energy of the filaments to the membrane is 100 kBT or more. It propagates via a stress-concentration mechanism similar to that of a brittle crack in a solid, and the breaking stress is determined by a criterion similar to that of the “Griffith” theory of crack propagation.
1. INTRODUCTION
In many cellular processes that require large forces to generate membrane curvature, such as formation of protrusions, endocytosis, and phagocytosis, actin is an essential factor [1]. Bending the membrane requires pushing and pulling forces in balance. Generation of pushing forces by actin polymerization has received substantial quantitative experimental study. For example, polymerization of individual actin filaments [2], and small numbers of actin filaments [3] yields forces on the order of pN. Force measurements on growing branched actin networks in vitro using cantilevers [4, 5] found pushing pressures of ≈ 0.2 − 1.0 × 10⁻³ pN/nm2. Force densities on actin-propelled biomimetic beads [6] reach values of at least 2.5 × 10⁻⁴ pN/nm2. On the other hand, the processes by which actin polymerization generates pulling forces have received less quantitative study. Experiments on motile fluid vesicles propelled by actin comet tails [7, 8] found a force distribution dominated by inward pushing forces on the sides of the vesicle, and directional pulling forces at the rear of the vesicle. The maximum pulling pressure in Ref. [7] was about ≈ 3.5 × 10⁻⁴ pN/nm2. Measurements of force around podosomes, mechanosensitive adhesion cell structures that exert protrusive forces onto extracellular environment, show that pushing forces from actin polymerization at the core and pulling forces from lateral acto-myosin contractility in the surrounding adhesion ring are required for a single podosome to deform the substrate [9].
Endocytosis in yeast also requires pulling forces from actin. The required magnitude is large, since overcoming the turgor pressure of 0.2 pN/nm2 or more [10] requires a comparable pulling-force density from actin polymerization. Actin patches consisting of an Arp2/3-branched network [11] form during this process. This network constitutes a crosslinked gel whose mechanical properties are not well known. The pulling forces required to initiate invagination are generated only after the arrival of actin [12], suggesting that the network generates them. Furthermore, recent superresolution microscopy studies of the geometry of the process demonstrated accumulation of the membrane-filament binding protein Sla2, within a central dot, surrounded by a ring of the actin nucleator Las17 [13] (a WASP homolog). This suggested a generic mode of pulling-force generation with enhanced actin polymerization in a ring-shaped region creating pulling forces at the center. Deleting the yeast crosslinking protein Sac6, which should reduce the stiffness of the actin gel [14], stops invagination [15]. Reducing the turgor pressure by providing osmotic support across the plasma membrane reduces the requirement for actin filament cross linkers [16], presumably because the force requirement is lowered. These observations, in combination, show that a stiff actin gel is required for robust pulling-force generation. In addition, mutating Sla2 by deleting its actin-binding domain stops the invagination process [15], showing that strong actin-membrane attachments are crucial. Further contributions are probably generated by curvature-generating proteins such as clathrin. However, these are not sufficient to drive the process, as shown by the correlated electron-microscopy and light-microscopy studies of Ref. [12]. This work showed that no measurable membrane bending occurs without polymerized actin, suggesting that actin polymerization is the dominant factor generating pulling forces.
Although numerous theoretical models have described how actin polymerization generates pushing force [17, 18], generation of pulling forces has been studied less extensively. Most studies have assumed that the total force exerted by the actin network on the membrane vanishes, corresponding to overall force balance on the actin network. This assumption is justified by the smallness of the viscous and inertial forces acting on the actin network [19]. Force balance implies that there are two types of filaments, pushing and pulling. Simple calculations based on the surface area of the invagination and the turgor pressure indicated that forces of over 1000 pN were required to drive endocytic invagination in yeast [20]. Subsequent analyses performed by fitting to observed membrane shapes, including force terms from membrane tension, membrane curvature, and curvature-generating proteins, gave estimates of ~ 3000 pN for the minimum required actin pulling force [21, 22].
A few models have explicitly treated the process by which actin polymerization generates pulling forces during endocytosis in yeast. They have assumed enhanced actin polymerization in a ring-shaped region. Using an actin polymerization rate increasing continuously outwards from the center of the endocytic patch, the continuum-mechanics calculations of Ref. [19] showed that even modest actin polymerization forces spread over a large ring can generate a large pulling-force density at the center by a force-amplification process. These calculations were extended in Ref. [22] to evaluate the actin growth profile needed to generate the required pulling forces. Subsequent work [23] treating the actin network as a visco-active gel found that it could exert su cient pulling forces to drive the process. The validity of a continuous deterministic treatment of the discrete stochastic system of filaments and membrane, however, is not clear.
Stochastic simulations of the growth of a rigid 3D actin network [24] during endocytosis in yeast assumed a uniform distribution of the actin nucleator Las17 in a ring-shaped region on the membrane. They also assumed that the filament growth velocity is determined by the average opposing force per filament. However, the distribution of the forces exerted on the membrane was not obtained. Simulations based on realistic dimensions and molecular compositions taken from superresolution experiments found that a 3D branched network of actin filaments can produce forces exceeding 1000pN, enough to overcome turgor pressure [13]. However, in this model, the actin filament stall forces may have been overestimated [25], which could lead to an overestimate of the pulling force.
Although these models have confirmed the ability of an actin-nucleator ring to generate pulling forces, there has been no systematic study of the mechanisms determining the magnitude of the pulling force, and how this magnitude is affected by key physical properties. By force balance, the pulling force must be limited by the total stall force of the pushing filaments. However, it is neither clear what fraction of this limit can be achieved practically, nor how rapidly the pulling force reaches its maximum value. In addition, there have been no detailed studies of the spatial distribution of the pulling force, explicitly treating stochastic polymerization of individual filaments. Finally, the possibility of pulling filaments detaching from the membrane has not been treated in detail. This process is plausible because of the large magnitude of the pulling force per pulling filament.
The key features that affect pushing-force generation, such as the free-monomer concentration CA and the on/off rate constants and , are important for pulling-force generation as well. The single-filament stall force obtained by thermodynamic arguments [26] is
| (1) |
where and are rates for a free filament not interacting with an obstacle, CA is the actin monomer concentration, δ is the actin step size per added subunit, and θ is the angle of incidence relative to the direction of motion. Thermodynamic analysis shows that the stall force is proportional to the number of filaments and is independent of the geometrical details of the growth process, a result confirmed by simulations [27]. However, it has been suggested that ATP hydrolysis can reduce the stall force [28]. Lateral interactions [29, 30] can also a ect the stall force. But in branched actin networks such those at endocytic actin patches, the filament spacings of ~10nm are large enough that lateral interactions are probably not important. Bending of individual actin filaments, and the elasticity of the actin network on whole, are also likely important for pulling-force generation. Previous studies have shown that fluctuations of the tips or bases of actin filaments are crucial for obtaining rapid network growth under moderate forces [31, 32].
Here we calculate the pulling forces that a discrete array of cross-linked actin filaments with varying polymerization properties exerts on a rigid obstacle. We evaluate the total magnitude of the pulling force, its spatial distribution, the dynamics of the force buildup, and the conditions that lead to detachment of the pulling actin filaments from the membrane. The scale and parameters of the model are chosen to correspond to endocytosis in yeast. We assume that there is a group of filaments at the center of the array whose zero-force growth velocity is low because their growing ends are strongly bound to the obstacle. When the remaining “pushing” filaments grow, the slower-growing filaments inhibit this growth via their indirect linkage to the pushing filaments mediated by the obstacle, and thus exert a pulling force.
We vary several parameters, including the pulling filaments’ binding strength and the actin gel stiffness, and evaluate the resulting effects on force generation and actin network deformation. We interpret our numerical results from this complete system of filaments, including “pushers” and “pullers”, via a mean-force model that treats the pushers and pullers separately. In this model, the growth velocity is determined by the equality of the pusher and puller forces at a common velocity. We calculate the effect of transient attachments of the pushing filaments to the membrane on the magnitude of the pulling force. We evaluate the dependence of the time scale of force generation rate on the gel stiffness. Finally, we investigate how detachment of pullers depends on the gel stiffness.
We find that strengthening the filament-obstacle binding by choosing deeper potential wells for the central filaments decreases the growth rate of the actin network in this region. This increases the total pulling force up to a maximum that becomes the sum of the stall forces of the surrounding pushing filaments when the central filaments do not polymerize at all. However, even very slow polymerization of the central filaments can strongly reduce the pulling force. We also find that the mean-force model accurately predicts the results of full system simulations for the total pulling force. We find that the time required for the maximum pulling force to build up is roughly inversely proportional to the gel stiffness. Transient attachments of the pushing filaments reduce the total pulling force, so maximum force is produced when their potential is purely repulsive. Finally, softening the gel, or weakening the binding of the central filaments, can lead to actin gel detachment from the membrane despite the total binding energy of several hundred kBT or more between the puller filaments and the membrane.
2. MODEL
We model the growing actin network at an endocytic site as a 12 × 12 square array of filaments with spacing a, interacting with a flat moving obstacle (see Fig. 1). The geometry is motivated by the measured architecture [13] of the endocytic actin patch, but to reduce the computational load the 120×120 nm square geometry is taken somewhat smaller than the measured circular geometry of radius 100 nm. We treat a fixed number of uncapped filaments rather than treating the dynamics by which filaments are nucleated by Arp2/3 complex and subsequently capped. Thus we model the force-generation properties of the filaments that are uncapped at a given time. The obstacle, corresponding to the combination of the cell wall and membrane, contains a central 6 × 6 patch of a filament-membrane binding protein such as Sla2 (yellow circles), surrounded by a square band of nucleation promoting factors (NPFs), such as the yeast WASP homolog Las17 (purple circles). As the filaments grow, more rapid growth of the filaments in the outer region causes pulling and pushing forces act on the gel in the directions indicated by black arrows, deforming the gel. In order to elucidate the physical mechanisms as clearly as possible, we focus on the steady-state force and the buildup to steady state, rather than treating the feedback loops [24] that cause the polymerized-actin count to drop to zero after reaching a peak. We also leave out possible effects of hydrolysis of actin subunits at filaments tips. The possible consequences of this assumption are analyzed in Section 2.5.
Figure 1.
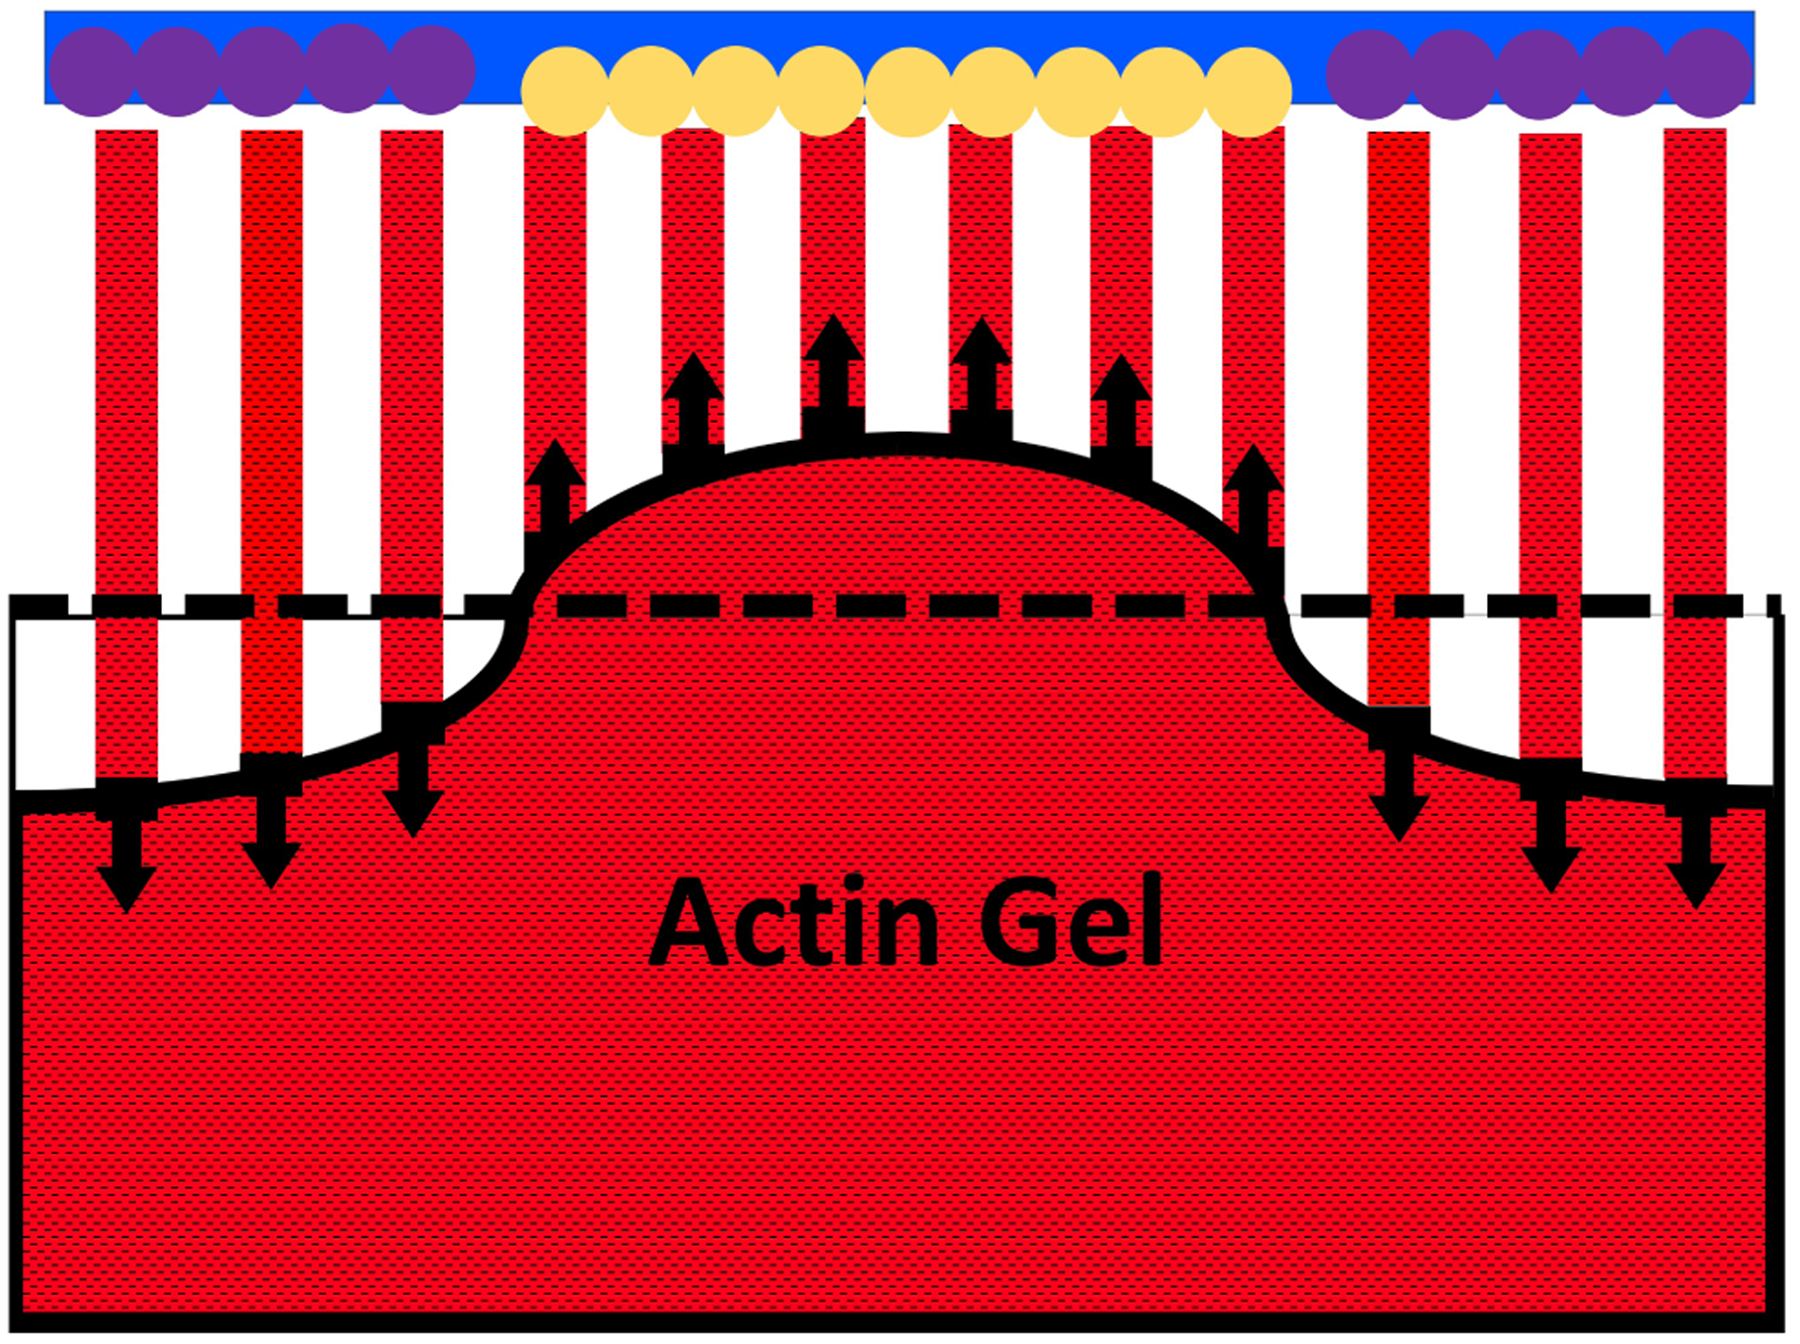
Schematic cross section of 12 × 12 filament array. A 6 × 6 square of central filament are bound to the membrane via attachment proteins such Sla2 (yellow circles), and exert pulling forces. The surrounding 108 filaments in the actin nucleator region (purple circles) are faster-growing filaments that exert pushing forces on the membrane. Corresponding reaction forces act on the actin gel and deform it. Solid black line denotes surface of deformed actin gel; dashed line denotes undeformed surface.
Each filament tip interacts with the obstacle via a smooth potential U(r), where r is the distance from the filament tip to the obstacle. U(r) can be either purely repulsive or have an attractive well. The 6 × 6 square central filament subset is assumed to have a deep well in U(r), corresponding to filament-membrane binding. The outer filaments have a purely repulsive potential or one with a shallow well. We adopt a picture similar to that of Ref. [33] where the filament “free length” L protrudes beyond a gel region, which we treat as linear and elastic. We define the filament bases (black squares) as being a distance L in from the tip. At this point the filaments are crosslinked, either by Arp2/3 complex or another crosslinker, and the gel begins (see Fig. 1). For simplicity, we ignore variations in L from filament to filament. The initial filament base positions are staggered randomly within a subunit length interval, so that each filament tip is at a different position relative to the membrane. The filaments polymerize and depolymerize stochastically at rates that depend on r. The filament tips also diffuse rapidly, because of bending fluctuations. We focus on the component of the diffusive motion perpendicular to the obstacle. Diffusive motion of a filament tip parallel to the obstacle does not change the filament-obstacle interaction, because this motion is much smaller in magnitude than the distance (10 nm or more) over which the filament-obstacle interaction changes character. Similarly, diffusive motion of bases describes elastic deformation of the actin gel induced by the forces from the filaments. In treating this effect, crosslinks between bases of adjacent filaments are modeled as springs that constrain the relative motion of filaments in the direction perpendicular to the obstacle. Both the tip and base motions are described using biased Brownian dynamics driven by the filament-obstacle interaction and a linear restoring force. This force is determined by the filament rigidity for tip fluctuations and the actin gel stiffness for the base motions. The obstacle moves stochastically in response to forces from the filaments, via biased Brownian motion.
2.1. Filament-Obstacle Interaction
Fig. 2 shows the interaction between a single actin filament and the obstacle. To simplify the calculations, we project the growth of the actin filament onto the z direction (the direction of the obstacle motion), with δ cos(θ) being the projected actin step size. We treat only the z-direction growth explicitly. The default filament direction makes an angle θ = 35° with the normal to the obstacle, consistent with the 70° Arp2/3 branching angle [34]. The azimuthal angle is unspecified because it does not affect the calculation results. This approach ignores lateral motion of the filament tips along the membrane resulting from polymerization. The possible impact of this approximation is discussed in Section 2.5.
Figure 2.
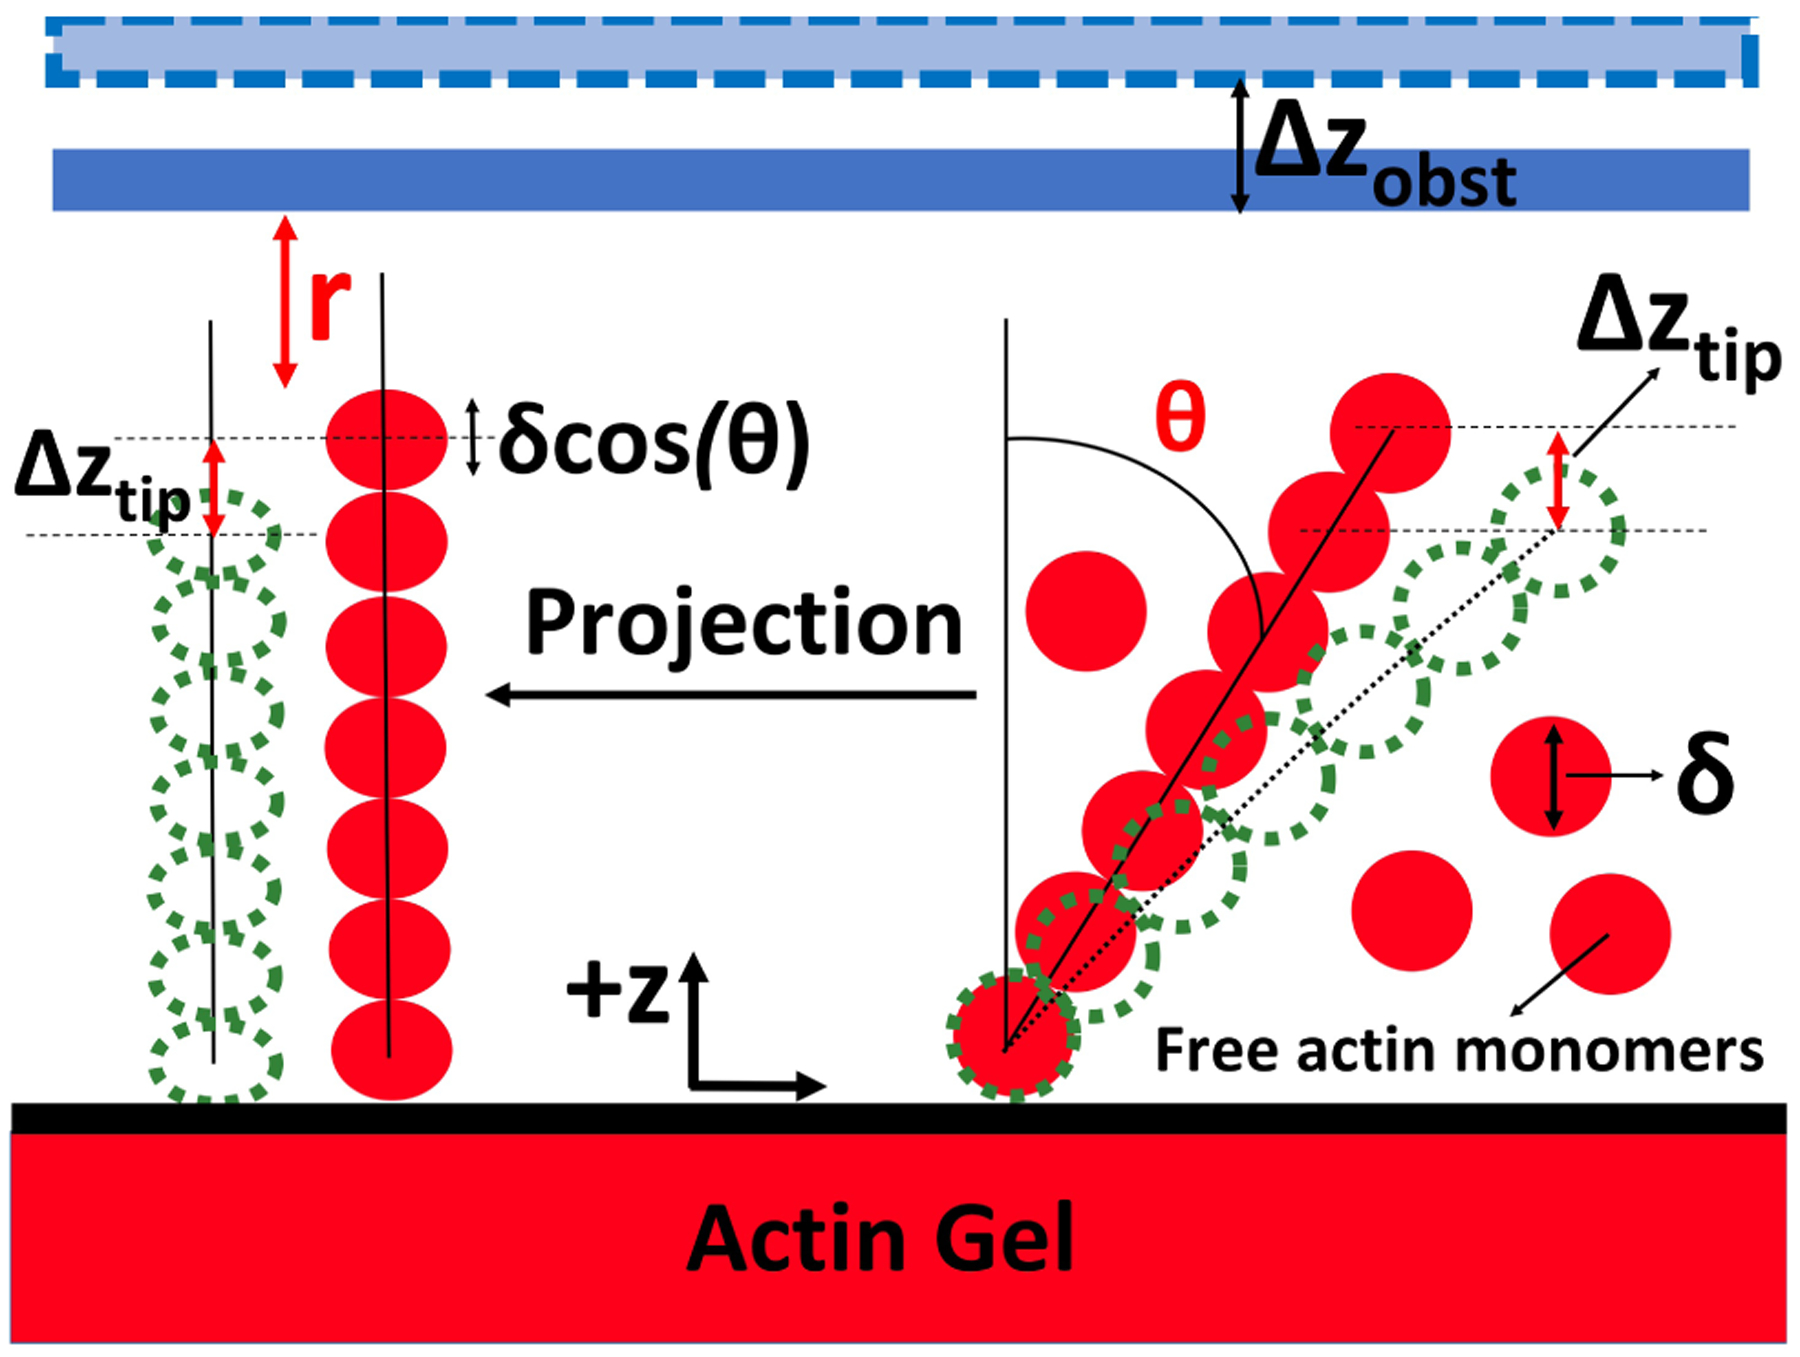
Schematic of the filament-obstacle interaction. r is distance between filament tip and obstacle, δ is actin monomer size = 2.7nm, Δzobst is obstacle position fluctuation, and Δztip is the filament tip position fluctuation in the ±z direction during a given time step.
The distribution of pulling and pushing forces on the obstacle is determined by the differences in polymerization and bending/deformation between different filaments. To keep track of these differences, we define for each filament a “height”, which determines the filament-obstacle interaction. The height of filament i is determined at a given time step by
| (2) |
where n is the number of subunits added to the filament, ztip is the filament tip fluctuation, and zbase is the filament base fluctuation. Staggering of filaments is described by the initial base positions h0(i) = αiδ cos (θ), where αi is a random number between 0 and 1. This means that even if all the filaments have grown by the same number of subunits, their heights will differ because their bases are at different locations. These correspond to the positions of Arp2/3 branch points where the filaments anchor in the gel.
Changes in h result from either polymerization, filament bending, or motion of the filament base. The values of h do not correspond to actual filament lengths, which are not calculated explicitly. Only differences in h from filament to filament are important for determining the forces. The time dependent gap r between the obstacle at position zobst and a given filament tip is
| (3) |
We treat the interaction between the obstacle and the filament tip with smooth idealized potential functions, as shown in Fig. 3, having the form
| (4) |
Or
| (5) |
where A, B, C, D, κ1, κ2, κ3, κ4, r1, and r2 are constants. Having a non-zero B in Eq. 4 adds an attractive well to the potential. We refer to this type of potential as a “simple well”. A “double-well” potential is obtained by choosing positive C and D in Eq. 5. In the double-well potential the broad minimum might represent conformational flexibility of a protein binding the actin filament to the membrane, or the presence of two different binding sites [35, 36]. The corresponding forces exerted on the obstacle by the filaments are
| (6) |
and
| (7) |
The pusher filaments in the outer ring of the array have either only repulsive potential terms or a repulsive potential plus one with a shallow “simple” well. The puller filaments in the 6 × 6 central region have either a deep “simple well” or a “double well” potential.
Figure 3.
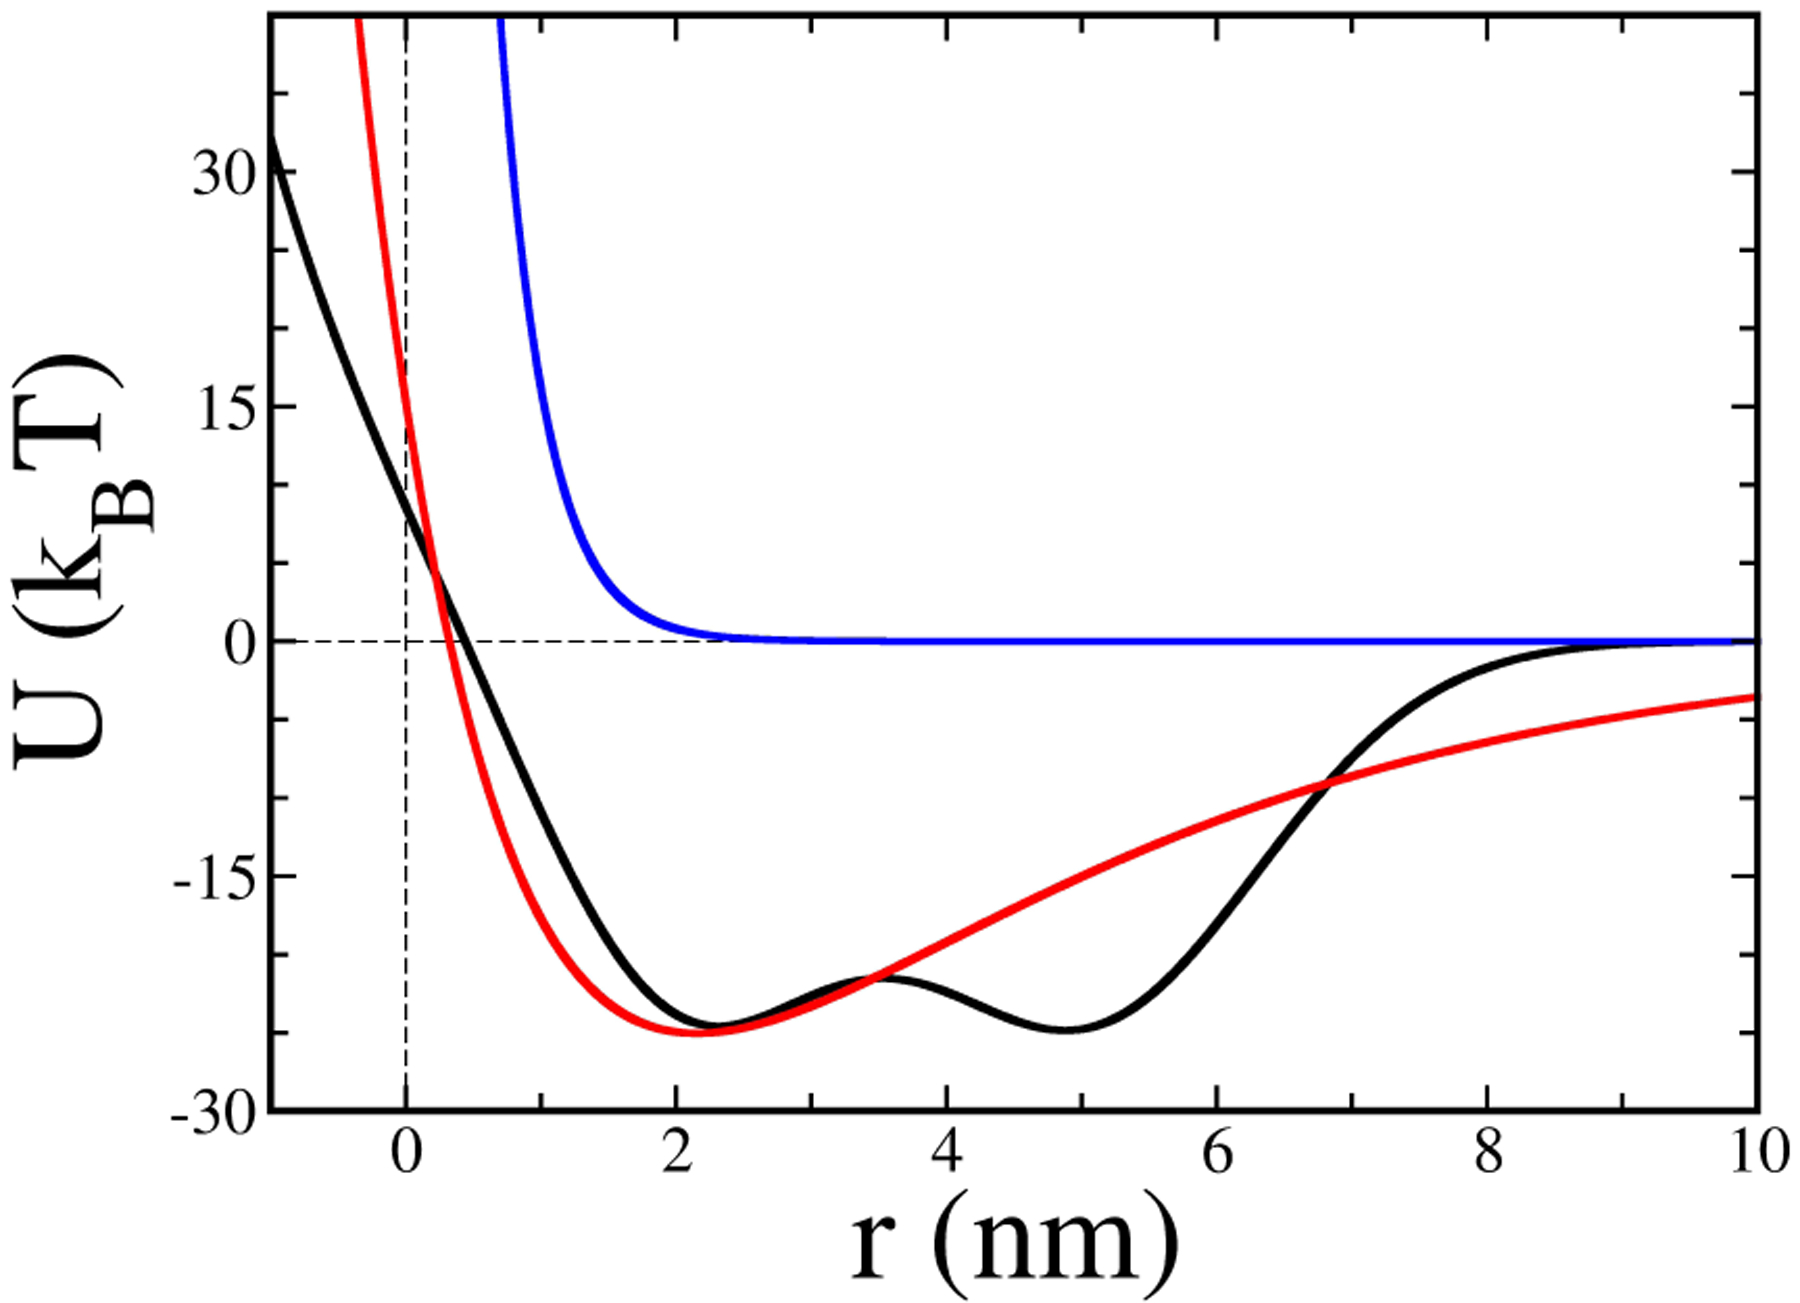
Filament-obstacle interaction potentials, given by Eq. 4 and Eq. 5. Blue curve: “pusher potential” (Eq. 4), with A=54.66 pN·nm, B=0, and κ1=0.9 nm−1. Red curve: “puller potential” having a well depth of 25kBT , with parameter values (Eq. 4) A=358.01 pN·nm, B=294.72 pN·nm, κ1=0.9 nm−1. Black curve: “double-well potential” (Eq. 5) with A=54.66 pN·nm, C=100 pN·nm, D=100 pN·nm, 3 = 0.643 nm−1, κ4 = 0.544 nm−1, r1 = 2 nm, and r2 = 5 nm.
2.2. Stochastic treatment of actin polymerization
The actin on-rate, kon, has been defined in most previous models as an average over a time long compared to the time scale of filament-tip and obstacle fluctuations. Here, such an average is not appropriate because of the large force fluctuations that occur over short times from the combination of Brownian obstacle and filament-tip motion, and the rapid variation of the force between the filaments and the obstacle. Therefore we treat instantaneous rates that apply to a particular position of the filament tip relative to the obstacle. Thermodynamic analysis [25] shows that the instantaneous position-dependent rates must satisfy the relationship
| (8) |
where and are free-filament on- and o - rates respectively. In order to concretely determine kon and koff, we assume that their magnitudes never exceed the free filament on and off rate values, so that
| (9) |
| (10) |
2.3. Stochastic time evolution of obstacle position, filament bending and gel deformation
The obstacle position and filament bending evolve in time according to random thermal forces and deterministic forces from the filament-obstacle interaction potential, as well as linear restoring forces for the filament tips. For conceptual simplicity, we treat the system dynamics using a “filament-centric” approach, where the actin gel is assumed to be stationary, while the obstacle moves. To treat force generation in the presence of a stationary obstacle, the calculated motion can be reversed by a simple coordinate transformation, assigning the actin gel diffusion coefficient to the obstacle. The diffusive motions of the obstacle and filament bending coordinates are treated by the discrete form of the Langevin equation (Ref. [37], Chapt. 3):
| (11) |
| (12) |
Here Dobst is the obstacle diffusion coefficient, Dtip is the filament tip diffusion coefficient, Ftot is the total force from the filaments acting on the obstacle, Fload is the external force applied on the obstacle (used only in the “Mean-Force” model described below), Δt is the time step, and kbend is the tip bending stiffness. Further, α and α′ are random numbers uniformly distributed between and , so that . Displacements in consecutive time steps are uncorrelated. The values of Δztip,i are limited to the range defined by a filament being either perpendicular to the obstacle or parallel to it: −δ cos (θ) < Δztip,i < δ[1 − cos (θ)]. The use of uniform distribution for the individual steps is justified, because the central limit theorem guarantees that after many steps the the displacement distribution will approach the Gaussian distribution that characterizes Brownian motion. We find that already after five time steps or 2.5 × 10⁻⁹ sec, the rms difference between the calculated displacement distribution and the Gaussian is only 1.3% of the Gaussian peak height.
Gel deformation is treated via stochastic motion of the filament bases anchored in the gel. Interactions between different bases include only nearest-neighbor interactions, and are assumed to be proportional to the difference in their z-coordinates. The base displacements follow an equation similar to that of the tips:
| (13) |
Here Dbase is the filament base diffusion coefficient, kelas is the filament-base spring constant embodying the elasticity of the actin gel, and the random number <α″> has properties identical to those of <α′>. The Δznn,i term is the difference between the average zbase of a filament’s neighbors and the value of zbase for the filament itself. The Δzbase,i term is also needed, because in its absence the degree of freedom corresponding to uniform motion of the gel surface and the obstacle by the same amount has no restoring force. The Δzbase,i prevents “wandering” of this degree of freedom by pinning the average displacement of the surface of the gel near zero.
2.4. Choice of parameters
The parameters are given in Table I. As described above, the obstacle diffusion coefficient Dobst corresponds to that of the actin gel, Dgel. Estimating Dobst from the actin gel size of ~ 102 nm vs. 3 nm-size actin monomers with diffusion coefficient Dmon = 5×10⁶ nm2/sec [38], using the inverse proportionality of diffusion coefficients to size, would suggest Dobst = Dmon/30 = 1.7×10⁵ nm2/sec. However, using an obstacle diffusion coefficient this large would be extremely computationally demanding, and for this reason we use a smaller value Dobst = 104 nm2/sec. We believe that this value is large enough to capture the key physical mechanisms since the dimensionless ratio of (the time that takes the obstacle to diffuse the length of one actin step size) to (the time for one free-filament subunit to add), , is still very small. Here CA is the actin monomer concentration and is the free-filament on-rate constant (see Table I). The diffusion coefficients Dtip and Dbase are expected to be much larger than Dobst because the moving entities are much smaller than the actin gel. Again, for computational practicality we use values of Dtip and Dbase, that are 10 times larger than Dobst, but probably smaller than the physical values. We have evaluated the sensitivity of the results to these two parameters by halving each one separately, and halving them both at the same time. This changed the total pulling force by only about 1%. We have not tested the effect of increasing the parameter values, because of the large computational effort that would be required. But the smallness of the effect resulting from reducing the values suggests that the effect of increasing them would also be moderate unless the behavior changes very abruptly as a function of the diffusion coefficients. We obtain a = 10nm for the filament spacing from the estimated number of actin filaments 300 [39] at an endocytic patch with radius R = 75nm.
Table I:
Symbol definitions and parameter values.
| Symbol | Definition | Value |
|---|---|---|
| δ | Actin step size | 2.7 nm |
| CA | Bulk actin monomer concentration | 5.3 μM(Ref.[43]) |
| Free filament polymerization constant | 11.6 s−1 μM−1 (Ref. [44]) | |
| Free filament depolymerization constant | 1.4 s−1 (Ref. [44]) | |
| Dobst = Dgel | Obstacle diffusion coefficient | 104 nm2/s |
| Dtip | Filament tip diffusion coefficient | 105 nm2/s |
| Dbase | Filament base diffusion coefficient | 105 nm2/s |
| kbend | Tip bending spring constant | 4.17 pN/nm |
| kelas | Gel deformation spring constant (medium stiffness) | 0.53 pN/nm |
| E | Actin gel Young’s modulus | 0.14 pN/nm2 [22] |
| Δt | Simulation timestep | 5 × 10⁻¹⁰s |
| Fstall | Filament stall force | 7.03 pN |
| θ | Angle between filament tip direction and normal to obstacle | 35° |
| U (r) | Potential of interaction between filament tip and obstacle | varies |
| F (r) | Force exerted on obstacle by filament | varies |
| Fload | External force on obstacle | varies |
| vgrowth | Filament growth velocity | varies |
| r | Gap between filament tip and obstacle | varies |
| a | Spacing of filaments in square lattice | 10 nm (deduced from Ref.[39]) |
| zobst | Obstacle z coordinate (height) | varies |
| ztip | Filament tip z coordinate (height) | varies |
| zbase | Filament base z coordinate (height) | varies |
We obtain the bending spring constant as kbend = 3kBT Lp/L3 sin (θ)2 = 4.17 pN/nm [40]. Here Lp = 17.5μm is the persistence length of an actin filament [41] and as discussed above L is the free length of the filament beyond the gel surface. We take L to have a typical value of 54 nm, corresponding to the 20 subunits of a typical actin filament in endocytic actin patch. (The estimated number of actin filaments at an endocytic patch is taken to be 300 [39], with a total of 6000 actin monomers [42]). We assume that L remains constant during the polymerization process, as crosslinkers bind to newly grown parts of the actin gel near the membrane.
The actin-gel spring constant kelast is obtained by fitting it to elastic restoring forces calculated for a configuration of filaments where alternating filaments are displaced in opposite directions (see Appendix).
2.5. Validity of Assumptions
Here we discuss the potential impacts of the main simplifying assumptions that we have made:
Assumption of a sharp boundary between pusher and puller filaments.
Because the endocytic protein patches assemble stochastically, the boundary between the pusher and puller filaments will be blurred. In the regions where there are roughly equal numbers of pullers and pushers, the forces will oppose each other and the “smeared” force density will be reduced relative to the force densities in the strongly pushing or pulling regions. This will reduce the magnitude of the total pulling force that can be obtained.
Ignoring lateral component of polymerization.
This could have at least two effects. First, filament tips of pushers could move into the puller region. This would blur the boundary between pushers and pullers, reducing the total pulling force as described above. Second, if the filament tips are anchored strongly enough in the membrane that lateral motion is inhibited, forces could build up that would slow the polymerization of the pusher filaments. Again, this would reduce the total pulling force.
Treatment of the actin network as an elastic gel.
Viscous flow of the actin network will inhibit its ability to sustain a distribution of pushing and pulling forces, once again reducing the magnitude of the total pulling force. The viscosity of the actin network at endocytic actin patches is not known, but the magnitude of the effect is estimated in the Discussion section.
Assumption of an infinitely hard obstacle.
During endocytosis, the actin gel interacts with the cell membrane, which in turn interacts with the cell wall. We model only the part of the process before the invagination forms. During this time, the membrane is pressed against the cell wall. The force from the membrane is unlikely to deform the cell wall noticeably. This force density is comparable to the turgor pressure, which is about 200 kPa [10]. On the other hand, the Young’s modulus of the cell wall is about 110 MPa and its thickness is about 120 nm, suggesting a maximum deformation of about (120 nm)× (200 kPa)/(110 MPa) = 2.5 nm, very small on the scale of the current simulations. In addition, because the membrane is nearly flat, the bending forces that it generates and transmits to the actin gel are very small. Therefore we feel that using an infinitely hard obstacle is a reasonable approximation.
Absence of hydrolysis effects in model.
If subunits at filament tips hydrolyze and release inorganic phosphate before a new subunit is added, the pusher-filament stall force will be reduced [28]. The rates of hydrolysis and phosphate release are not known for filament-tip subunits in endocytic actin patches. However, as the opposing force increases, the rate of subunit addition will slow, increasing the likelihood of release occurring before subunit addition. Therefore the total pulling force, even for very tightly bound pullers, could be significantly below the value predicted from the thermodynamic stall forces of the pusher filaments.
3. RESULTS
3.1. Force generation and gel deformation by a 12 × 12 square array of cross-linked filaments
The simulations for our system of 6 × 6 = 36 pullers and 12 × − 36 = 108 pushers begin with all the filaments having one subunit, and their bases staggered as discussed above. Pushing and pulling forces develop as the pushers and pullers grow at different rates. The total pulling force is defined as the sum of all of the forces on the pulling filaments, and is taken to have a negative sign. We obtain our results from a single run of 10 seconds, rather than averaging multiple shorter runs. We use this procedure because obtaining reasonable estimates of the steady-state forces requires us, for each simulation run, to go beyond an equilibration time that can be as long as several seconds. For this reason, multiple runs much shorter than ten seconds would not be valuable because they would be dominated too much by the equilibration time. Multiple runs of ten seconds, for each parameter set, are not viable because of the computer time required. However, a single long run will accurately represent the results of shorter runs if the system is ergodic, so that a time average is equivalent to a configuration average. We are not able to perform enough runs to test the ergodicity for our full 144-filament system. However, we have tested it for a smaller 16-filament system with 4 pulling filaments. We compared results of runs of 10 shorter runs of 5 seconds with the result of one long run of 30 sec. We obtained a force of 62 pN from the shorter runs, a force of 66 pN from a run of 30 sec, and forces of 62 and 67 pN from two 10 sec runs. Thus for this smaller system using a single long run gives average forces accurate to better than 10%. The force fluctuations in the larger 144-filament system are found to be about three times smaller than in the smaller system, so we expect that the average forces in this case are accurate to within a few percent.
Fig. 4 shows the time course of the total pulling force for systems with different puller-obstacle interaction potentials (see Fig. 3), treating a range of values of the actin gel stiffness. The total pushing force (not shown) almost entirely balances the pulling force. The total pulling force is thus less than the sum of the pusher stall forces
| (14) |
Weak puller-obstacle binding, as in the 5kBT potential, generates very small forces. The pulling force approaches the limiting value of 760 pN with increasing well depth, but even for potentials as deep as 50kBT , the pulling force is substantially below the limiting value. Modifying the gel stiffness (halving kelas for “soft” gels and doubling kelas for “stiff” gels) might correspond to changing the concentration of actin filament crosslinkers. This does not change the asymptotic total pulling force, but stiffer gels generate large pulling forces earlier in the process. In addition, soft gels can lead to detachment of the pulling filaments from the obstacle, as occurs in the “25kBT soft” curve at about 1.8 sec, where the force suddenly drops to zero. This effect is described in detail in Section 3.6.
Figure 4.
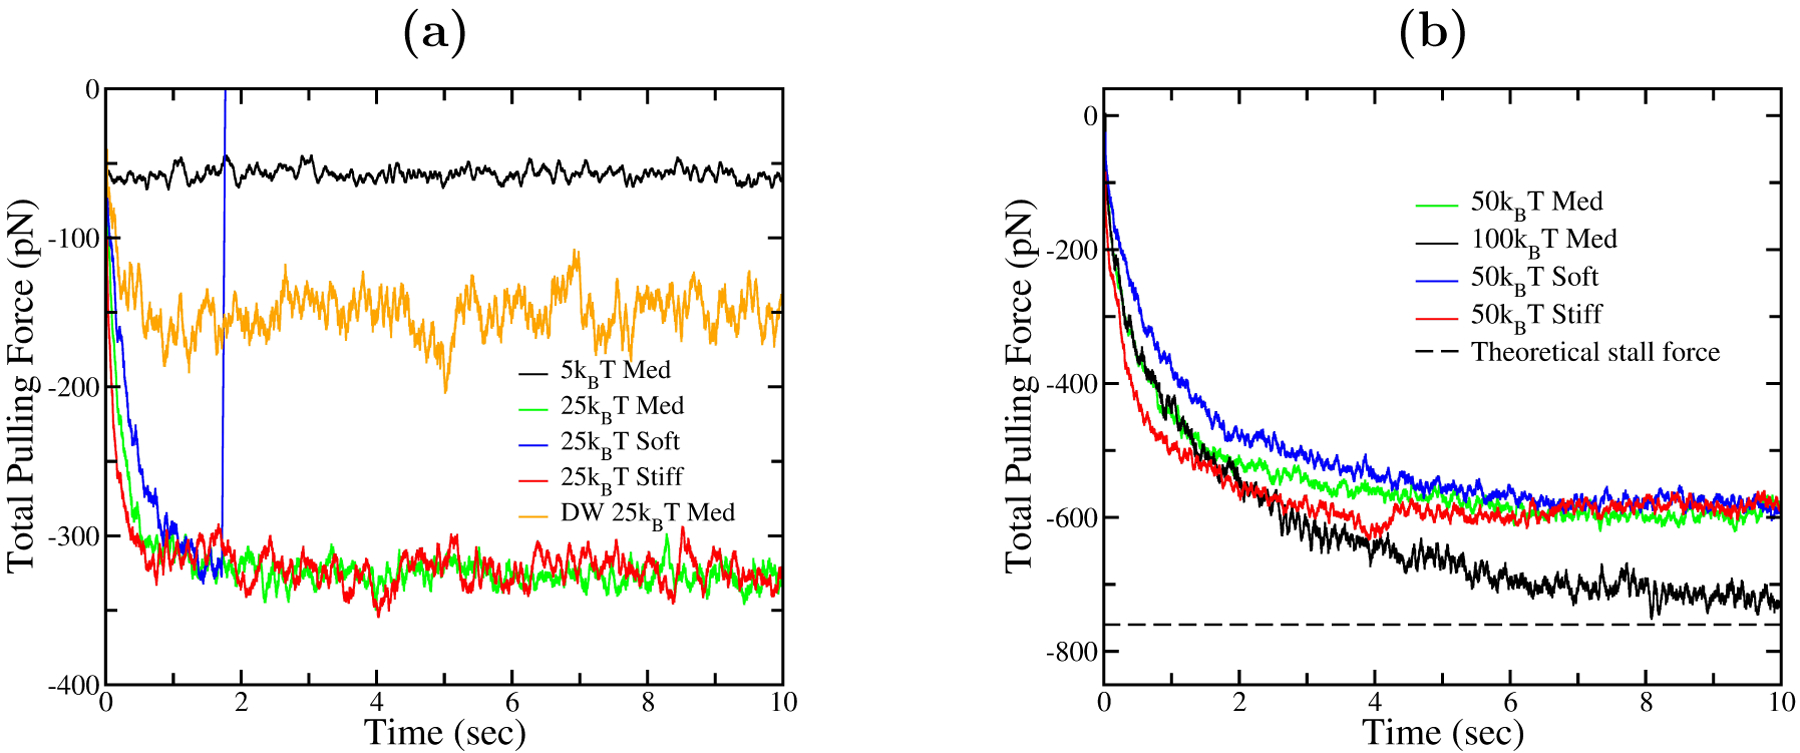
Sample runs showing total force from pullers over time, with different well depths and gel elasticity factors. Curves are averaged over 50ms time steps. Medium elasticity factor corresponds to baseline kelas = 0.53pN/nm; soft and stiff kelas values are half and double the baseline.
The total gel deformation is another measure of the force-generating capability of the system. It is defined as the difference between the average base position of all the pullers and that of the pushers. Fig. 5 shows the gel deformation over time for different puller potentials and gel rigidities. Strengthening the central filament attachments and softening the gel both lead to larger gel deformations. The loss of force seen in Fig. 4, resulting from detachment of a softer gel from the obstacle at early times, corresponds to the sudden loss of deformation in Fig. 5 at about 1.8 sec.
Figure 5.
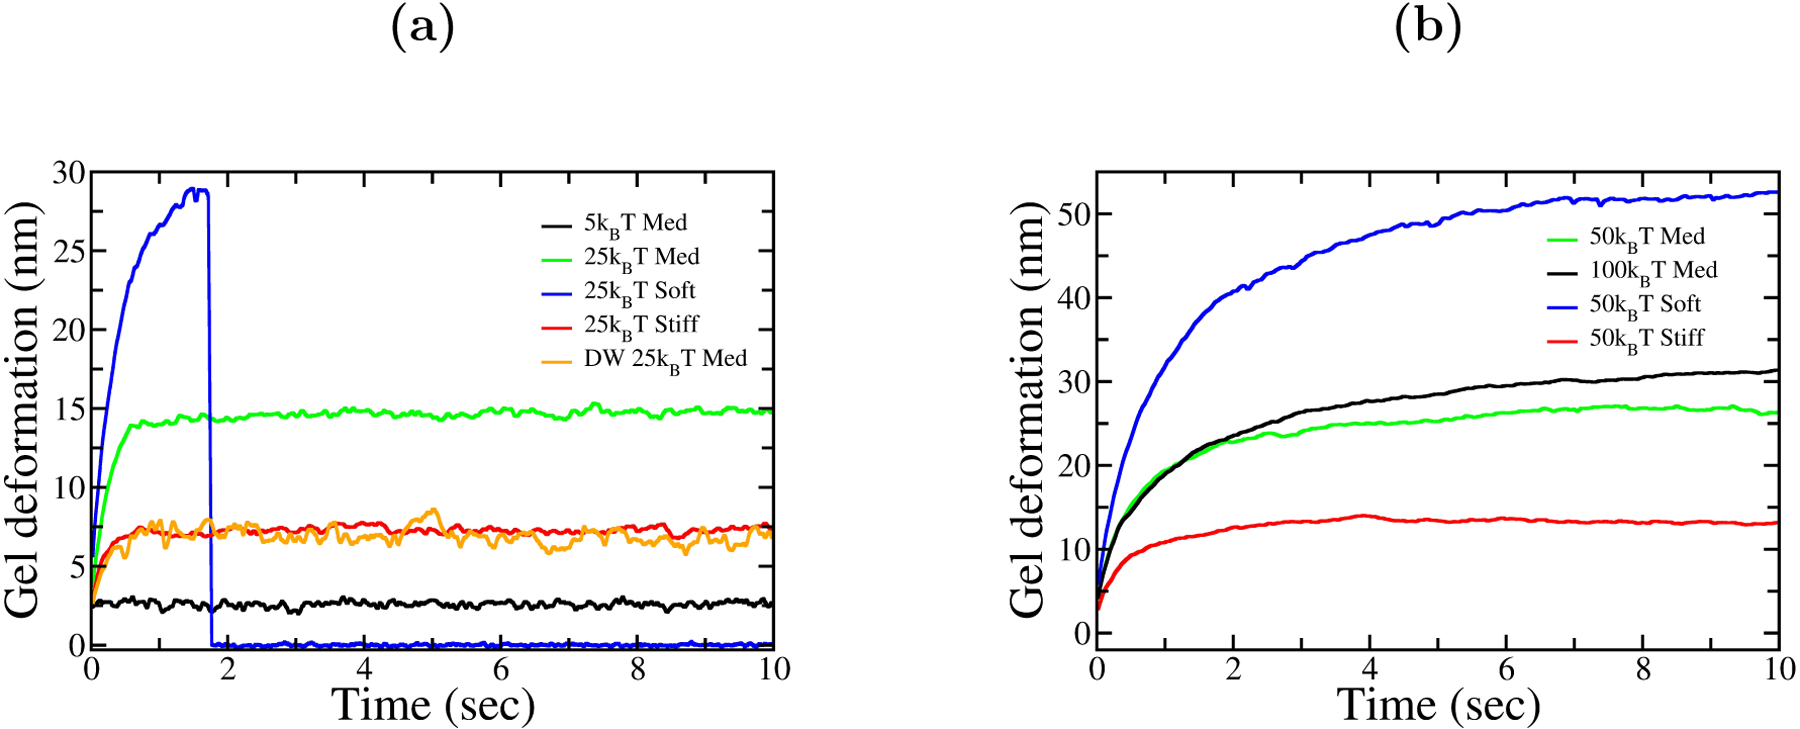
Gel deformation vs. time, for different puller depths and elasticity factors. Softer gels deform further and faster, and have higher chances of rupture.
The time tmax that it takes the force to build up to near its maximum value, or equivalently the time required to reach near maximum deformation, can be roughly estimated using dimensional analysis. We take the maximum force Fmax to be determined by the total gel deformation Δuz, the actin gel Young’s modulus E, and the radius R (≃60 nm in our model) of the gel. Further assuming that Fmax is proportional to ΔuzE, dimensional consistency requires that Fmax = (constant) × ΔuzER. Taking filaments to grow at their zero-force values up until the stall point, we have . Then
| (15) |
Then The inverse proportionality of tmax to E is seen in Figs. 4 and 5, where the force and deformation reach their maximum values for stiff gels faster than for softer gels. The numerical values predicted by Eq. 15 are not expected to be accurate, but tmax is estimated to be about 0.8 sec for the case of the medium gel and a 50kBT puller. By comparison, the time required to reach half-maximum deformation in the simulations is about 1 sec.
3.2. Effects of transient attachment of pushers to obstacle
It is believed that the WASP family of proteins, and their yeast homologue Las17, create weak transient attachments between filament tips and membrane [45]. We thus calculate how adding a potential well to the pusher potentials affects the magnitude of the pulling force. Fig. 6 shows the magnitude of the total pulling force as a function of the pushers’ well depth. For each point the mean value is calculated from the last seven seconds of a ten-second run, to minimize contributions from the equilibration period. The error bars are obtained as the standard deviation of the mean of force values from seven consecutive one-second pieces of these runs. Thus they include both random error and some component of systematic error. For both 25kBT and 50kBT pullers, the force drops as pushers binding to the obstacle becomes stronger, and the fractional effect is larger for weaker puller potentials. At a well depth of 10kBT , the drop in total pulling force corresponds to about 1 pN per pusher. Thus the total pulling force is significantly stronger when pushers have purely repulsive interactions with the membrane.
Figure 6.
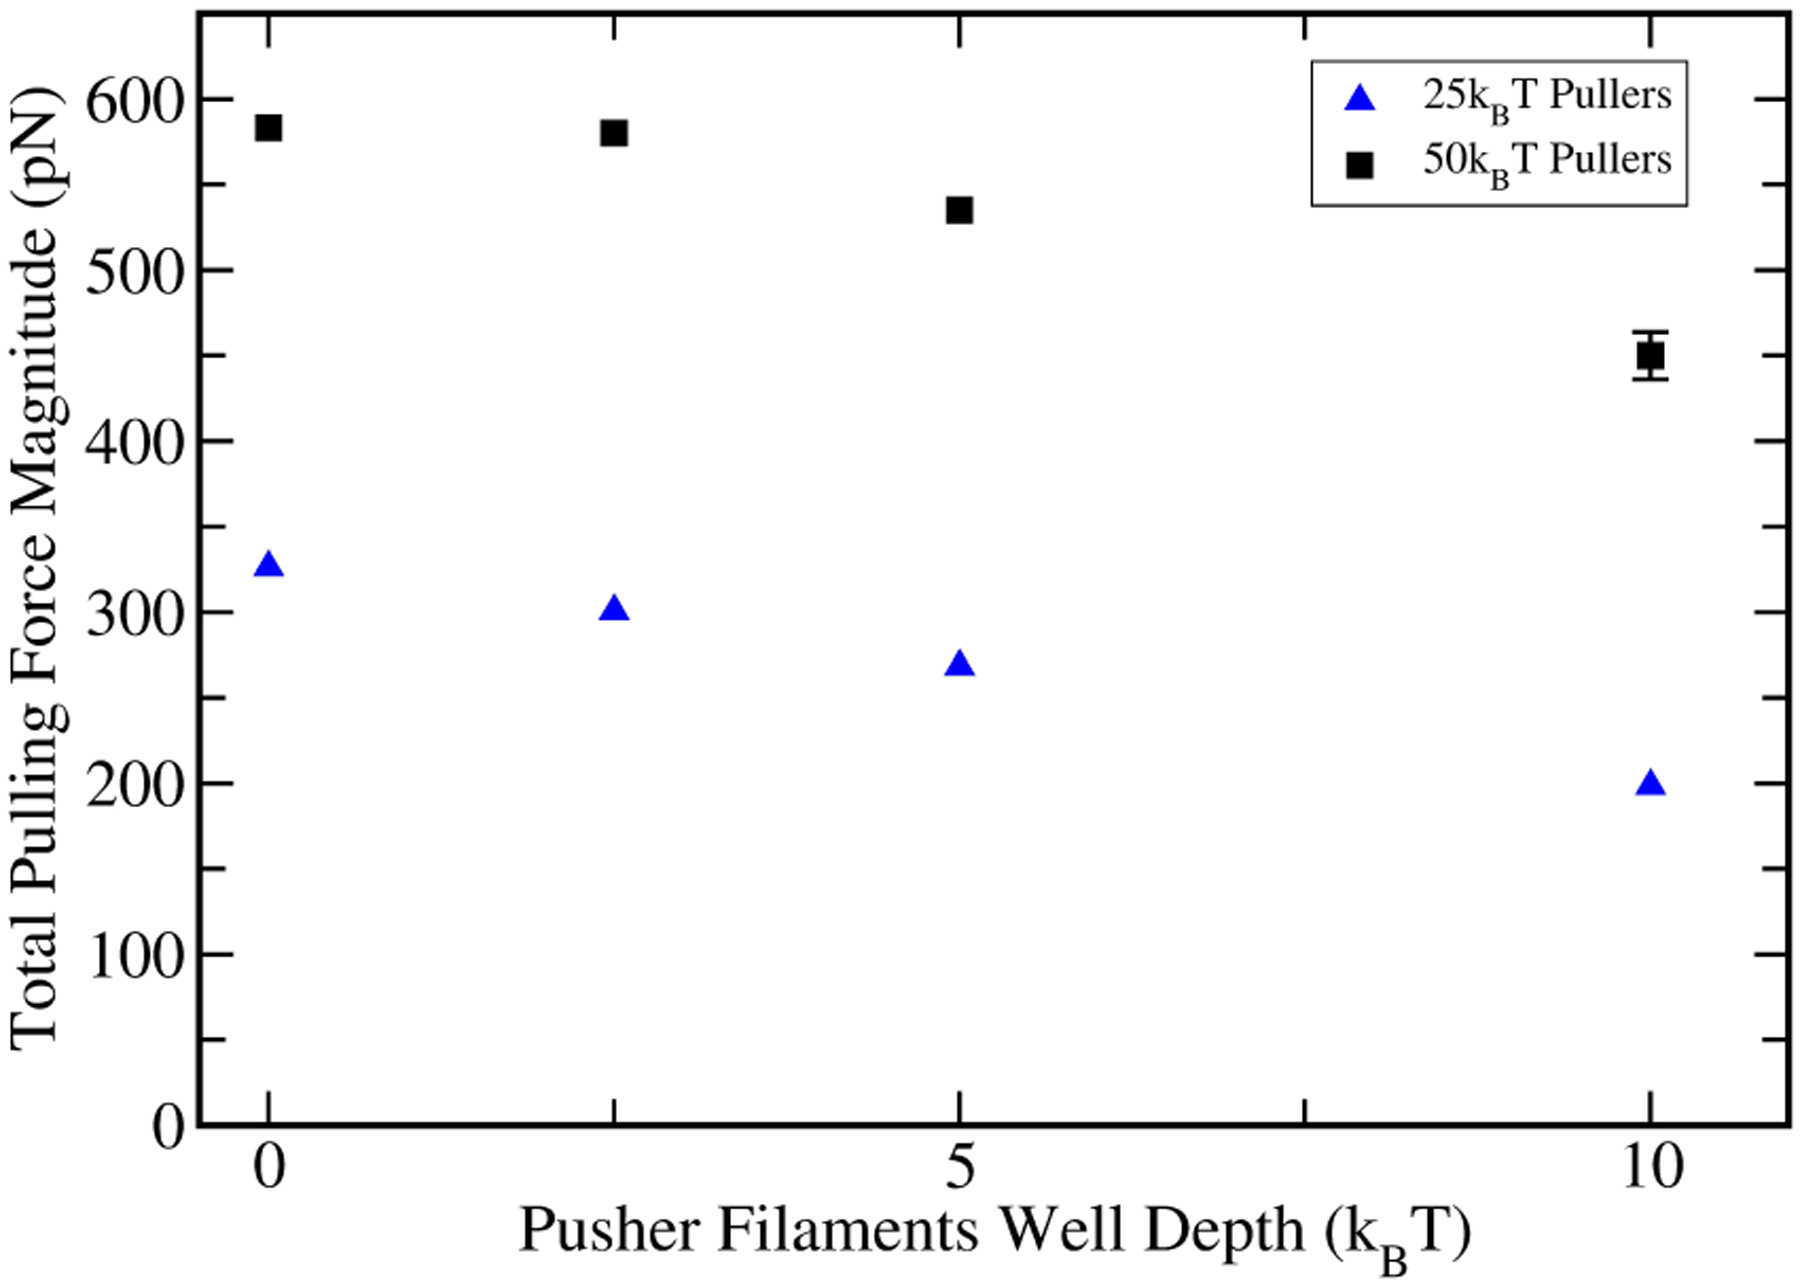
The effect of a variable potential well for pushers, representing transient attachments to the obstacle, on force generation.
3.3. Force distributions
To explore possible spatial variations of the pulling and pushing forces, we present their spatial distribution using heat-map diagrams. Because the simulations are stochastic, the distributions obtained over a finite time interval (Fig. 7a) display noticeable fluctuations. To show the systematics of the distributions more clearly, we create symmetrized force distribution heatmaps by averaging the filament forces over symmetrically related subsets (Fig. 7b). For example, the symmetrically averaged force for a filament with coordinates (x, y) includes contributions from filaments at (±x, ±y) and (±y, ±x). We consider the case of 50kBT pullers, which gives close to the limiting pulling force. We see a fairly flat distribution in the pushing region (blue) balancing the total pulling force in the center (red).
Figure 7.
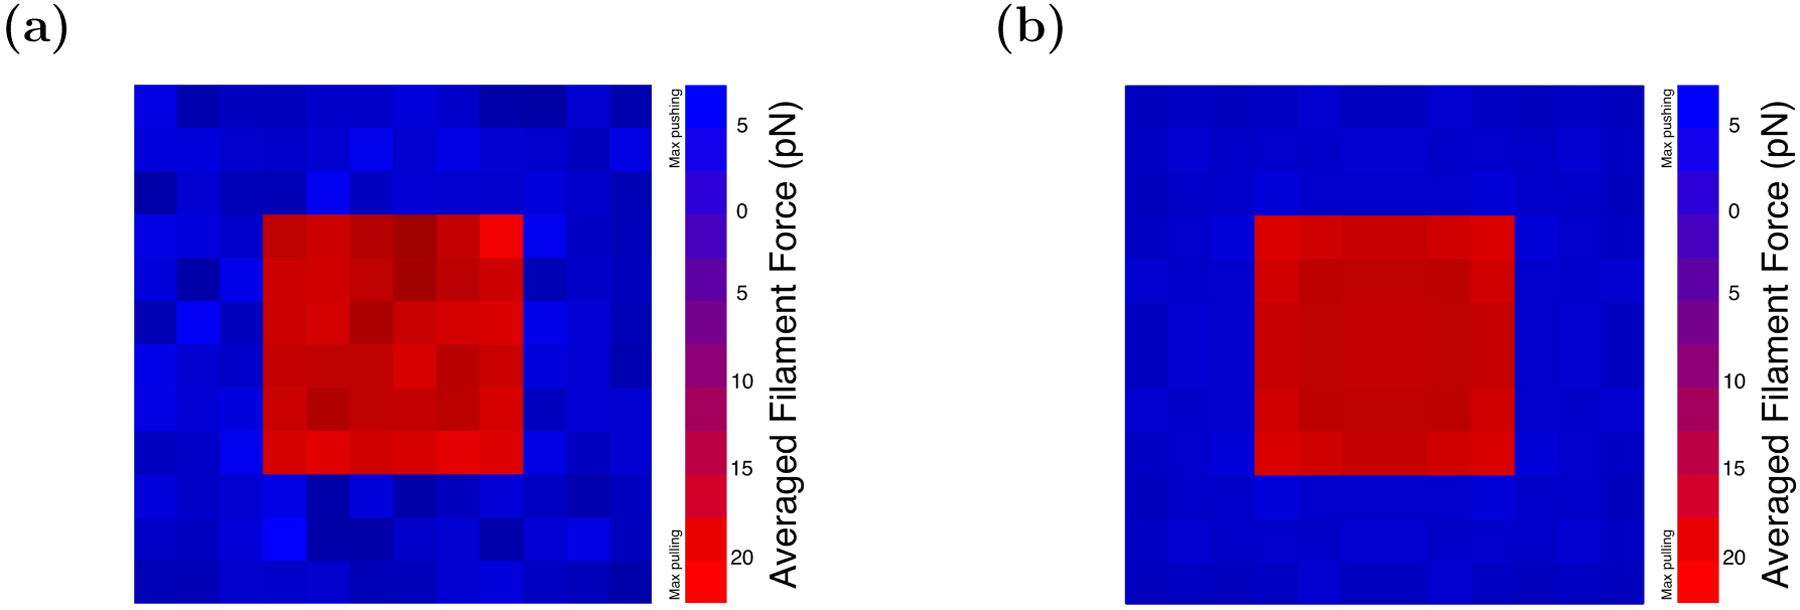
Heatmap diagrams of the force distribution of an array with 50kBT puller potentials and purely repulsive pusher potentials. Simulation time is 10 seconds. Frame a) is raw data; in frame b) we reduce the noise in the distribution by averaging forces of filaments that are symmetrically located with respect to each other.
Fig. 8 shows a cross section of the time-averaged force distribution along a row in the middle of the array, for four different potentials. As expected, the magnitudes of the individual pulling forces are always less than the average maximum force per pulling filament
The pulling and pushing force distributions are relatively flat in all cases except the double well potential. We believe this holds because in arrays with single-well pullers, all pulling filaments must grow at the same velocity once steady state is reached; since force determines growth velocity, all pullers must also experience the same force, and the force distribution is flat. In contrast, double well potentials have a velocity that is nearly force-independent after the pulling force reaches a certain magnitude [25]; therefore a range of forces is compatible with a certain velocity, so equality of growth between pulling filaments does not necessarily lead to a flat distribution of force. This is seen in the “DW 25kBT ” data points in Fig. 8.
Figure 8.
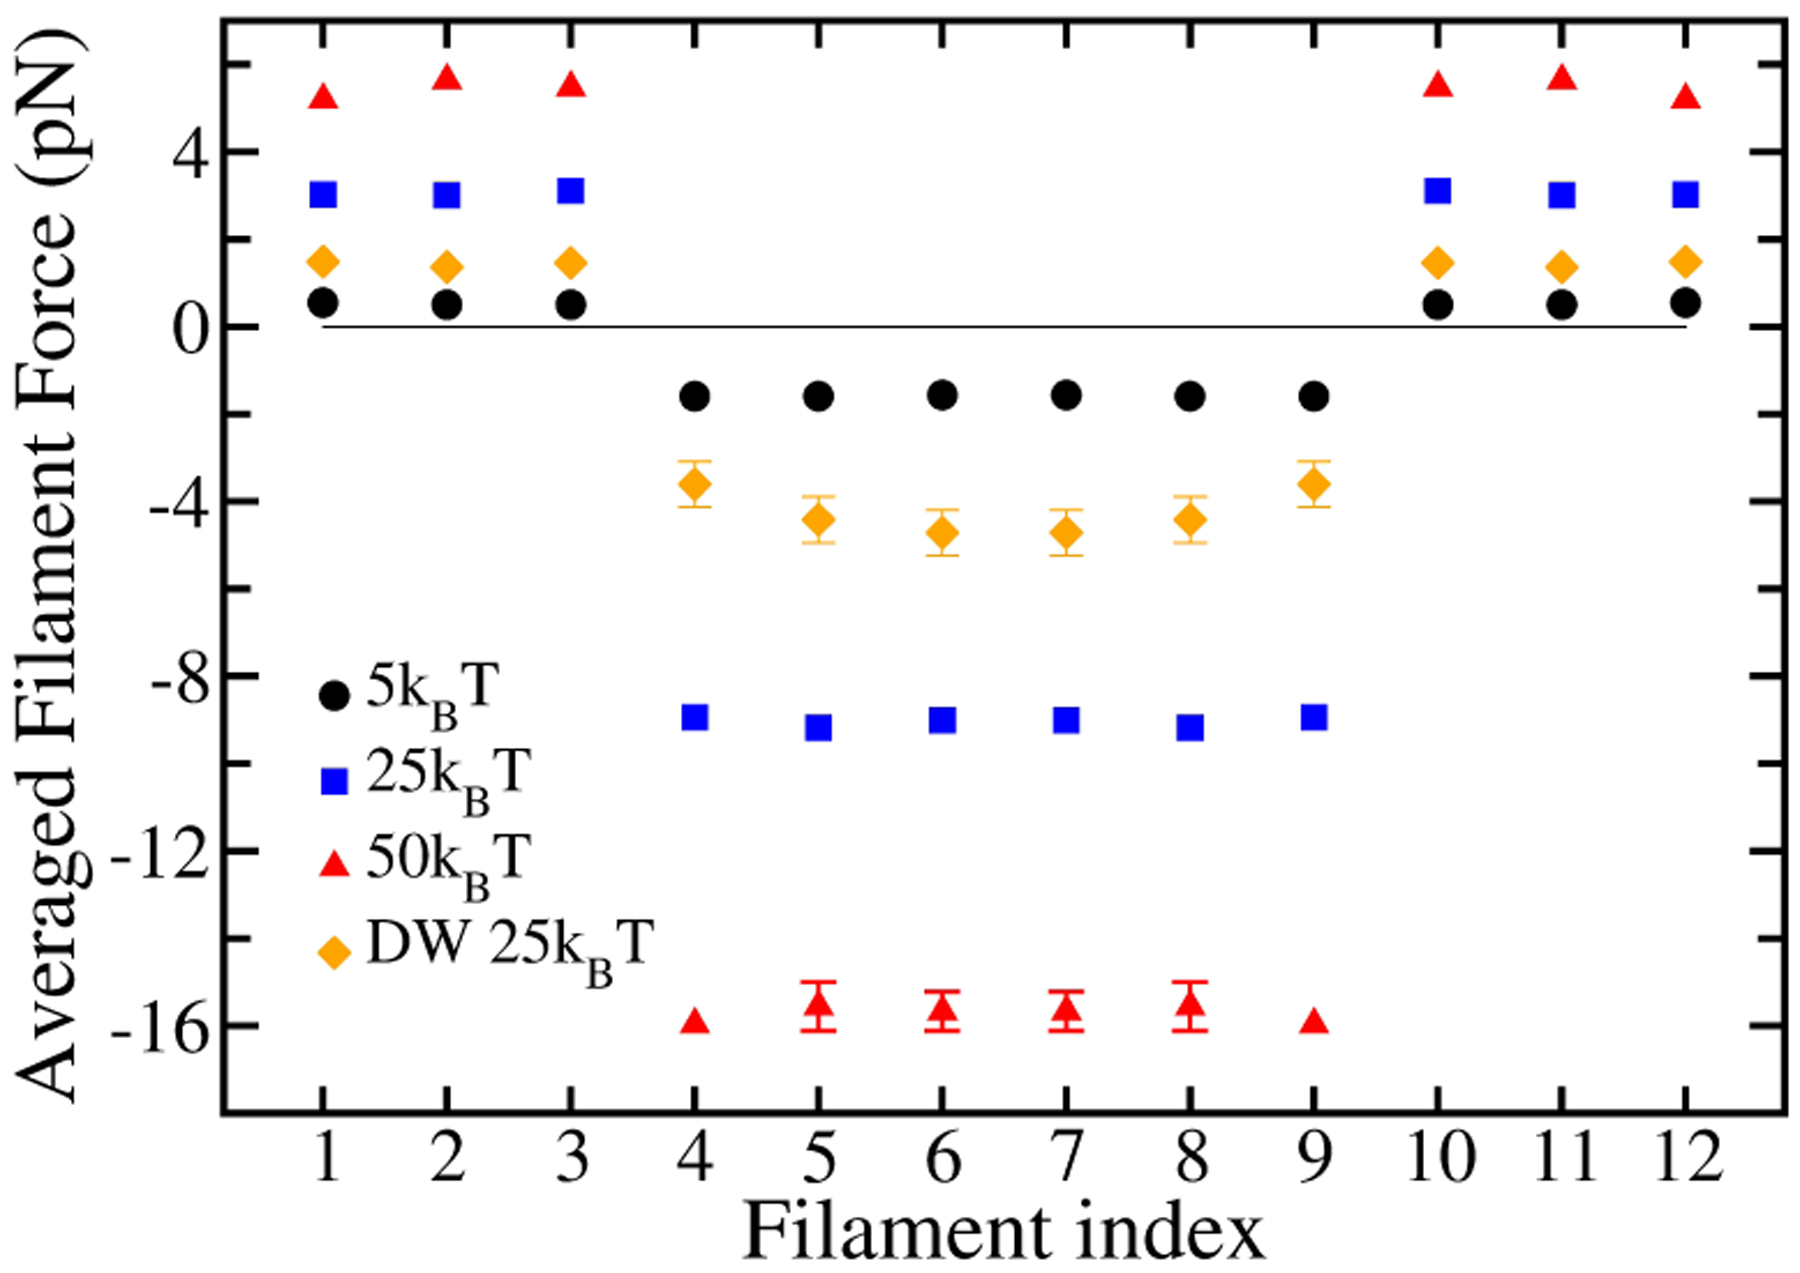
Comparison of force distribution profiles of a cross section of array, with medium gel stiffness and for different puller potentials. Error bars are smaller than the symbol size except where indicated.
The force distribution extracted from EM images of invagination shapes (Fig. 8b of Ref. [22]) shows a flat distribution over the pulling region similar to our prediction. However, the extracted force profile shows a ≈ 30% hump in actin force density at the edge of the pushing region (r ≈ 50 − 80 nm). We do not see this hump in our simulation results. We believe that the hump results from the hemispherical geometry assumed in Ref. [22]. This choice makes it easier to shear the gel near the edge of the hemisphere, because it is thinner there. This should in turn reduce the magnitude of the forces. In the present model, we have taken all filaments to be elastically equivalent, which makes the resistance to shearing the same everywhere. Given that the hemispherical shape itself is an idealization, we do not feel that weakening the shear strength near the boundary to mimic the hemispherical shape would render the model more realistic.
Fig. 9 shows the time evolution of the force distribution for the case of 50kBT pullers. The “Early” stage shows the forces averaged over the 1s < t < 2s interval of a 10-second long simulation. As seen in Fig. 4b this stage is well before steady-state, explaining why the distribution has not reached its asymptotic constant value. The filaments at the edge of the pulling region show enhanced forces at this stage. We believe this occurs because at the early stages of the simulation, the forces are not yet strong enough to slow polymerization greatly. Then all the pullers will have added roughly the same number of subunits, and all the pusher filaments will have added a constant number of subunits (larger than the value for the pullers). The corresponding gel deformation will have a constant value in the puller region and a different constant value in the pusher region. Maintaining the difference between these deformations requires a force dipole at the boundary between the pusher and puller regions, which we believe explains the peak in the force seen in the “Early” results. The “Late” stage is closer to the asymptotic one, as the network approaches steady-state. The “Middle” stages has force peaks similar to those seen in the “Early” results, but also has a bump in the middle, for which we do not have a simple physical explanation.
Figure 9.
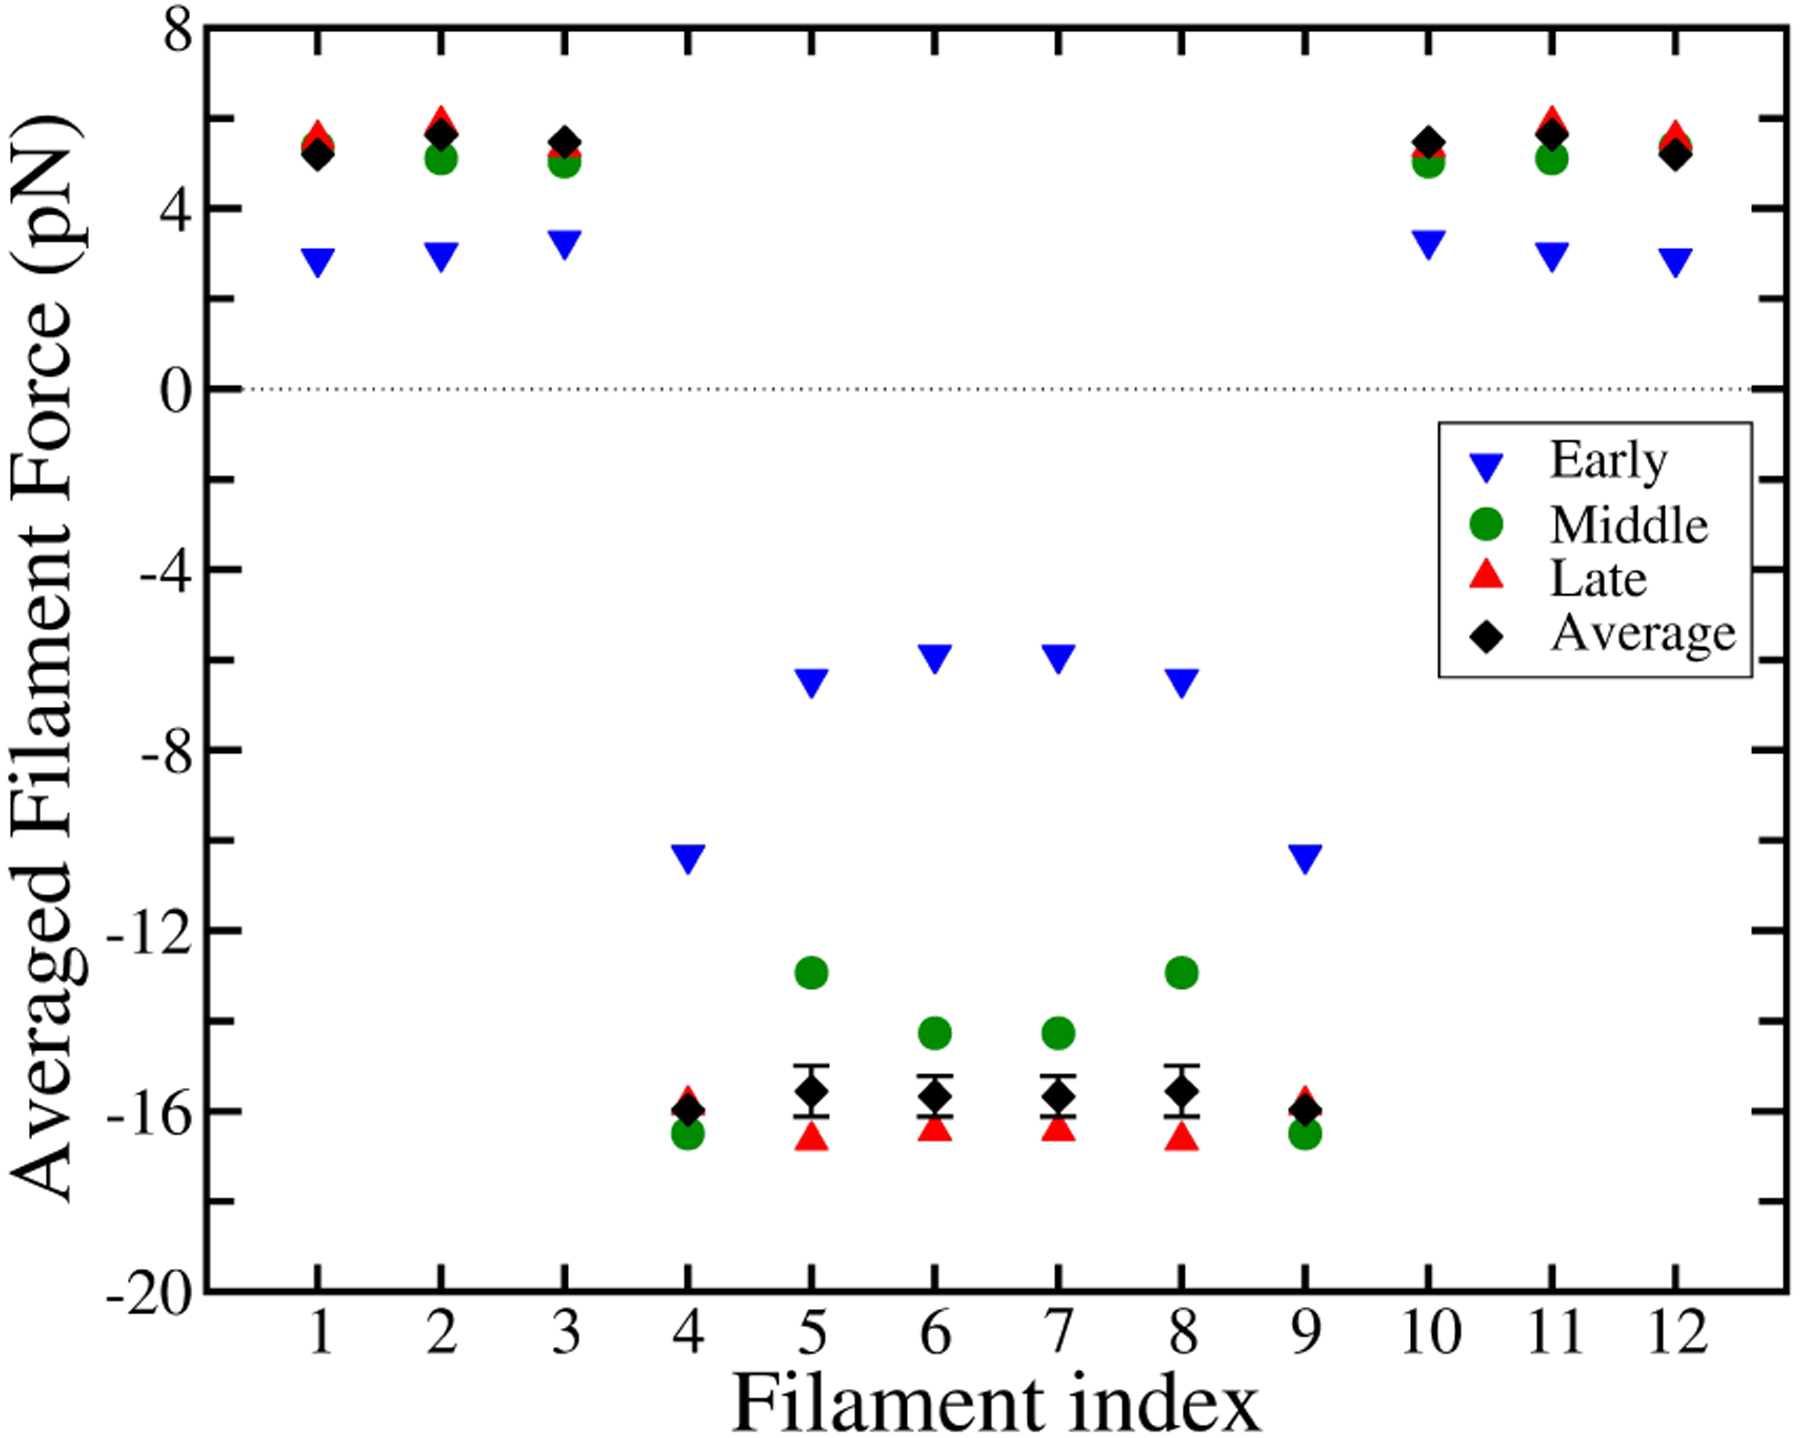
Time development of the force distribution of a middle row, with 6 × 6 array of 50kBT pullers. Early stage (blue triangles) corresponds to the average force within 1–2 sec time interval, middle stage (green circles) 5–6 sec, and late stage (red triangles) is 9–10 sec, in a 10 second-long simulation. Black diamonds are the full time-averaged force. Error bars on full time-average data points are smaller than symbol size, except where indicated.
3.4. Mean-force theory
To clarify the mechanisms determining the magnitude of the pulling force, we study a simplified mean-force model based on the force-velocity relations of separate puller and pusher ensembles. In the full system simulations, 108 pushers and 36 pullers exert force on the obstacle simultaneously. The forces exerted by the pullers experience fluctuations in time due to the polymerization dynamics of the pushers, and vice versa. However, on average, the magnitude of the force felt by the pushers equals that felt by the pullers. One would then expect the steady-state force to have the value at which the puller and pusher growth velocities are equal. To explore this hypothesis, we developed a mean-force model based on two force-velocity relations vpush(F) and vpull(F). Here F (positive) is the magnitude of the time-averaged total force felt by either the pullers or the pushers. We calculate vpush(F) and vpull(F) by performing pusher-only or puller-only simulations using an external force of magnitude F , with the force pointing in opposite directions in the two cases. The condition determining F is that vpush(F) = vpull(F ). The value of F satisfying this condition is obtained by linear interpolation from a finite set of force calculations. Fig. 10 shows the curves of vpush(F) and vpull(F), as well as the comparison between the predicted force from mean-force model with that of the full-system simulations. As is clear from Fig. 10a, slow puller growth will bring the crossing point between the F-V curves in Fig. 10a down and to the right, increasing the pulling force. On the other hand, slowing the growth of pushers will bring the crossing point down and left, reducing the pulling force. As Fig. 10b shows, the mean-force model closely predicts the results of simulations with a full array of filaments, over a range of puller potentials. This result suggests that the time fluctuations of the forces from pushing filaments may not crucially impact the growth velocity of the pullers, and vice versa.
Figure 10.
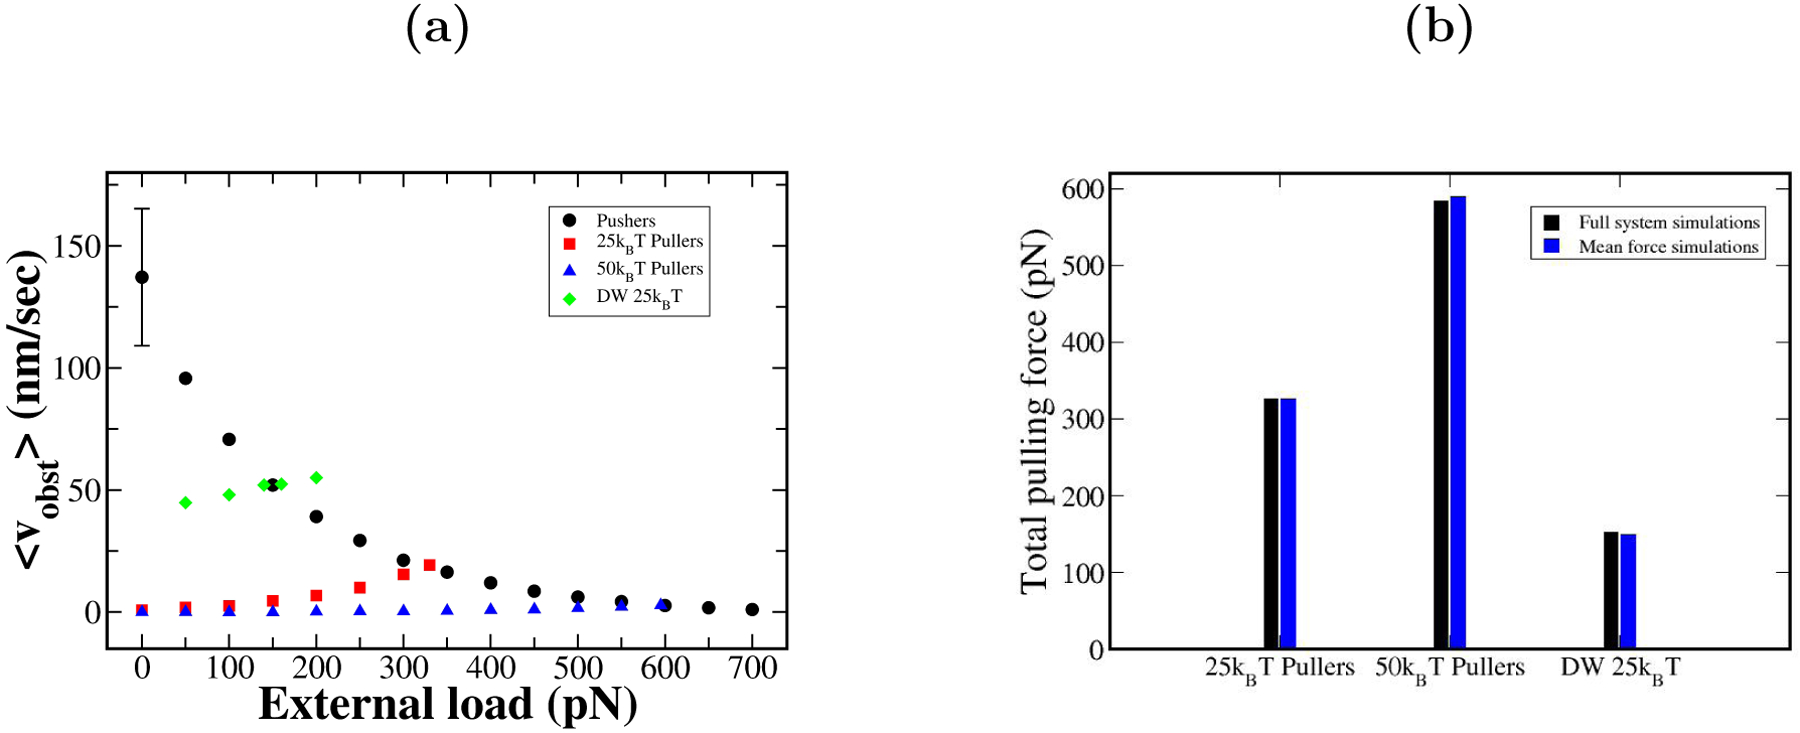
a) F-V plots of mean-force simulations of 108 active pushers and 36 active pullers (red, blue, and green points) with different potentials. Force at the crossing point of pusher and puller curves is the generated force predicted by mean-force model. b) Comparison of mean-force model to simulations with all filaments actively interacting with obstacle.
This analysis shows that a large pulling force will occur when the puller filaments slow pusher filaments’ growth by a large factor. The maximum force occurs when the puller filaments’ growth stops completely, stalling the pusher filaments. Fig. 11 shows the relationship between total pulling force and average growth velocity of the central filaments. As the plot shows, even a growth rate as low as 10% of the free filament velocity can reduce the generated force substantially, by > 40%. As described in the Discussion, this is important for ascertaining the effect of viscous flow on force generation.
Figure 11.
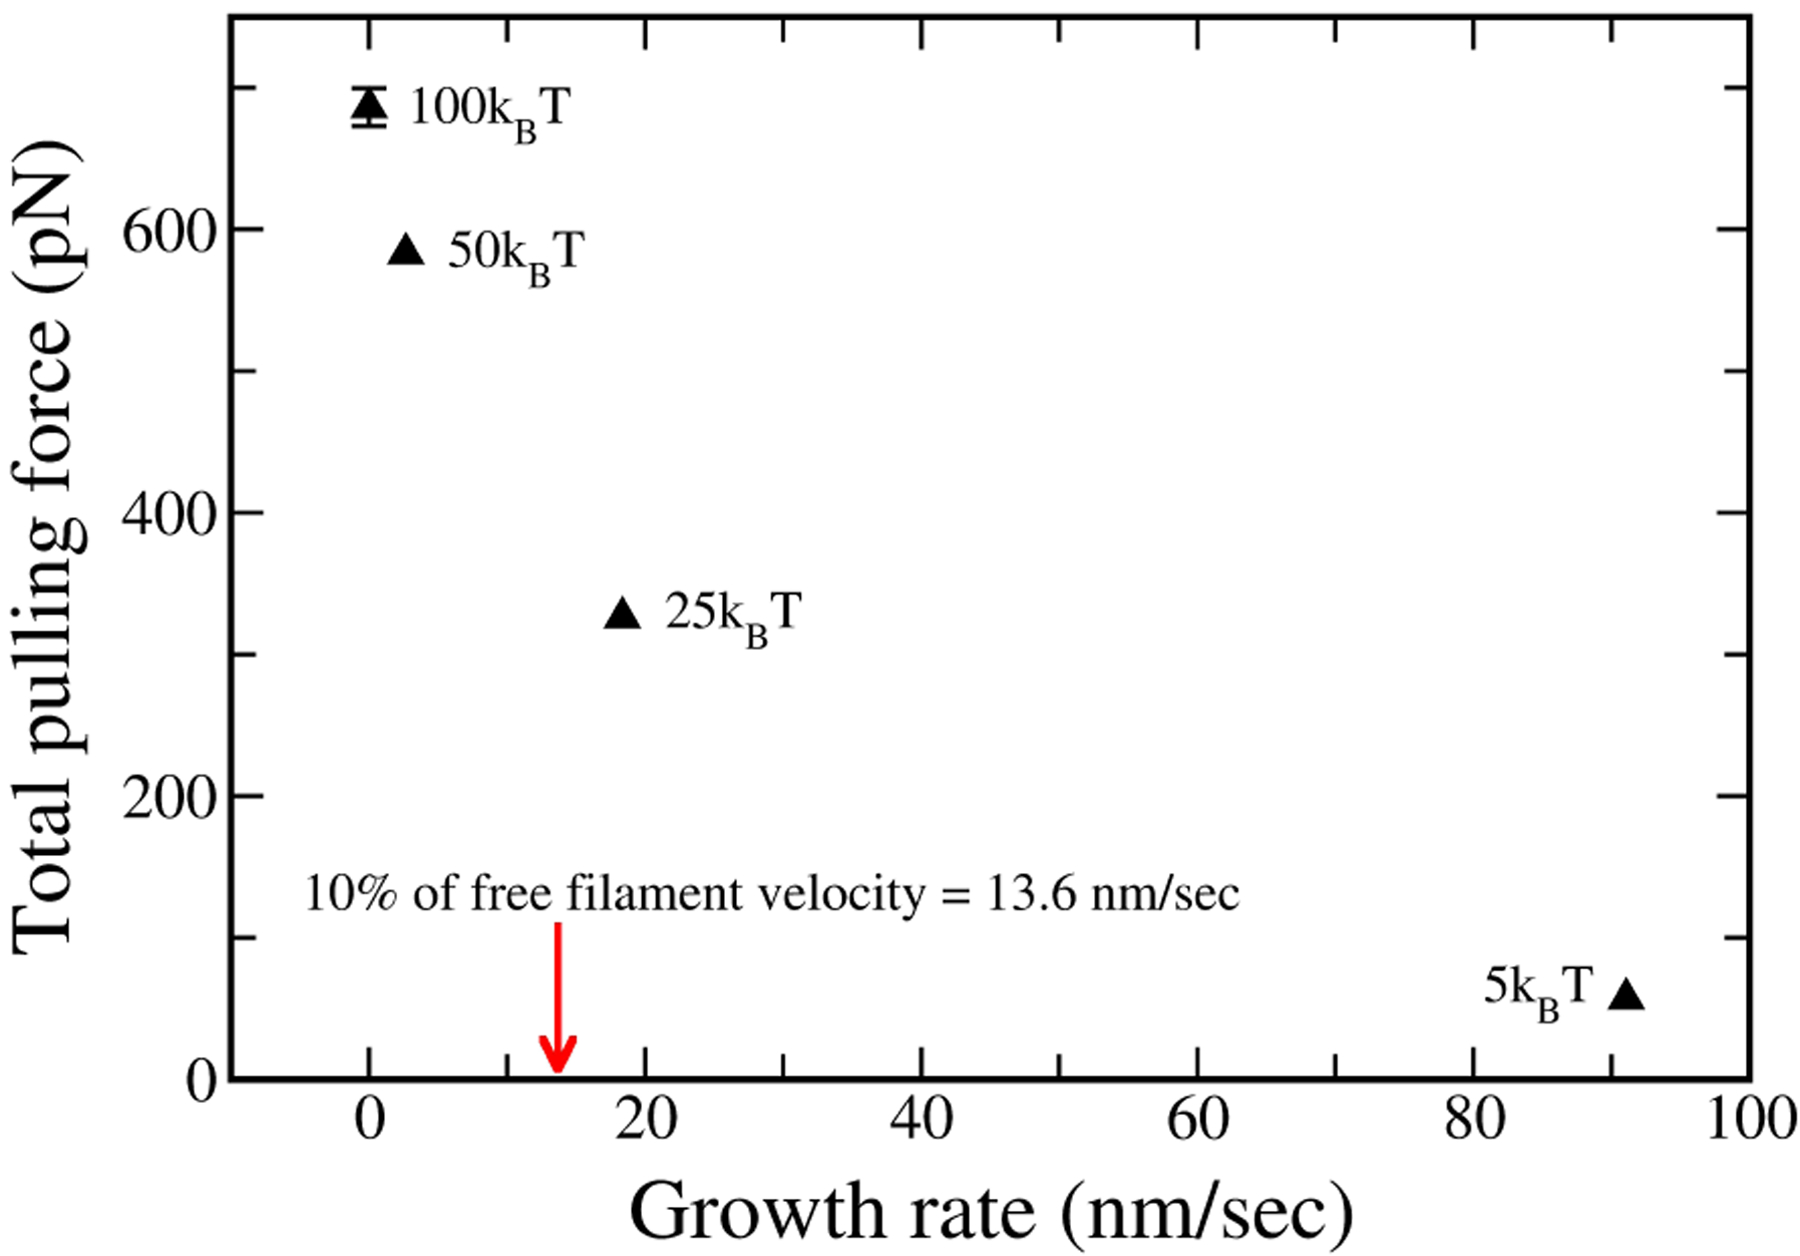
Total pulling force vs. central filaments growth rate. Maximum force is generated when pullers slow pusher filaments growth by a large factor.
3.5. Effect of mechanical parameters on extent of actin polymerization
We find that softening the gel increases the extent of actin polymerization required to reach a certain force. Fig. 12 shows the number of subunits added to all of the filaments in the array during the course of the simulation. We compare different gel stiffnesses and potential depths at a given value (270 pN) of the force, about 80% of the maximum force for 25kBT pullers. The total amount of actin polymerization is increased by about 160% for both 25kBT and 50kBT pullers going from a stiff gel to a soft one. In addition, ≈ 40% more actin is polymerized for a medium gel at the same force of 270 pN when the pullers’ potential depth is halved from 50kBT to 25kBT . This increase is smaller for soft and stiff gels (≈ 25%). The black ”No obstacle” bar corresponds to the amount of polymerization obtained after 0.5 sec (the average time it takes for the force with 25kBT pullers to reach 80% of maximum) if no pullers are attached to the obstacle.
Figure 12.
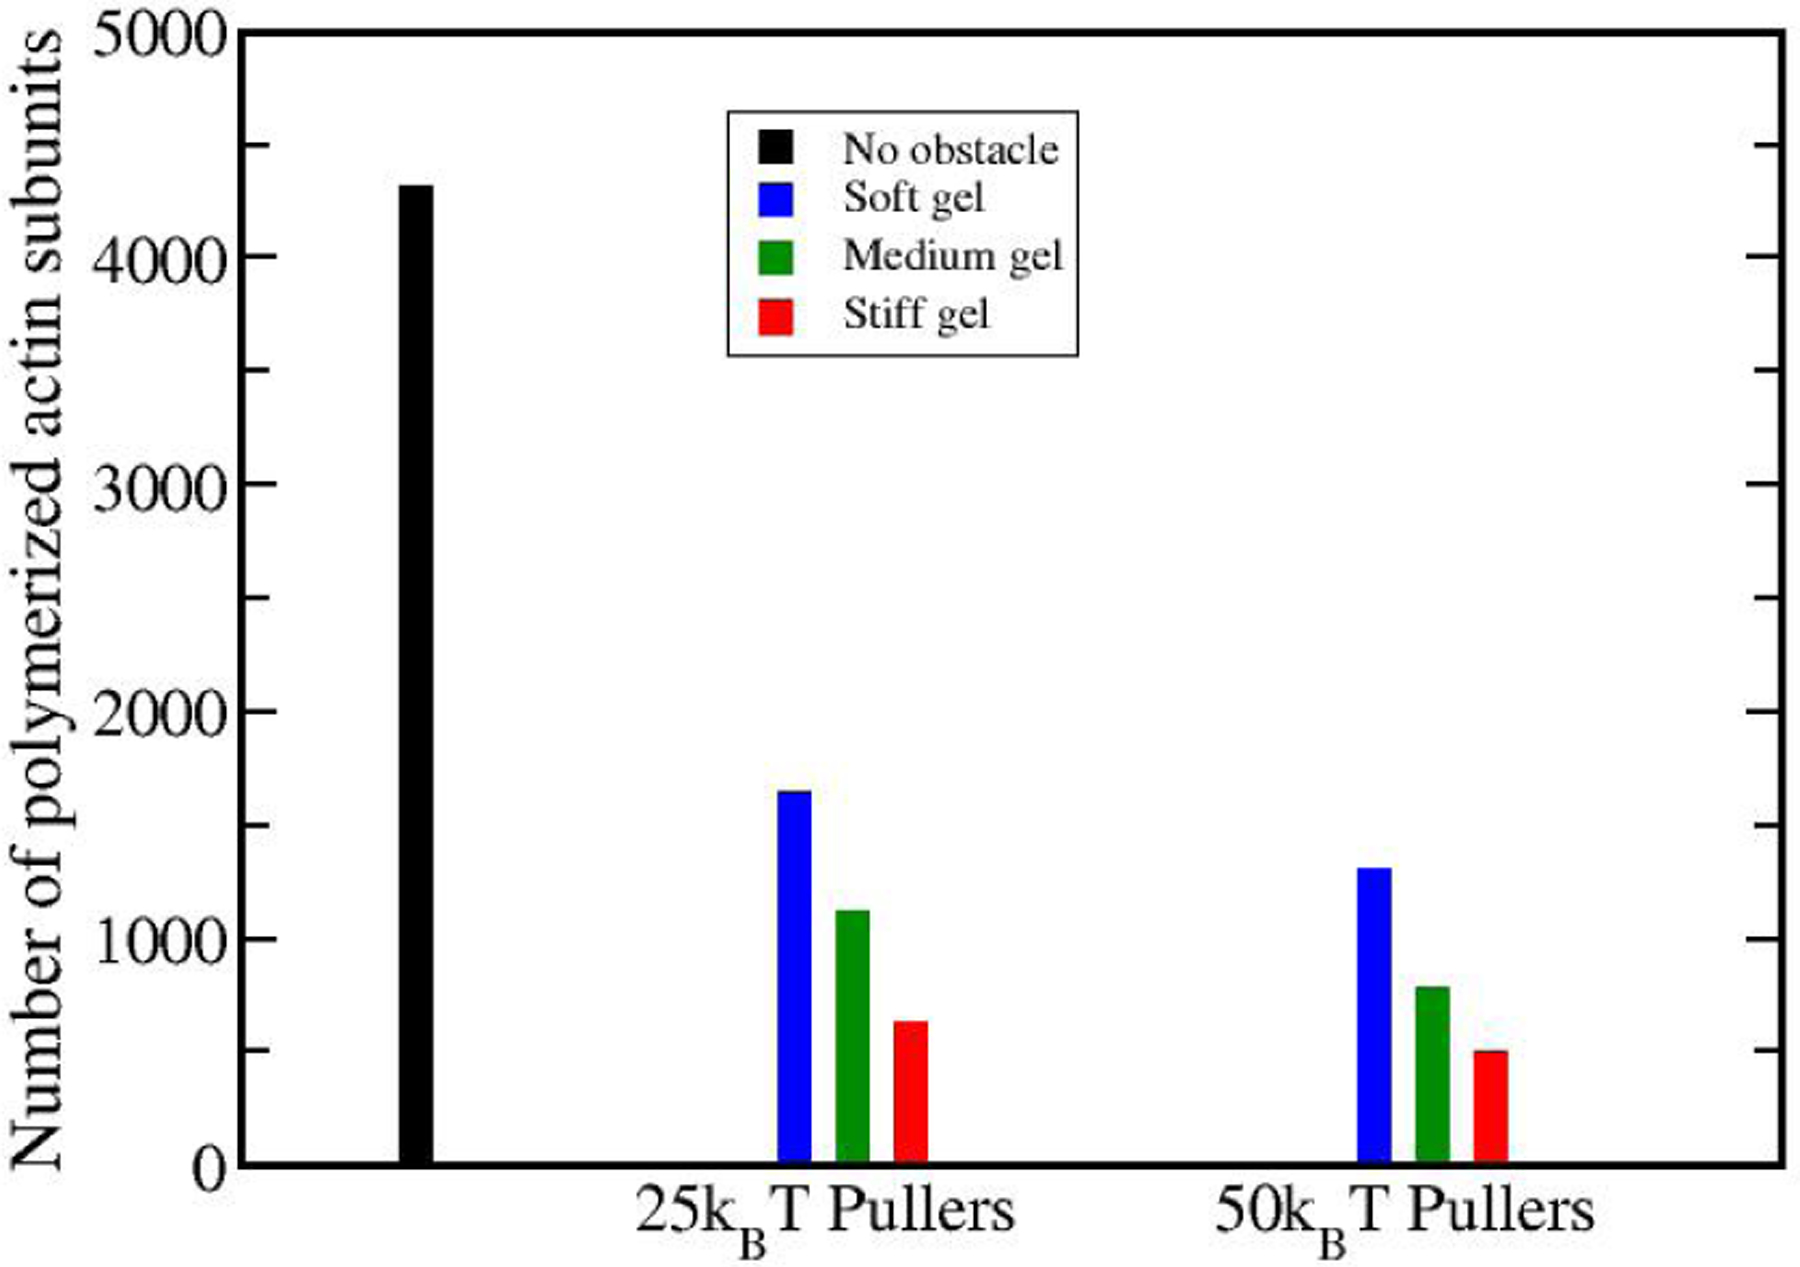
Total number of polymerized subunits at the time when the force reaches 270 pN, for different stiffness levels and puller depths. Softening the gel increases the actin polymerization amount. Strengthening the pullers’ binding to the membrane decreases the actin polymerization amount. Black bar shows the amount of actin polymerization for a 12 × 2 array of free filaments, i.e. in the absence of an obstacle.
3.6. Obstacle-gel detachment
Our finding of obstacle-gel detachment in some parameter ranges is surprising, given the magnitude of the potential and the number of filaments. Consider the case of a completely rigid, solidly anchored gel. Standard reaction rate theory [46] gives an analytical estimate of the escape time of the obstacle from the potential well:
| (16) |
Here w and ΔU are defined in Fig. 13, where a positive external force of 335 pN (which caused detachment in Fig. 4 above) pulls on a 6 × 6 array of rigid pullers with 25kBT potential wells and staggered initial alignment. In this case, w ≈ 5 nm, Dobst = 104 nm2/sec (as above), and ΔU ≈ 180kBT . Thus, Eq. 16 gives an extremely long time of ≈ 4 × 1075 sec for the obstacle to detach from these pullers, so detachment essentially never happens. Consistent with this prediction, when the actin gel is stiff and the binding energy is ⩾ 25kBT , our simulations find that obstacle-gel detachment never occurs during 10-second simulations. However, softening the gel or weakening the puller-filament binding can lead to detachment before steady state is reached, as was seen in Figs. 4 and 5 for the 25kBT soft-gel case. Thus a soft actin network behaves differently from stiff networks in that it detaches more easily from the obstacle. We evaluated detachment in 40 different runs for the 25kBT soft-gel case. We found the distribution to be peaked with an average value of 1.7 s and a standard deviation of 0.3 s. The distribution does not have the exponential form that would result from a stationary Poisson process. We believe that the peaked behavior in this case means that the detachment occurs rather rapidly once the force has reached a sufficient value to drive detachment, which occurs near 1.7 s.
Figure 13.
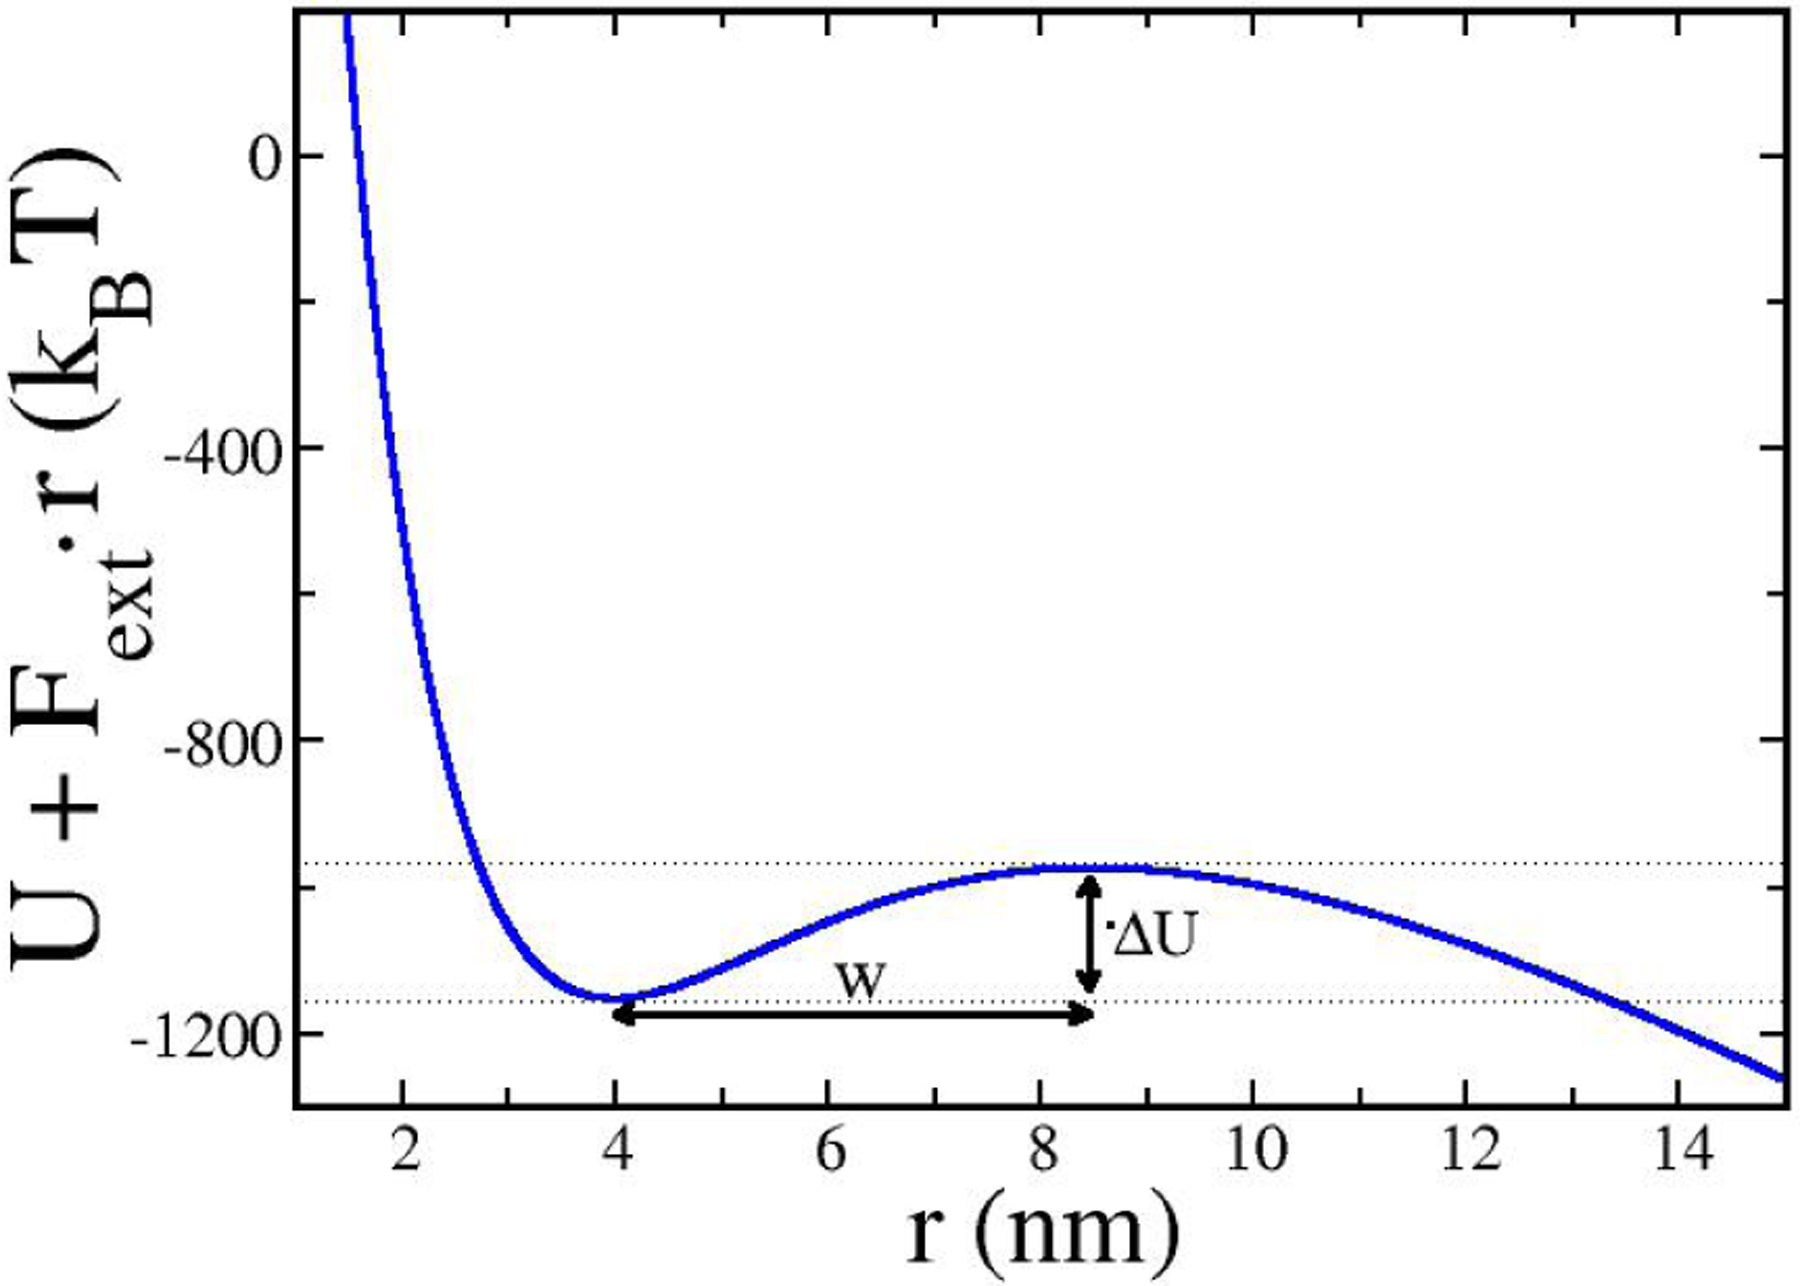
Total obstacle interaction potential from a 6×6 array of pullers with 25kBT wells plus potential from an external pulling force of 335 pN on the obstacle; w and ΔU are parameters used in Eq. 16.
To understand the detachment process in more detail, we performed puller-only stimulations with an external force acting on the obstacle. In a particular simulation with 25kBT pullers in a gel with medium elasticity, with an external pulling force of 335 pN on the obstacle, the obstacle detached from the gel after about 6.5 seconds. To understand the origin of this effect, we look at the distribution of r, the gap between filament tips and obstacle, during a few time steps right before the rupture happens. Fig. 14 shows frames of a heat-map plot of the distribution of r for the pullers. Larger r values (greater stretching) have redder pixels. Frame a) is at a time well before rupture, to show the baseline appearance of the distribution. Frames b) through m) span 12,000 time steps, corresponding to 6 microseconds. The number of pink pixels increases gradually during this period, indicating the appearance of possible detachment nucleation points around the tip of the actin filaments. The accumulation of these nucleation points eventually spreads from the right bottom corner over the entire pulling region, and the obstacle detaches completely. This is reminiscent of the process of a crack propagating between two dissimilar materials due to stress concentration at the edge of the crack.
Figure 14.
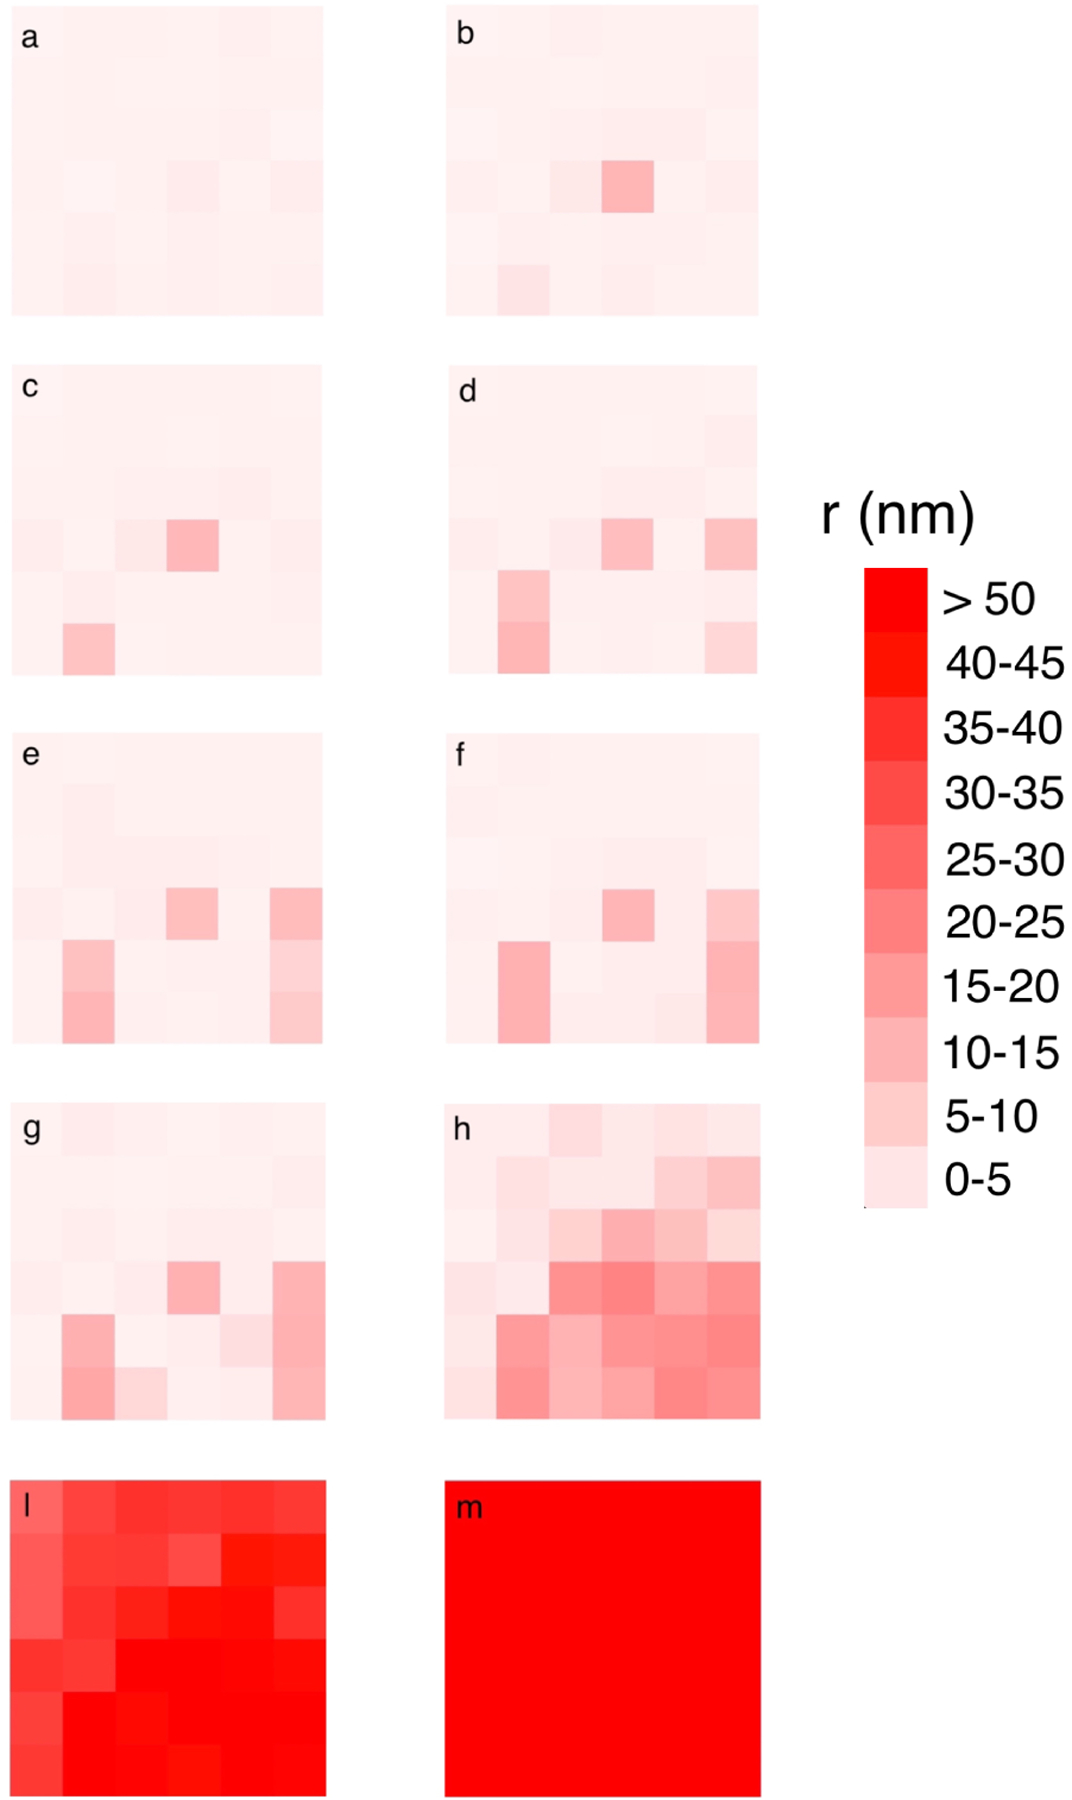
Distribution of r-values for pullers with 25kBT binding in a medium-stiffness gel. Redder pixels correspond to larger r values. Frame a is the baseline distribution, at a time well before the rupture. Frame m is the distribution after the obstacle detaches completely. Frames b through m span 12000 time steps, a total of 6 microseconds. Accumulation of nucleation points around several filament tips (frame h), which takes place in a time in the order of microseconds, leads to detachment.
Some light can be shed on the effect of gel stiffness on the detachment process via the “Griffth” theory of the critical stress for fracture [47]. The Griffth theory describes how stress concentration at a crack tip aids crack propagation. The stress σc required to propagate a crack of length lc is given by
| (17) |
where γ is the energy density required to break the bonds along the crack. In this criterion, σc increases with E, consistent with our finding that stiff gels do not detach from the membrane. In applying it to the actin-filament system, we take γ to be the ratio of the puller potential depth to the area a2 per filament. Since we are studying an incipient crack, we take lc = a = 10 nm. For a puller potential well depth of 25kBT , using the value E = 0.140 pN/nm2, we obtain σc= 0.095pN/nm2. By comparison, the stress at a force of 335 pN, for which detachment occurs in the simulations, is σ = 0.17pN/nm2. Given the small size of the simulation system and the absence of a well-defined preexisting crack, this level of agreement is reasonable.
4. DISCUSSION
Our calculations show that actin-based pulling force generation can result from spatially separated ensembles of filaments having different growth velocities. The slower-growing filaments exert pulling forces on the membrane, while faster-growing filaments exert pushing forces. Large pulling forces are generated if the velocity of pullers at a given force is much smaller than that of pushers. When the pullers do not grow at all, the total pulling force is maximized and equals the sum of the stall forces of the pushing filaments. The mechanism explored here for generating slower puller-filament growth is a stronger binding to the membrane, but others may be relevant. A mean-force model treating pushers and pullers separately with constant forces reveals in more detail how the pulling force is determined by the difference between the puller and pusher force-velocity relations. It accurately predicts the total pulling force from full-system simulations, suggesting that time statistics of the force generation are not important for the final results. Our key specific findings are the following:
The pulling force is reduced by growth in the pulling region, viscous deformation of the actin gel, and transient attachment of the pushers to the membrane.
When the binding of puller filaments becomes weaker and they grow faster, the pulling force drops rapidly (Fig. 4). A similar effect would be expected from viscous flow of the actin gel. Fig. 11 shows that a growth rate of 13.6 nm/s is sufficient to reduce the pulling force by about 50%. Taking our model system to have a radius of about 60 nm gives a shear rate of about 0.2s−1. Since the pulling force per filament is on the order of 20 pN (see Fig. 8a) and the filament spacing is about 10 nm, the stress in the puller region is ~20pN/100nm2=0.2pN/nm2. Then substantial force reduction would occur if the actin gel viscosity becomes less than about 0.2 pNnm−2/0.2s−1= 1pN-s/nm2 = 106Pa s. This value is much higher than any that have been previously measured. However, the viscous properties of actin networks at the very high actin and crosslinker densities present in endocytic actin patches have not been explored quantitatively. Pulling forces are also maximized when the pushers’ interaction potential with the obstacle is monotonically repulsive (Fig. 6), which gives the largest growth velocity [25]. Transient attachments of the pushers to the obstacle slow their growth and thus inhibit pulling force generation.
Effect of actin gel mechanical properties on pulling-force generation.
In the steady-state limit, the magnitude of the pulling force is independent of the actin gel stiffness over the range studied, provided that obstacle-gel detachment does not occur (Fig. 4). However, large forces are obtained at earlier times for stiff gels. This suggests that invagination should be slowed by mutations reducing the number of crosslinkers. The endocytic event could also be aborted completely because the actin patch has a finite lifetime, which may be too short to allow the maximum force to build up. This is consistent with requirement of the yeast fimbrin homolog Sac6 for endocytosis in yeast [15, 16]. In Ref. [15], more than 70% of the endocytic sites in Sac6Δ cells were found to have a flat membrane profile. The majority of the remaining ones invaginated to a distance of ≈ 100 nm, but then retracted. The “retraction” phenotype could result from insufficient force building up during the lifetime of the actin patch. The slower buildup of force for the soft gels could also prevent endocytosis if viscous flow of the gel is important. Such flow during the period of force buildup might prevent the force from ever becoming large enough to overcome the turgor pressure.
Force distributions.
The steady-state force distribution profiles (Figs. 7 and 8) reveal a complete force balance between pushing and pulling regions, and fairly constant force densities over these regions. They are roughly consistent with the force profiles obtained from measured membrane deformations [22]. The time evolution of the force distributions shows enhanced forces at the edge of the pulling region at early stages, which are part of a dipole of forces surrounding the interface between the pusher and puller filaments. The force distributions could be measured using a combination of superresolution microscopy and suitably designed molecular force sensors. If a force sensor were inserted into Sla2, and the signal from the force sensor measured using superresolution microscopy, a picture of the force distribution in the central Sla2 region could be obtained and compared to these predictions.
Effect of mechanics and filament-membrane interaction on actin polymerization.
We also find that the actin count is increased by either softening the gel or reducing the puller binding energy (see Fig. 12). We are not aware of data showing the effect of gel softening on the actin count, but an extreme version of reducing the puller binding energy is obtained in Sla2 deletion mutants. In these experiments, extensive actin accumulation has been observed in the form of “comet tails” [48, 49].
Detachment of pullers from the obstacle.
This effect can completely disrupt the force-generation machinery. We find that detachment does not occur for completely rigid gels. But for soft gels, it does occur as seen in Fig. 14 and described by Eq. 17. The process begins with an initial “nucleation” event in which one or more filament tips move out of the potential well binding them to the obstacle. This leads to stress concentration, and detachment then spreads over a microsecond time scale, in a mechanism analogous to crack propagation in a solid. These results suggest that softening the actin gel driving endocytosis in yeast by mutations reducing the number of crosslinkers could cause actin gel detachment from the membrane, aborting the endocytic event. This mechanism could provide an alternate explanation of the requirement for Sac6 in endocytosis [15, 16]. The detachment mechanism could be distinguished from the direct effect of gel softening by tracking the motion of patches of the actin proxy Abp1, in Sac6Δ cells. If the detachment mechanism operates, the patches will move into the cell rapidly; if the direct effect of gel softening are more important, the patches will remain at the membrane.
Acknowledgments
We appreciate informative discussions with Philip Bayly. This work was supported by the National Institute of General Medical Sciences (https://www.nigms.nih.gov) under Grant R01 GM107667 and the National Science Foundation (https://www.nsf.gov) under Grant Agreement CMMI:15-458571.
Appendix A: Estimate of kelast
The actin-gel spring constant kelast is obtained by fitting it to elastic restoring forces calculated for a square array of filaments where alternating filaments are displaced in opposite directions. This displacement is written as , where , and a is the lattice constant. The force density at the origin obtained by spreading the forces in the nearest-neighbor elastic model over the area of a square cell is
| (A1) |
To obtain from the elastic properties of the gel, we begin with the inverse problem of calculating the deformation in terms of the force. For a point force at the surface of a semi-infinite elastic gel with Young’s modulus E the displacement (Ref. [50], Chapter 1) is
| (A2) |
where we have taken Poisson’s ratio σ = 1/2 to correspond to an incompressible actin gel. To obtain the restoring forces for the given displacements, we first express this result in Fourier space:
| (A3) |
where J0(kr) is the circular Bessel function of the first kind and the Bessel-function integral is 1/k (Ref. [51], Chapter 8.41). More generally,
| (A4) |
where fk is the Fourier transform of the force. Since the magnitude of k for the alternating displacement is , Eq. A4 shows that
| (A5) |
Therefore, in real space, since we are only treating one wave vector,
| (A6) |
Comparing this with Eq. A1, we obtain
| (A7) |
The Young’s modulus for the actin gel has been roughly estimated as E = 0.14 pN/nm2 [22]. Thus Eq. A7 obtains the baseline value for the actin gel spring constant as kelas = 0.53 pN/nm.
References
- 1.Carlsson AE, 2018. Membrane bending by actin polymerization. Current opinion in cell biology 50:1–7. [DOI] [PMC free article] [PubMed] [Google Scholar]
- 2.Kovar DR, and Pollard TD, 2004. Insertional assembly of actin filament barbed ends in association with formins produces piconewton forces. Proceedings of the National Academy of Sciences 101:14725–14730. [DOI] [PMC free article] [PubMed] [Google Scholar]
- 3.Footer MJ, Kerssemakers JW, Theriot JA, and Dogterom M, 2007. Direct measurement of force generation by actin filament polymerization using an optical trap. Proceedings of the National Academy of Sciences 104:2181–2186. [DOI] [PMC free article] [PubMed] [Google Scholar]
- 4.Parekh SH, Chaudhuri O, Theriot JA, and Fletcher DA, 2005. Loading history determines the velocity of actin-network growth. Nature cell biology 7:1219. [DOI] [PubMed] [Google Scholar]
- 5.Bieling P, Weichsel J, McGorty R, Jreij P, Huang B, Fletcher DA, Mullins RD, et al. , 2016. Force feedback controls motor activity and mechanical properties of self-assembling branched actin networks. Cell 164:115–127. [DOI] [PMC free article] [PubMed] [Google Scholar]
- 6.Marcy Y, Prost J, Carlier M-F, and Sykes C, 2004. Forces generated during actin-based propulsion: a direct measurement by micromanipulation. Proceedings of the National Academy of Sciences 101:5992–5997. [DOI] [PMC free article] [PubMed] [Google Scholar]
- 7.Giardini PA, Fletcher DA, and Theriot JA, 2003. Compression forces generated by actin comet tails on lipid vesicles. Proceedings of the National Academy of Sciences 100:6493–6498. [DOI] [PMC free article] [PubMed] [Google Scholar]
- 8.Upadhyaya A, Chabot JR, Andreeva A, Samadani A, and van Oudenaarden A, 2003. Probing polymerization forces by using actin-propelled lipid vesicles. Proceedings of the National Academy of Sciences 100:4521–4526. [DOI] [PMC free article] [PubMed] [Google Scholar]
- 9.Proag A, Bouissou A, Mangeat T, Voituriez R, Delobelle P, Thibault C, Vieu C, Maridonneau-Parini I, and Poincloux R, 2015. Working together: spatial synchrony in the force and actin dynamics of podosome first neighbors. ACS nano 9:3800–3813. [DOI] [PubMed] [Google Scholar]
- 10.Goldenbogen B, Giese W, Hemmen M, Uhlendorf J, Herrmann A, and Klipp E, 2016. Dynamics of cell wall elasticity pattern shapes the cell during yeast mating morphogenesis. Open biology 6:160136. [DOI] [PMC free article] [PubMed] [Google Scholar]
- 11.Young ME, Cooper JA, and Bridgman PC, 2004. Yeast actin patches are networks of branched actin filaments. The Journal of cell biology 166:629–635. [DOI] [PMC free article] [PubMed] [Google Scholar]
- 12.Kukulski W, Schorb M, Kaksonen M, and Briggs JA, 2012. Plasma membrane reshaping during endocytosis is revealed by time-resolved electron tomography. Cell 150:508–520. [DOI] [PubMed] [Google Scholar]
- 13.Mund M, van der Beek JA, Deschamps J, Dmitrie S , Hoess P, Monster JL, Picco A, Nédélec F, Kaksonen M, and Ries J, 2018. Systematic nanoscale analysis of endocytosis links efficient vesicle formation to patterned actin nucleation. Cell 174:884–896. [DOI] [PMC free article] [PubMed] [Google Scholar]
- 14.Blanchoin L, Boujemaa-Paterski R, Sykes C, and Plastino J, 2014. Actin dynamics, architecture, and mechanics in cell motility. Physiological reviews 94:235–263. [DOI] [PubMed] [Google Scholar]
- 15.Picco A, Kukulski W, Manenschijn HE, Specht T, Briggs JA, and Kaksonen M, 2018. The contributions of the actin machinery to endocytic membrane bending and vesicle formation. Molecular biology of the cell 29:1346–1358. [DOI] [PMC free article] [PubMed] [Google Scholar]
- 16.Aghamohammadzadeh S, and Ayscough KR, 2009. Differential requirements for actin during yeast and mammalian endocytosis. Nature cell biology 11:1039. [DOI] [PMC free article] [PubMed] [Google Scholar]
- 17.Danuser G, Allard J, and Mogilner A, 2013. Mathematical modeling of eukaryotic cell migration: insights beyond experiments. Annual review of cell and developmental biology 29:501–528. [DOI] [PMC free article] [PubMed] [Google Scholar]
- 18.Pollard TD, and Berro J, 2009. Mathematical models and simulations of cellular processes based on actin filaments. Journal of Biological Chemistry 284:5433–5437. [DOI] [PubMed] [Google Scholar]
- 19.Carlsson AE, and Bayly PV, 2014. Force generation by endocytic actin patches in budding yeast. Biophysical journal 106:1596–1606. [DOI] [PMC free article] [PubMed] [Google Scholar]
- 20.Basu R, Munteanu EL, and Chang F, 2014. Role of turgor pressure in endocytosis in fission yeast. Molecular biology of the cell 25:679–687. [DOI] [PMC free article] [PubMed] [Google Scholar]
- 21.Dmitrie S, and Nédélec F, 2015. Membrane mechanics of endocytosis in cells with turgor. PLoS computational biology 11:e1004538. [DOI] [PMC free article] [PubMed] [Google Scholar]
- 22.Tweten D, Bayly P, and Carlsson A, 2017. Actin growth profile in clathrin-mediated endocytosis. Physical Review E 95:052414. [DOI] [PMC free article] [PubMed] [Google Scholar]
- 23.Nickaeen M, Berro J, Pollard TD, and Slepchenko BM, 2019. Actin assembly produces su cient forces for endocytosis in yeast. Molecular biology of the cell mbc–E19. [DOI] [PMC free article] [PubMed] [Google Scholar]
- 24.Wang X, Galletta BJ, Cooper JA, and Carlsson AE, 2016. Actin-regulator feedback interactions during endocytosis. Biophysical journal 110:1430–1443. [DOI] [PMC free article] [PubMed] [Google Scholar]
- 25.Motahari F, and Carlsson A, 2018. The effect of the filament-obstacle interaction on the force-velocity relation of a growing biopolymer. arXiv preprint arXiv:1812.00061 . [Google Scholar]
- 26.Hill TL, 2012. Linear aggregation theory in cell biology. Springer Science & Business Media. [Google Scholar]
- 27.van Doorn GS, TȈanase C, Mulder BM, and Dogterom M, 2000. On the stall force for growing microtubules. European Biophysics Journal 29:2–6. [DOI] [PubMed] [Google Scholar]
- 28.Carlsson A, 2008. Model of reduction of actin polymerization forces by ATP hydrolysis. Physical biology 5:036002. [DOI] [PubMed] [Google Scholar]
- 29.Krawczyk J, and Kierfeld J, 2011. Stall force of polymerizing microtubules and filament bundles. EPL (Europhysics Letters) 93:28006. [Google Scholar]
- 30.Son J, Orkoulas G, and Kolomeisky AB, 2005. Monte Carlo simulations of rigid biopolymer growth processes. The Journal of chemical physics 123:124902. [DOI] [PubMed] [Google Scholar]
- 31.Wang R, and Carlsson A, 2014. Load sharing in the growth of bundled biopolymers. New journal of physics 16:113047. [DOI] [PMC free article] [PubMed] [Google Scholar]
- 32.Perilli A, Pierleoni C, and Ryckaert J-P, 2019. Filament flexibility enhances power transduction of F-actin bundles. The Journal of chemical physics 150:185101. [DOI] [PubMed] [Google Scholar]
- 33.Zimmermann J, Enculescu M, and Falcke M, 2010. Leading-edge–gel coupling in lamellipodium motion. Physical Review E 82:051925. [DOI] [PubMed] [Google Scholar]
- 34.Mullins RD, Heuser JA, and Pollard TD, 1998. The interaction of Arp2/3 complex with actin: nucleation, high a nity pointed end capping, and formation of branching networks of filaments. Proceedings of the National Academy of Sciences 95:6181–6186. [DOI] [PMC free article] [PubMed] [Google Scholar]
- 35.Dickinson RB, Caro L, and Purich DL, 2004. Force generation by cytoskeletal filament end-tracking proteins. Biophysical journal 87:2838–2854. [DOI] [PMC free article] [PubMed] [Google Scholar]
- 36.Zhu J, and Carlsson A, 2006. Growth of attached actin filaments. The European Physical Journal E 21:209–222. [DOI] [PubMed] [Google Scholar]
- 37.Doi M, and Edwards SF, 1988. The theory of polymer dynamics, volume 73 Oxford University Press. [Google Scholar]
- 38.McGrath JL, Tardy Y, Dewey C Jr, Meister J, and Hartwig J, 1998. Simultaneous measurements of actin filament turnover, filament fraction, and monomer diffusion in endothelial cells. Biophysical journal 75:2070–2078. [DOI] [PMC free article] [PubMed] [Google Scholar]
- 39.Galletta BJ, Carlsson AE, and Cooper JA, 2012. Molecular analysis of Arp2/3 complex activation in cells. Biophysical journal 103:2145–2156. [DOI] [PMC free article] [PubMed] [Google Scholar]
- 40.Lautrup B, 2005. Physics of continuous matter. Exotic and Everyday Phenomena in the Macroscopic World, IOP . [Google Scholar]
- 41.Gittes F, Mickey B, Nettleton J, and Howard J, 1993. Flexural rigidity of microtubules and actin filaments measured from thermal fluctuations in shape. The Journal of cell biology 120:923–934. [DOI] [PMC free article] [PubMed] [Google Scholar]
- 42.Goode BL, Eskin JA, and Wendland B, 2015. Actin and endocytosis in budding yeast. Genetics 199:315–358. [DOI] [PMC free article] [PubMed] [Google Scholar]
- 43.Kim K, Yamashita A, Wear MA, Maéda Y, and Cooper JA, 2004. Capping protein binding to actin in yeast: biochemical mechanism and physiological relevance. J Cell Biol 164:567–580. [DOI] [PMC free article] [PubMed] [Google Scholar]
- 44.Pollard TD, 1986. Rate constants for the reactions of ATP-and ADP-actin with the ends of actin filaments. The Journal of cell biology 103:2747–2754. [DOI] [PMC free article] [PubMed] [Google Scholar]
- 45.Bieling P, Hansen SD, Akin O, Hayden CC, Fletcher DA, Mullins RD, et al. , 2018. WH2 and proline-rich domains of WASP-family proteins collaborate to accelerate actin filament elongation. The EMBO journal 37:102–121. [DOI] [PMC free article] [PubMed] [Google Scholar]
- 46.Hänggi P, Talkner P, and Borkovec M, 1990. Reaction-rate theory: fifty years after Kramers. Reviews of modern physics 62:251. [Google Scholar]
- 47.Thomson R, 1986. Physics of fracture In Solid state physics, Elsevier, volume 39, 1–129. [Google Scholar]
- 48.Kaksonen M, Sun Y, and Drubin DG, 2003. A pathway for association of receptors, adaptors, and actin during endocytic internalization. Cell 115:475–487. [DOI] [PubMed] [Google Scholar]
- 49.Skruzny M, Brach T, Ciu a R, Rybina S, Wachsmuth M, and Kaksonen M, 2012. Molecular basis for coupling the plasma membrane to the actin cytoskeleton during clathrin-mediated endocytosis. Proceedings of the National Academy of Sciences 109:E2533–E2542. [DOI] [PMC free article] [PubMed] [Google Scholar]
- 50.Landau L, Lifshitz E, and Sykes J, 1989. Theory of Elasticity Course of theoretical physics. Pergamon Press. [Google Scholar]
- 51.Gradshteyn IS, and Ryzhik IM, 2014. Table of integrals, series, and products. Academic press. [Google Scholar]