

ABSTRACT
Background and objective: There are few data on the short‐term natural history of airway inflammation during severe episodes of acute exacerbation of COPD (AECOPD). An observational study was performed to determine how rapidly conventional treatment improves airway inflammation in patients admitted to hospital with AECOPD.
Methods: Twenty‐four consecutive patients with AECOPD were recruited and changes in sputum inflammatory indices were assessed after 2 and 4 days of treatment. The primary end‐points included presence of bacteria and viruses, changes in sputum total cell counts (TCC) and polymorphonuclear leukocyte (PMN) differential counts, and levels of secretory leukocyte protease inhibitor (SLPI), IL‐8 and TNF‐α.
Results: All patients received oral corticosteroids and 17 (71%) were also treated with oral antibiotics. A bacterial or viral pathogen was isolated from 12 patients (50%), and Aspergillus fumigatus was isolated from one. A positive bacterial culture was associated with increased sputum TCC and PMN count (P < 0.05), as well as higher levels of IL‐8 and TNF‐α (P < 0.05), and a trend towards lower sputum SLPI levels (P = 0.06). Sputum PMN numbers fell by 70% within the first 48 h of admission (P < 0.05), accompanied by an increase in sputum SLPI (P < 0.001) and reductions in the levels of TNF‐α (P < 0.005) and IL‐8 (P = 0.06), with no further significant change at 4 days.
Conclusions: Conventional treatment for severe AECOPD is associated with rapid reduction of neutrophilic inflammation and improvement in anti‐protease defences.
Keywords: acute exacerbations of chronic obstructive pulmonary disease, anti‐proteases, corticosteroids, neutrophils
SUMMARY AT A GLANCE
Resolution of airway neutrophilia and recovery of anti‐protease defences following oral corticosteroid treatment, with or without antibiotics, in acute exacerbation of COPD was assessed. Neutrophil‐related inflammation and anti‐protease defences improved within 48 h, but clinical improvements lagged behind, raising questions about the duration of current corticosteroid treatment in severe acute exacerbation of COPD.
INTRODUCTION
The cellular and molecular abnormalities in acute asthma are relatively well characterized, but less progress has been made in elucidating the short‐term immunopathology and natural history of acute exacerbations of COPD (AECOPD). 1 There are few longitudinal studies of airway inflammation during the acute, short‐term phase of a COPD exacerbation.
Airway neutrophils appear to be the prime effector cells during AECOPD, with generation of increased oxidative stress and a proteinase/anti‐proteinase imbalance that may contribute to long‐term decline in lung function; however, evidence for this is only just emerging. 2 , 3 , 4 Bacterial pathogens can be isolated by routine laboratory culture from sputum in approximately 40–60% of cases of AECOPD. Whether infection amplifies airway inflammation has been a topic of debate, although recent data have demonstrated a positive relationship between bacterial load and intensity of airway inflammation. 2 , 5 , 6 , 7 , 8 Viruses are also commonly isolated from the respiratory tract during AECOPD, and their role in driving the inflammatory process is also increasingly being recognized. 9 , 10 In this observational study, changes in sputum cell profiles and mediator levels during AECOPD were prospectively assessed, to determine how rapidly inflammation responds to conventional corticosteroid (CS) therapy plus, in most cases, treatment with antibiotics, in patients admitted to hospital. The relationship between the presence of infection (bacterial and/or viral) and the intensity of airway inflammation was also investigated. Sputum levels of IL‐8 and TNF‐α were assessed because of their likely important roles in modulating/mediating neutrophilic inflammation in COPD, and sputum concentrations of secretory leukocyte protease inhibitor (SLPI) were measured because of its protective function in the airway against harmful products of polymorphonuclear leukocyte (PMN) activation, and its potential role in facilitating the resolution of inflammation in COPD. 2 , 11 , 12 , 13 , 14
A particular focus of the study was how cell and mediator levels changed with treatment during the acute phase of AECOPD, and to some extent, how these changes were associated with clinical and physiological parameters.
METHODS
Patients and control subjects
Sequential patients presenting to the emergency department of a busy tertiary care general public hospital in southern Tasmania, were recruited between July and November 2003, which was late winter and early spring in Australia. Patients were recruited as soon as possible after presentation, usually within 2 h, and never more than 12 h later for those who had been admitted overnight. Information sheets detailing the study aims and procedures, and the confidentiality of information provided were discussed with each patient. All patients were required to provide written consent before commencing the study, which was approved by the Tasmanian Statewide Ethics Committee. Six patients with mild, stable COPD and six healthy, never‐smoking, non‐atopic, middle‐aged individuals with no history of respiratory disease underwent sputum induction and lung function assessment, which provided comparative data (Table 1).
Table 1.
Characteristics of patients with acute exacerbation of COPD (AECOPD) and control subjects
| AECOPD n = 24 | Stable COPD n = 6 | Normal control n = 6 | |
|---|---|---|---|
| Age, years (range) | 69 (49–80) | 60.5 (53–67) | 46 (40–57) |
| Male/female | 13/11 | 5/1 | 5/1 |
| Current/ex‐smoker | 10/14 | 3/3 | — |
| Pack years smoked (range) | 57.5 (15–150) | 49.3 (18–75) | — |
| Length of stay (range) | 5 (1–28) | — | — |
| Antibiotics pre‐admission | 16 (67%) | — | — |
| Prednisolone pre‐admission | 11 (46%) | — | — |
| Lung function on admission | |||
| FEV1, L (range) | 0.63 (0.3–1.4) | — | — |
| FEV1 % predicted (range) | 25% (13–60%) | — | — |
| Lung function when stable | |||
| FEV1, L (range) | 0.88 (0.42–1.64) | 2.03 (1.89–2.73) | 4.05 (3.39–5.43) |
| FEV1 % predicted (range) | 35% (17–104%) | 72% (53–88%) | 133% (91–141%) |
Inclusion criteria
A diagnosis of COPD was made by a respiratory physician, on the basis of a smoking history of at least 15 pack‐years, age >40 years and symptoms of productive cough and/or progressive breathlessness. Airflow limitation consistent with the diagnosis of COPD was assessed by spirometry and was defined as FEV1 < 80% of predicted with FEV1/FVC < 70%. AECOPD was defined according to the national criteria, i.e. increased cough, wheeze, and sputum volume and purulence (COPDX guidelines, 2003). 15
Exclusion criteria
Patients with a history suggestive of asthma, or a previous diagnosis of asthma (symptoms in childhood or young adulthood; related atopic disorders; significant day to day variability; prominent nocturnal symptoms; a history of wheeze predominating over progressive breathlessness) were excluded. Other exclusion criteria included evidence of pneumonic consolidation on CXR, a need for non‐invasive ventilation, left ventricular failure or other significant active co‐morbidities such as ischaemic heart disease, long‐term oral CS therapy and inability to comply with instructions. Patients who had received systemic CS for their exacerbation for more than 48 h before presentation were excluded, but established inhaled CS therapy (>6 months) was not an exclusion criterion.
Study design
This was a 4‐day prospective observational study of admissions for AECOPD. The prior use of systemic CS or antibiotics was recorded. On admission, treatment was determined according to the TSANZ COPDX guidelines that recommend a course of oral prednisone at a dose of 0.5–1.0 mg/kg for up to 2 weeks and additional oral antibiotics if bacterial infection is suspected. 15 Baseline patient demographics were recorded on admission (Table 1). At baseline, 48 and 96 h, patients underwent assessments of symptom scores and spirometry and sputum was collected. Visual analogue scales (VAS) (10 cm) were used to document cough intensity, sputum volume, breathlessness and general well‐being at the time of admission (see supplementary data). The VAS scores were summed to obtain a ‘total symptom score’. Bedside spirometry was performed with the patient in the sitting position. Spontaneously expectorated sputum was collected from the patients with AECOPD, if possible. All control subjects underwent sputum induction.
Sputum induction
Sputum was induced with hypertonic saline (4.5%) using a low output ultrasonic nebulizer (DeVilbiss Ultrasonic Nebuliser, Jackson, TN, USA), after pre‐medication with inhaled salbutamol (400 µg). Sputum induction has been shown not to affect cell counts or mediator concentrations. 16
Sputum processing
Expectorated sputum (spontaneous or induced) was placed on ice and examined within 1 h. Sputum plugs, free of salivary contamination, were selected and processed according to an adaptation of the method of Pin et al. 17 Briefly, a volume of 0.1% dithiothreitol equivalent to four times the weight of the selected sputum plugs was added and the sample was placed in a water bath at 38°C for 30 min with gentle mixing at 10 min intervals. After homogenization, the sample was centrifuged at 251 g for 10 min. The cell‐free supernatant was decanted and stored at −80°C for later analysis. The cell pellet was resuspended in PBS and a total cell count (TCC) was performed. Aliquots of the resuspended cell pellet were spun in a cytocentrifuge (Shandon cytospin III, Runcorn, UK) at 82 g for 10 min. Two cytospin slides were prepared per patient, at each time point, and stained with Diff Quick for determination of the differential cell count.
Sputum cell counts
Differential counts were performed on cytospin slides, with a minimum of 400 cells being counted. A single experienced observer, who was blinded to patient's identity, date of admission and clinical outcome performed the differential cell counts.
Sputum concentrations of soluble mediators
Commercially available ELISA kits were used to detect and quantify all mediators. The effect of dithiothreitol on the cytokine assays was not formally assessed for all the mediators of interest, but previous reports suggest that SLPI, IL‐8 and TNF‐α are minimally affected, if at all, by sputum processing. 18 , 19 , 20 IL‐8 concentrations in cell‐free sputum supernatants were measured using a quantitative chemiluminescence sandwich ELISA according to the manufacturer's instructions (R&D Systems Inc., Minneapolis, MN, USA). The lower limit of detection of the assay was 4 µg/mL. SLPI levels were determined using a sandwich ELISA (Quantikine, R&D Systems Inc.) with a lower limit of detection of 25 pg/mL. TNF‐α concentrations were determined using an ELISA kit (Chemicon, R&D Systems Inc.) with a lower limit of detection of 4.8 pg/mL.
Microbiological culture and identification of respiratory viruses
Unprocessed sputum, obtained at baseline, was sent for routine microbial culture on appropriate media using standard methods. An aliquot of sputum was also sent to the Victorian Infectious Disease Reference Laboratory for reverse transcriptase‐PCR using a panel of primers for detection of common respiratory viruses, including influenza A and B, parainfluenza, coronavirus, rhinovirus, human metapneumovirus and respiratory syncytial virus.
Statistical analysis
Statistical analysis was performed using SPSS version 11.5.0. Data were not normally distributed and non‐parametric statistics were therefore used. Wilcoxon's signed rank test was used for analysis of paired data and the Kruskal–Wallis test was used for analysis of data from multiple groups. Categorical outcome variables were analysed using the Mann–Whitney U and chi‐square tests. Univariate correlations between inflammatory variables and clinical outcomes were analysed using Spearman's rank test. Results were considered statistically significant at the 5% level. Where sputum mediators were not detected by immunoassay, they were arbitrarily assigned a zero value for the purposes of statistical analysis.
RESULTS
Twenty‐four consecutive patients were recruited. Demographic details are presented in Table 1. All patients with AECOPD were able to spontaneously expectorate sputum at baseline. Only one AECOPD patient had to undergo sputum induction (day 4). Baseline slides from two patients were discarded and 48‐h slides from an additional two patients were discarded due to poor quality.
Sputum cell counts
In the patients experiencing an AECOPD, sputum TCC and absolute PMN counts were significantly higher than in the subjects with stable COPD (P < 0.05) or normal control subjects (P < 0.005) (Table 2).
Table 2.
Sputum inflammatory cell and mediator profiles in patients with acute exacerbation of COPD (AECOPD), stable COPD patients and normal control subjects
| AECOPD | Stable COPD | Normal controls | Significance | ||
|---|---|---|---|---|---|
| n = 22 | n = 6 | n = 6 | AECOPD versus stable AECOPD versus normal | ||
| Sputum TCC, ×106/mL | 14.4 (1.7–295.6) | 3.5 (0.6–21.7) | 1.7 (0.3–4.3) | P = 0.02 | P = 0.002 |
| Macrophages, % | 14.0 (2.0–80.0) | 30.4 (9.8–57.0) | 39.4 (6.3–72.3) | P = 0.1 | P = 0.2 |
| Macrophages × 106/mL | 3.5 (0.1–54.8) | 0.9 (0.4–2.5) | 0.3 (0.2–1.3) | P = 0.05 | P = 0.003 |
| Lymphocytes, % | 1.0 (0.0–6.0) | 4.7 (1.1–10.4) | 5.3 (2.7–11.3) | P = 0.4 | P < 0.001 |
| Lymphocytes × 106/mL | 0.07 (0.0–2.3) | 0.08 (0.04–1.0) | 0.1 (0.01–0.1) | P = 0.4 | P = 0.6 |
| Neutrophils, % | 83.0 (10.0–98.0) | 61.0 (32.2–81.2) | 48.2 (17.9–91.0) | P = 0.09 | P = 0.09 |
| Neutrophils × 106/mL | 17.3 (0.2–248.3) | 2.4 (0.2–17.3) | 0.3 (0.1–3.9) | P = 0.04 | P = 0.004 |
| Eosinophils, % | 0.0 (0.0–17.0) | 1.8 (0.7–6.1) | 0.0 (0–3.2) | P = 0.01 | P = 0.02 |
| Eosinophils × 106/mL | 0.0 (0.0–5.9) | 0.07 (0.0–1.3) | 0.0 (0.0–0.0) | P = 0.03 | P = 0.02 |
| Epithelial cells, % | 1.0 (0.0–10.0) | 0.8 (0.0–3.5) | 0.0 (0.0–3.7) | P = 0.1 | P = 0.3 |
| Epithelial cells × 106/mL | 0.1 (0.0–3.0) | 0.02 (0.0–0.1) | 0.0 (0.0–0.1) | P = 0.4 | P = 0.1 |
| SLPI, µg/mL | 2.8 (0.4–118.8) | 12.7 (4.9–21.2) | 9.1 (4.8–54.0) | P = 0.09 | P = 0.1 |
| IL–8, µg/mL | 137.0 (8.4–4430) | 12.6 (0–53.5) | 0.6 (0–3.5) | P = 0.003 | P < 0.001 |
| TNF–α, pg/mL | 1700 (0–10 700) | 0 (0–1071) | 375 (0–650) | P = 0.007 | P = 0.008 |
Data are median values and ranges. Lower limits of detection for IL‐8, SLPI and TNF‐α were 4 µg/mL, 25 pg/mL and 4.8 pg/mL respectively.
TCC, total cell count; SLPI, secretory leukocyte protease inhibitor; TNF‐α, tumour necrosis factor‐α.
Sputum inflammatory indices on admission
There was no significant difference in sputum cell profiles between current and ex‐smokers admitted with an AECOPD, but sputum SLPI levels were significantly lower at baseline in current smokers experiencing an AECOPD compared with stable COPD patients and normal control subjects (median 2.8 µg/mL, range 0.4–118.8 vs. median 12.7 µg/mL, range 4.9–21.2 and median 9.1 µg/mL, range 4.8–54.0, P = 0.01 and P = 0.04 respectively).
In sputum from four patients experiencing an AECOPD, as well as in five of six sputum samples from stable COPD patients and in one from a normal control subject, TNF‐α levels were below the detection limit. However, sputum IL‐8 and overall TNF‐α levels were both significantly increased in AECOPD patients on admission compared with stable COPD patients and normal control subjects.
Airway infection
A bacterial, viral or fungal organism was identified in 50% (12/24) of the AECOPD patients. A bacterial organism was isolated from six patients (25%) (five with Haemophilus influenzae and one with Pseudomonas aeruginosa), and two of these patients were co‐infected with a respiratory virus. Antibiotic use before hospital presentation was reported by 16 patients; a bacterial pathogen (P. aeruginosa and H. influenzae) was isolated from only two of these patients, compared with the four patients infected with H. influenzae among eight who had not received prior antibiotic treatment (P < 0.05). One patient was infected with Aspergillus fumigatus. Respiratory viral pathogens were isolated from seven patients in total (29%); influenza A from three, parainfluenza from two, respiratory syncytial virus from one and picoRNA virus from one. All patients received systemic CS therapy and 17 (71%) were treated with oral antibiotics during their admission.
Infection with bacteria, but not with viruses, was associated with significantly increased sputum TCC and PMN numbers (P < 0.05), as well as with increased sputum levels of IL‐8 and TNF‐α (P < 0.05). Bacterial infection was also accompanied by significantly lower sputum levels of SLPI (P < 0.05) (Table 3).
Table 3.
Sputum inflammatory cells and mediators in AECOPD with positive or negative bacterial culture results
| Positive bacterial culture (n = 6) | Negative bacterial culture (n = 16) † | Significance | |
|---|---|---|---|
| Sputum TCC ×106/mL | 45.5 (20.2–203.0) | 11.7 (1.7–295.6) | P = 0.01 |
| Sputum neutrophil, % | 92 (72–98) | 81 (10–93) | P = 0.02 |
| Sputum neutrophils, ×106/mL | 41.1 (19.8–146.2) | 9.7 (2.21–248.3) | P = 0.01 |
| Sputum SLPI, µg/mL | 1.3 (0.5–3.5) | 5.2 (0.4–118.8) | P = 0.047 |
| Sputum IL‐8, µg/mL | 449 (210–1354) | 110 (8.4–4430) | P = 0.03 |
| Sputum TNF‐α, pg/mL | 6675 (400–10 700) | 850 (0–10 490) | P = 0.02 |
† Sputum differential cell counts in the non‐infected patients are based on the 16 subjects from whom good quality cytospins were obtained. Data are median values and ranges. TCC, total cell count; SLPI, secretory leukocyte protease inhibitor; TNF‐α, tumour necrosis factor‐α.
Changes in sputum inflammatory indices at 48 and 96 h
Within 48 h of admission, sputum TCC and PMN numbers were reduced by 55% (P < 0.01) and 70% (P = 0.006) respectively (Table 4, Fig. 1). This occurred regardless of the detection of an infective organism. Sputum and peripheral blood eosinophilia did not change over the time course of the study.
Table 4.
Sputum inflammatory cells and mediators on admission and after 48 h of treatment
| † On admission (n = 19) | At 48 h (n = 19) | Significance | |
|---|---|---|---|
| Sputum TCC, ×106/mL | 13.7 (2.5–203.0) | 7.7 (0.9–309) | P = 0.005 |
| Sputum neutrophils, % | 82 (10–98) | 78 (6–88) | P = 0.04 |
| Sputum neutrophils, ×106/mL | 10.6 (0.8–146.2) | 5.1 (0.5–24.7) | P = 0.006 |
| Sputum SLPI, µg/mL | 2.3 (0.4–118.8) | 16.9 (2.8–141.1) | P < 0.001 |
| Sputum IL‐8, µg/mL | 141 (38–4430) | 117 (10–520) | P = 0.06 |
| Sputum TNF‐α, pg/mL | 1290 (0–10 700) | 500 (0–2320) | P = 0.003 |
Sputum results are based on the 19 patients from whom paired samples were obtained (by 48 h, three patients had been discharged and matched sputum results were available for analysis from 19 of the remaining 21 patients). Data are median values and ranges.
TCC, total cell count; SLPI, secretory leukocyte protease inhibitor; TNF‐α, tumour necrosis factor‐α.
Figure 1.
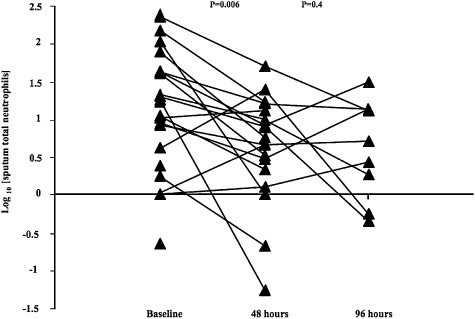
Changes in sputum absolute neutrophil numbers over the surveillance period. P values indicate the significance of changes between baseline and 48 h and between 48 and 96 h. For clarity of presentation log transformed data are shown.
There was a uniform rise in sputum SLPI levels at 48 h (P < 0.001), with levels generally continuing to increase up to 4 days (4, 5 and Fig. 2). At 48 h, there was also a significant reduction in sputum TNF‐α levels (P = 0.003), to below the detection limit of the assay, in a further four subjects, with a strong trend towards decreased IL‐8 levels (P = 0.06) by 48 h and continued overall reductions in the concentrations both cytokines at 4 days (Table 5).
Table 5.
Sputum inflammatory cells and mediators on admission and after 48 and 96 h of treatment
| † On admission (n = 10) | At 48 h (n = 10) | At 96 h (n = 10) | Significance 0–48 h | Significance 48–96 h | |
|---|---|---|---|---|---|
| Sputum TCC, ×106/mL | 11.7 (4.6–48.2) | 10.5 (3.6–50.5) | 9.5 (1.3–39.0) | P = 0.09 | P = 0.4 |
| Sputum neutrophils, % | 91 (10–98) | 77 (34–97) | 68 (7–92) | P = 0.02 | P = 0.8 |
| Sputum neutrophils, ×106/mL | 14.3 (0.8–43.9) | 8.5 (0.1–45.0) | 5.0 (0.05–31.6) | P = 0.1 | P = 0.4 |
| Sputum SLPI, µg/mL | 4.4 (0.9–118.8) | 22.0 (2.8–141.1) | 61.6 (3.1–155.1) | P = 0.005 | P = 0.1 |
| Sputum IL‐8, µg/mL | 175 (38–4430) | 122 (27–520) | 70 (25–259) | P = 0.4 | P = 0.07 |
| Sputum TNF‐α, pg/mL | 1275 (0–10 700) | 25 (0–2320) | 25 (3500) | P = 0.02 | P = 0.7 |
Sputum results are based on the 10 patients from whom paired samples were obtained (by 96 h, 14 patients had been discharged; serial matched sputum results were available for analysis from all of the remaining 10 patients). Data are median values and ranges.
TCC, total cell count; SLPI, secretory leukocyte protease inhibitor; TNF‐α, tumour necrosis factor‐α.
Figure 2.
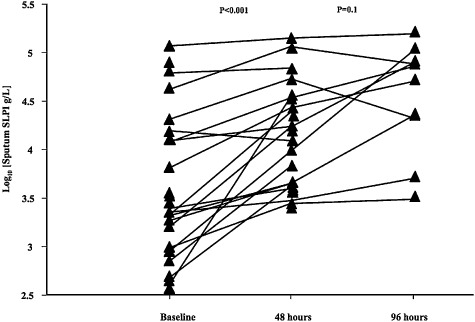
Changes in sputum secretory leukocyte protease inhibitor (SLPI) levels over the surveillance period. For clarity of presentation log transformed data are shown.
Relationships among inflammatory variables at time of admission
At baseline (on admission), there were a number of significant correlations between sputum inflammatory cell counts and mediator levels. These correlations are summarized in Table 6. The strongest relationships were those between sputum SLPI levels and PMN numbers (inverse correlation) and between sputum IL‐8 levels and PMN numbers (positive correlation; Table 6). Furthermore, sputum SLPI levels were inversely correlated with IL‐8 and TNF‐α levels, suggesting an overall negative association with the intensity of acute airway inflammation.
Table 6.
Correlations among sputum inflammatory cells and mediators on admission
| Sputum PMN, ×106/mL | Sputum SLPI (ng/mL) | Sputum IL‐8 (pg/mL) | Sputum TNF‐α (pg/mL) | |
|---|---|---|---|---|
| Sputum PMN, ×106/mL | — | r 2 = 0.61 (P < 0.001) | r 2 = 0.49 (P < 0.001) | r 2 = 0.35 (P = 0.001) |
| Sputum SLPI (ng/mL) | r 2 = 0.61 (P < 0.001) | — | r 2 = 0.27 (P = 0.02) | r 2 = 0.67 (P = 0.001) |
| Sputum IL‐8 (pg/mL) | r 2 = 0.49 (P < 0.001) | r 2 = 0.27 (P = 0.02) | — | r 2 = 0.32 (P = 0.001) |
| Sputum TNF‐α (pg/mL) | r 2 = 0.35 (P = 0.001) | r 2 = 0.67 (P = 0.001) | r 2 = 0.32 (P = 0.001) | — |
Values are Spearman's rank correlation coefficients.
PMN, polymorphonuclear leukocytes; SLPI, secretory leukocyte protease inhibitor; TNF‐α, tumour necrosis factor‐α.
Relationships among inflammatory variables at 48 h
Despite the very strong relationships among several inflammatory variables at baseline, the only significant correlation among sputum indices at 48 h was that between reductions in sputum absolute PMN numbers and TNF‐α levels (Table 7).
Table 7.
Correlations among relative changes in sputum inflammatory cells and mediators after 48 h of treatment
| ΔSputum PMN | ΔSputum SLPI | ΔSputum IL‐8 | ΔSputum TNF‐α | |
|---|---|---|---|---|
| ΔSputum PMN | — | r 2 = 0.005 (P = 0.8) | r 2 = 0.04 (P = 0.5) | r2 = 0.26 (P = 0.05) |
| ΔSputum SLPI | r 2 = 0.005 (P = 0.8) | — | r 2 = 0.02 (P = 0.6) | r 2 = 0.02 (P = 0.6) |
| ΔSputum IL‐8 | r 2 = 0.04 (P = 0.5) | r 2 = 0.02 (P = 0.6) | — | r 2 = 0.01 (P = 0.7) |
| ΔSputum TNF‐α | r2 = 0.26 (P = 0.05) | r 2 = 0.02 (P = 0.6) | r 2 = 0.01 (P = 0.7) | — |
Values are Spearman's rank correlation coefficients. The significant correlation is indicated in bold type.
PMN, polymorphonuclear leukocytes; SLPI, secretory leukocyte protease inhibitor; TNF‐α, tumour necrosis factor‐α.
Clinical responses
By 48 h, total symptom VAS scores had improved for all patients and by day 4, 14 patients had been discharged (Table 8). There were significant reductions in breathlessness at 48 h (P = 0.001). Cough severity was also reduced at 48 h (P = 0.006). There were some additional improvements in total symptoms, but these were small and not significant (Fig. 3). Sputum volume was also reduced at 48 h compared with baseline (P = 0.001). Overall, almost all patients reported significantly less breathlessness, cough and sputum production after 48 h, but improvement in subjective well‐being was even more marked. In contrast, FEV1 had not changed significantly at 48 h (P = 0.2) and there was little improvement at 4 days (P = 0.5). Mean length of stay (LOS) was 5 days (range 1–28 days). There was no relationship between baseline clinical or inflammatory parameters and LOS.
Table 8.
Changes in symptoms, as measured using visual analogue scales, and in FEV1 after 48 h of treatment
| VAS | Baseline n = 19 | 48 h n = 19 | Significance |
|---|---|---|---|
| Dyspnoea | 6.0 (2.0–10.0) | 5.0 (1.0–7.0) | P = 0.001 |
| Cough | 5.0 (2.0–10.0) | 4.0 (2.0–10.0) | P = 0.006 |
| Sputum | 3.0 (1.0–9.0) | 2.0 (1.0–5.0) | P = 0.001 |
| General well‐being | 8.0 (3.0–1.0) | 4.0 (1.0–8.0) | P < 0.001 |
| Total | 22.0 (14.0–39.0) | 13.0 (6.0–25.0) | P < 0.001 |
| FEV1, mL | 700 (400–1400) | 700 (400–1350) | P = 0.2 |
Data are median values and ranges. VAS, visual analogue scale.
Figure 3.
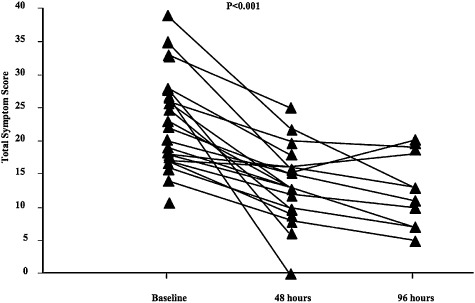
Changes in total symptom scores over the surveillance period.
DISCUSSION
This study confirmed the observation that AECOPD are frequently associated with infection and are characterized by sputum neutrophilia. Conventional treatment with systemic CS and antibiotics was associated with rapid and significant reductions in airway inflammation after only 48 h, and a dramatic recovery in airway anti‐protease defences, accompanied by a reduction in symptoms in the same time frame. FEV1 changed very little over the time course of the study, despite these other improvements. Resolution of airway neutrophilia was universal and was not restricted to patients infected with bacterial pathogens or those who were treated with antibiotics.
Most studies of AECOPD have been either cross‐sectional in nature or have looked at inflammation at the commencement of the exacerbation and then again beyond the time of recovery—usually more than a week later. 4 , 8 , 21 , 22 , 23 , 24 To our knowledge this study is novel in that airway inflammatory changes were prospectively followed during the crucial early phase of treatment in AECOPD patients admitted to hospital. Almost half of all the exacerbations were associated with either bacterial or viral infection and a positive bacterial culture was associated with greater intensity of airway inflammation, suggesting that these organisms were not simple bystanders.
The most striking finding from the study was the rapid reduction in sputum neutrophilia within 48 h of admission, accompanied by decreases in sputum IL‐8 and TNF‐α, indicating a general reduction in airway inflammation. This was accompanied by a highly significant improvement in airway anti‐protease defences, as indicated by the increase in SLPI levels. There was little further improvement in these sputum inflammatory indices after 48 h. The rapid decrease in sputum neutrophils may suggest a direct effect of CS, perhaps mediated by downregulation of chemokines, such as IL‐8 and inhibition of PMN‐related adhesion molecule expression on pulmonary blood vessels. 25 , 26 Arguing against the first of these explanations was the poor relationship between changes in sputum IL‐8 and PMN numbers. However, there was a positive relationship between changes in sputum PMN numbers and TNF‐α levels. Airway epithelial cells produce TNF‐α in response to a variety of stimuli, including bacterial infection. 27 The expression of key neutrophil‐related adhesion molecules such as intercellular adhesion molecule (ICAM)‐1 and E‐selectin on vascular endothelial cells is upregulated by TNF‐α, and potential inhibition by CS of TNF‐α production may be one of the ways in which neutrophils are cleared from the airway during the acute phase of AECOPD, but this needs further study. 28 , 29 , 30 , 31
Sputum SLPI concentrations on admission were lower than those in stable COPD patients, although it should be noted that these individuals had milder disease, and also compared with the levels in normal control subjects. This was particularly so in current smokers experiencing an AECOPD, suggesting that the expected upregulation of airway anti‐protease defences in response to acute inflammation was either deficient or that consumption by the products of neutrophil activation exceeded the capacity of the airways to compensate. The inverse relationship between SLPI and sputum neutrophils on admission would support the latter explanation. However, the increase in sputum SLPI levels over 48 h was not directly related to the accompanying reduction in sputum neutrophil numbers. One explanation for this may be that CS therapy directly upregulates SLPI production by airway epithelial cells, as has been demonstrated in vitro in epithelial cell cultures. 32
In this study almost all patients reported significantly fewer symptoms after 48 h, especially in terms of general well‐being, but changes in airway inflammation and symptoms were not paralleled by improvements in FEV1. The current study suggests monitoring FEV1 as a measure of short‐term clinical improvement during AECOPD is not useful. Indeed, on reviewing the decision‐making process for discharge of these patients, it was quite evident that lung function was not a factor—as it would be, for example, in acute asthma. Monitoring of sputum cell counts may be more relevant and would be a relatively simple way of determining whether treatment was effective.
A potential criticism of this study is that chronic colonization with bacterial pathogens among some patients was not assessed post‐discharge by repeat sputum culture. Although this may have allowed a more comprehensive analysis, there was nevertheless a very strong indication that infection with bacterial pathogens at the time of exacerbation was associated with a more intense innate immune response. There are suggestions that the key determinant of the local host immune response in the airways of COPD patients who are chronically colonized with bacteria, is the burden of infection, that is, the bacterial load. 7 , 8 , 33 , 34 Whether expression of bacterial virulence factors is also important, especially at the time of an AECOPD, requires further investigation. 35 Ideally, patients should also have been assessed before they were treated with CS or antibiotics; however, the vast majority of patients in this study had received both these treatments before admission. Prospective studies of individuals with COPD in the expectation that they will experience an exacerbation are logistically difficult and require large numbers and lengthy follow up to ensure adequate numbers of patients actually experience an exacerbation. We therefore adopted a pragmatic approach by following patients once they had been admitted with an AECOPD.
The most important finding was the demonstration that the underlying acute airway inflammation during AECOPD improved quickly, presumably in response to conventional treatment, although for ethical reasons this was not a controlled study. Symptoms improved over a similar time scale. These observations raise questions regarding the need for the prolonged courses of systemic CS that are currently recommended; from the present data there seems to be little evidence to support the continuation of CS therapy beyond 2 days. The evidence base for more aggressive CS therapy is not strong and short courses would minimize the potential adverse effects of CS in this generally elderly and frail population. 36 Whether inflammation would recur with such short treatment courses needs to be studied prospectively. 36 , 37
Patients with even a hint of clinical asthma were carefully excluded from this study. Sputum eosinophils were present in small numbers, overall, and remained unchanged with treatment. These findings suggest that eosinophils do not play a role in usual AECOPD, although it is possible that prior CS therapy, even if only for 48 h, may have modulated eosinophilic inflammation before the patients who had received such therapy presented at hospital (n = 11, 46%).
In summary, the findings from this study demonstrated that viral and bacterial pathogens were frequently associated with AECOPD and that bacterial pathogens were associated with more florid airway inflammation and increased depletion of airway anti‐protease defences. Treatment with systemic CS (with or without antibiotics) during AECOPD was accompanied by reductions in neutrophilic airway inflammation and rapid recovery of airway anti‐protease defence systems.
REFERENCES
- 1. Delmastro M, Balbi B. Acute exacerbations of COPD: is inflammation central to prevention and treatment strategies? Monaldi Arch. Chest Dis. 2002; 57: 293–6. [PubMed] [Google Scholar]
- 2. Aaron SD, Angel JB, Lunau M, Wright K, Fex C et al. Granulocyte inflammatory markers and airway infection during acute exacerbation of chronic obstructive pulmonary disease. Am. J. Respir. Crit. Care Med. 2001; 163: 349–55. [DOI] [PubMed] [Google Scholar]
- 3. Crooks SW, Bayley DL, Hill SL, Stockley RA. Bronchial inflammation in acute bacterial exacerbations of chronic bronchitis: the role of leukotriene B4. Eur. Respir. J. 2000; 15: 274–80. [DOI] [PubMed] [Google Scholar]
- 4. Mercer PF, Shute JK, Bhowmik A, Donaldson GC, Wedzicha JA et al. MMP‐9, TIMP‐1 and inflammatory cells in sputum from COPD patients during exacerbation. Respir. Res. 2005; 6: 151. [DOI] [PMC free article] [PubMed] [Google Scholar]
- 5. Stockley RA, O'Brien C, Pye A, Hill SL. Relationship of sputum color to nature and outpatient management of acute exacerbations of COPD. Chest 2000; 117: 1638–45. [DOI] [PubMed] [Google Scholar]
- 6. Gompertz S, O'Brien C, Bayley DL, Hill SL, Stockley RA. Changes in bronchial inflammation during acute exacerbations of chronic bronchitis. Eur. Respir. J. 2001; 17: 1112–9. [DOI] [PubMed] [Google Scholar]
- 7. Sethi S. Bacteria in exacerbations of chronic obstructive pulmonary disease: phenomenon or epiphenomenon? Proc. Am. Thorac. Soc. 2004; 1: 109–14. [DOI] [PubMed] [Google Scholar]
- 8. Wilkinson TM, Hurst JR, Perera WR, Wilks M, Donaldson GC et al. Effect of interactions between lower airway bacterial and rhinoviral infection in exacerbations of COPD. Chest 2006; 129: 317–24. [DOI] [PMC free article] [PubMed] [Google Scholar]
- 9. Hurst JR, Donaldson GC, Perera WR, Wilkinson TM, Bilello JA et al. Use of plasma biomarkers at exacerbation of chronic obstructive pulmonary disease. Am. J. Respir. Crit. Care Med. 2006; 174: 867–74. [DOI] [PubMed] [Google Scholar]
- 10. Proud D, Chow CW. Role of viral infections in asthma and chronic obstructive pulmonary disease. Am. J. Respir. Cell Mol. Biol. 2006; 35: 513–18. [DOI] [PubMed] [Google Scholar]
- 11. Drost EM, MacNee W. Potential role of IL‐8, platelet‐activating factor and TNF‐alpha in the sequestration of neutrophils in the lung: effects on neutrophil deformability, adhesion receptor expression, and chemotaxis. Eur. J. Immunol. 2002; 32: 393–403. [DOI] [PubMed] [Google Scholar]
- 12. Mroz RM, Szulakowski P, Pierzchala W, Chyczewska E, MacNee W. Pathogenesis of chronic obstructive pulmonary disease. Cellular mechanisms (part I). Wiad Lek. 2006; 59: 92–6. Polish. [PubMed] [Google Scholar]
- 13. Hill AT, Bayley D, Stockley RA. The interrelationship of sputum inflammatory markers in patients with chronic bronchitis. Am. J. Respir. Crit. Care Med. 1999; 160: 893–8. [DOI] [PubMed] [Google Scholar]
- 14. Weldon S, McGarry N, Taggart CC, McElvaney NG. The role of secretory leucoprotease inhibitor in the resolution of inflammatory responses. Biochem. Soc. Trans. 2007; 35: 273–6. [DOI] [PubMed] [Google Scholar]
- 15. McKenzie DK, Frith PA, Burdon JG, Town GI. The COPDX plan: Australian and New Zealand guidelines for the management of chronic obstructive pulmonary disease 2003. Med. J. Aust. 2003; 178 (Suppl): S7–39. [DOI] [PubMed] [Google Scholar]
- 16. Kelly MG, Brown V, Martin SL, Ennis M, Elborn JS. Comparison of sputum induction using high‐output and low‐output ultrasonic nebulizers in normal subjects and patients with COPD. Chest 2002; 122: 955–9. [DOI] [PubMed] [Google Scholar]
- 17. Pin I, Gibson PG, Kolendowicz R, Girgis‐Gabardo A, Denburg JA et al. Use of induced sputum cell counts to investigate airway inflammation in asthma. Thorax 1992; 47: 25–9. [DOI] [PMC free article] [PubMed] [Google Scholar]
- 18. Vernooy JH, Kucukaycan M, Jacobs JA, Chavannes NH, Buurman WA et al. Local and systemic inflammation in patients with chronic obstructive pulmonary disease: soluble tumor necrosis factor receptors are increased in sputum. Am. J. Respir. Crit. Care Med. 2002; 166: 1218–24. [DOI] [PubMed] [Google Scholar]
- 19. Woolhouse IS, Bayley DL, Stockley RA. Effect of sputum processing with dithiothreitol on the detection of inflammatory mediators in chronic bronchitis and bronchiectasis. Thorax 2002; 57: 667–71. [DOI] [PMC free article] [PubMed] [Google Scholar]
- 20. Smountas AA, Lands LC, Mohammed SR, Grey V. Induced sputum in cystic fibrosis: within‐week reproducibility of inflammatory markers. Clin. Biochem. 2004; 37: 1031–6. [DOI] [PubMed] [Google Scholar]
- 21. Tsoumakidou M, Tzanakis N, Chrysofakis G, Kyriakou D, Siafakas NM. Changes in sputum T‐lymphocyte subpopulations at the onset of severe exacerbations of chronic obstructive pulmonary disease. Respir. Med. 2005; 99: 572–9. [DOI] [PubMed] [Google Scholar]
- 22. Tsoumakidou M, Tzanakis N, Chrysofakis G, Siafakas NM. Nitrosative stress, heme oxygenase‐1 expression and airway inflammation during severe exacerbations of COPD. Chest 2005; 127: 1911–8. [DOI] [PubMed] [Google Scholar]
- 23. Fujimoto K, Yasuo M, Urushibata K, Hanaoka M, Koizumi T et al. Airway inflammation during stable and acutely exacerbated chronic obstructive pulmonary disease. Eur. Respir. J. 2005; 25: 640–6. [DOI] [PubMed] [Google Scholar]
- 24. Qiu Y, Zhu J, Bandi V, Atmar RL, Hattotuwa K et al. Biopsy neutrophilia, neutrophil chemokine and receptor gene expression in severe exacerbations of chronic obstructive pulmonary disease. Am. J. Respir. Crit. Care Med. 2003; 168: 968–75. [DOI] [PubMed] [Google Scholar]
- 25. Saag PT, Caldenhoven E, Van De Stolpe A. Molecular mechanisms of steroid action: a novel type of cross‐talk between glucocorticoids and NF‐kappa B transcription factors. Eur. Respir. J. Suppl. 1996; 22: 146s–53s. [PubMed] [Google Scholar]
- 26. Caramori G, Adcock I. Anti‐inflammatory mechanisms of glucocorticoids targeting granulocytes. Curr. Drug Targets Inflamm. Allergy 2005; 4: 455–63. [DOI] [PubMed] [Google Scholar]
- 27. Khair OA, Davies RJ, Devalia JL. Bacterial‐induced release of inflammatory mediators by bronchial epithelial cells. Eur. Respir. J. 1996; 9: 1913–22. [DOI] [PubMed] [Google Scholar]
- 28. Tosi MF, Stark JM, Smith CW, Hamedani A, Gruenert DC et al. Induction of ICAM‐1 expression on human airway epithelial cells by inflammatory cytokines: effects on neutrophil‐epithelial cell adhesion. Am. J. Respir. Cell Mol. Biol. 1992; 7: 214–21. [DOI] [PubMed] [Google Scholar]
- 29. Thomas PS. Tumour necrosis factor‐alpha: the role of this multifunctional cytokine in asthma. Immunol. Cell Biol. 2001; 79: 132–40. [DOI] [PubMed] [Google Scholar]
- 30. Jagels MA, Daffern PJ, Zuraw BL, Hugli TE. Mechanisms and regulation of polymorphonuclear leukocyte and eosinophil adherence to human airway epithelial cells. Am. J. Respir. Cell Mol. Biol. 1999; 21: 418–27. [DOI] [PubMed] [Google Scholar]
- 31. O'Leary EC, Marder P, Zuckerman SH. Glucocorticoid effects in an endotoxin‐induced rat pulmonary inflammation model: differential effects on neutrophil influx, integrin expression, and inflammatory mediators. Am. J. Respir. Cell Mol. Biol. 1996; 15: 97–106. [DOI] [PubMed] [Google Scholar]
- 32. Abbinante‐Nissen JM, Simpson LG, Leikauf GD. Corticosteroids increase secretory leukocyte protease inhibitor transcript levels in airway epithelial cells. Am. J. Physiol. 1995; 268: L601–6. [DOI] [PubMed] [Google Scholar]
- 33. White AJ, Gompertz S, Bayley DL, Hill SL, O'Brien C et al. Resolution of bronchial inflammation is related to bacterial eradication following treatment of exacerbations of chronic bronchitis. Thorax 2003; 58: 680–5. [DOI] [PMC free article] [PubMed] [Google Scholar]
- 34. Hill AT, Campbell EJ, Hill SL, Bayley DL, Stockley RA. Association between airway bacterial load and markers of airway inflammation in patients with stable chronic bronchitis. Am. J. Med. 2000; 109: 288–95. [DOI] [PubMed] [Google Scholar]
- 35. Chin CL, Manzel LJ, Lehman EE, Humlicek AL, Shi L et al. Haemophilus influenzae from patients with chronic obstructive pulmonary disease exacerbation induce more inflammation than colonizers. Am. J. Respir. Crit. Care Med. 2005; 172: 85–91. [DOI] [PMC free article] [PubMed] [Google Scholar]
- 36. Wood‐Baker RR, Gibson PG, Hannay M, Walters EH, Walters JA. Systemic corticosteroids for acute exacerbations of chronic obstructive pulmonary disease. Cochrane Database Syst. Rev. 2005: CD001288. [DOI] [PubMed] [Google Scholar]
- 37. Wood‐Baker R, Walters J, Walters EH. Systemic corticosteroids in chronic obstructive pulmonary disease: an overview of Cochrane systematic reviews. Respir. Med. 2007; 101: 371–7. [DOI] [PubMed] [Google Scholar]