
Figure 1.
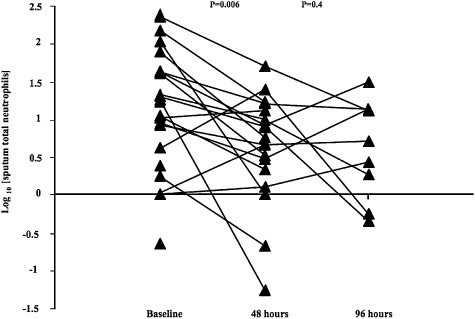
Changes in sputum absolute neutrophil numbers over the surveillance period. P values indicate the significance of changes between baseline and 48 h and between 48 and 96 h. For clarity of presentation log transformed data are shown.
Official websites use .gov
A
.gov website belongs to an official
government organization in the United States.
Secure .gov websites use HTTPS
A lock (
) or https:// means you've safely
connected to the .gov website. Share sensitive
information only on official, secure websites.
Changes in sputum absolute neutrophil numbers over the surveillance period. P values indicate the significance of changes between baseline and 48 h and between 48 and 96 h. For clarity of presentation log transformed data are shown.