

Abstract
Objective
To measure the association of fast food density (FFD) and supermarket density (SD) with adverse neonatal outcomes in pregnancies with gestational diabetes mellitus (GDM).
Study Design
This was a retrospective cohort study of women with GDM who delivered at a tertiary care center in a large metropolitan area (1/2010–2/2016). ZIP codes were used to link women with surrounding food environment. FFD and SD were calculated as the number of establishments per 100,000 residents for each ZIP code and classified into quartiles. Quartile 1 represented lowest FFD or SD. Four neonatal outcomes were assessed: large for gestational age (LGA) neonate, shoulder dystocia, neonatal hypoglycemia, and neonatal intensive care unit admission > 3 days. Bivariable and multivariable analyses estimated associations of FFD and SD with outcomes.
Results
A total of 2,373 women met eligibility criteria. Insurance, race/ethnicity, language, and body mass index differed between quartiles, although GDM type did not. High FFD was associated with lower odds of LGA but not with other outcomes. Low SD and FFD:SD ratios were not associated with any outcomes.
Conclusion
Among women with GDM, high FFD was associated with some neonatal outcomes, but low SD and FFD:SD ratio was not. Food environment may not be the only social determinant of neonatal outcomes in pregnancies with GDM.
Keywords: food density, food environment, geospatial, gestational diabetes, neonatal
Gestational diabetes mellitus (GDM), defined as the development of carbohydrate intolerance during pregnancy, is one of the most common medical complications in pregnancy.1 GDM now complicates approximately 50% more pregnancies than it did two decades ago (6–9% vs. 2–3%) and can have serious maternal and neonatal consequences.2 Neonates born to women with GDM are at an increased risk of large for gestational age (LGA) status, shoulder dystocia, neonatal hypoglycemia, and neonatal intensive care unit (NICU) admission. Achieving maternal glycemic control is paramount to reducing these risks. Medical nutrition therapy (MNT) is one of the first interventions used to treat GDM.1 The goal of MNT is to achieve normal blood glucose levels and prevent ketosis while providing adequate weight gain for appropriate fetal growth and development. The key components of MNT include caloric allotment, carbohydrate intake, and caloric distribution. Even when women require adjunctive medical therapies such as insulin, MNT is a mainstay of GDM management. Unfortunately, women with GDM face many obstacles in initiating and maintaining these dietary modifications, such as difficulty managing nutrition choices when there is inadequate access to healthy food options or increased financial burden associated with healthy food options.3
The food environment has been proposed as a potentially modifiable factor from a public health perspective to improve metabolic health. The Obesity Society and the American Society for Nutrition have assessed the multi-faceted role of the food environment in obesity, including food prices,4 variety of food options,5 and neighborhood access to healthy foods.6 For example, price changes are considered a potentially important component of a multi-faceted public health approach to reducing obesity. Palat-ability and variety may play roles in stimulating appetite, delaying satiety, and promoting excessive caloric intake, although evidence in human studies is lacking. Importantly, access to healthy foods has been studied in nonpregnant populations, finding that increased exposure to fast food restaurants has been associated with increased risk of obesity and type 2 diabetes mellitus, whereas increased exposure to grocery stores has been protective.7,8
In the obstetric literature, the food environment has also been associated with maternal outcomes. In the Pregnancy, Infection, and Nutrition Study, closer proximity of supermarkets was shown to be associated with better diet quality.9 High prevalence of fast food restaurants and ratio of fast food restaurants to supermarkets within a woman’s neighborhood of residence was associated with increased risk of the development of GDM.10 These findings suggest that greater availability of unhealthy food options may be associated with quality of nutrition and related pregnancy health; however, the effect of the food environment on perinatal outcomes among women with GDM has not been evaluated. Thus, the objective of our study was to measure the associations of fast food density (FFD) and supermarket density (SD) with adverse perinatal outcomes in women whose pregnancies were complicated by GDM.
Materials and Methods
This was a retrospective cohort study of women with GDM who delivered at a single, tertiary care hospital in Chicago, Illinois, between January 2010 and February 2016. Women were included regardless of pregnancy duration or outcome, timing of diagnosis of GDM, or type of therapy required for GDM management. Women with known type 1 or type 2 diabetes preceding pregnancy were excluded. Women were excluded if there was no documentation of ZIP code data for their home residence available or if their residence was outside of Illinois. ZIP code data were abstracted for eligible women and linked to surrounding food environment using the U.S. Census Bureau database. FFD and SD were then calculated using the North American Industry Classification System codes as the number of establishments per 100,000 residents in a similar manner to previously reported methods.10 Fast food establishments included “convenience stores” (code 445120) and “limited service restaurants” (code 722513), whereas supermarkets included “supermarket and other grocery stores” (code 445110). Subjects were then categorized into quartiles of FFD and SD (Fig. 1), where high (quartile 4) FFD and low (quartile 1) SD are hypothesized to be negative food environments.
Fig. 1.
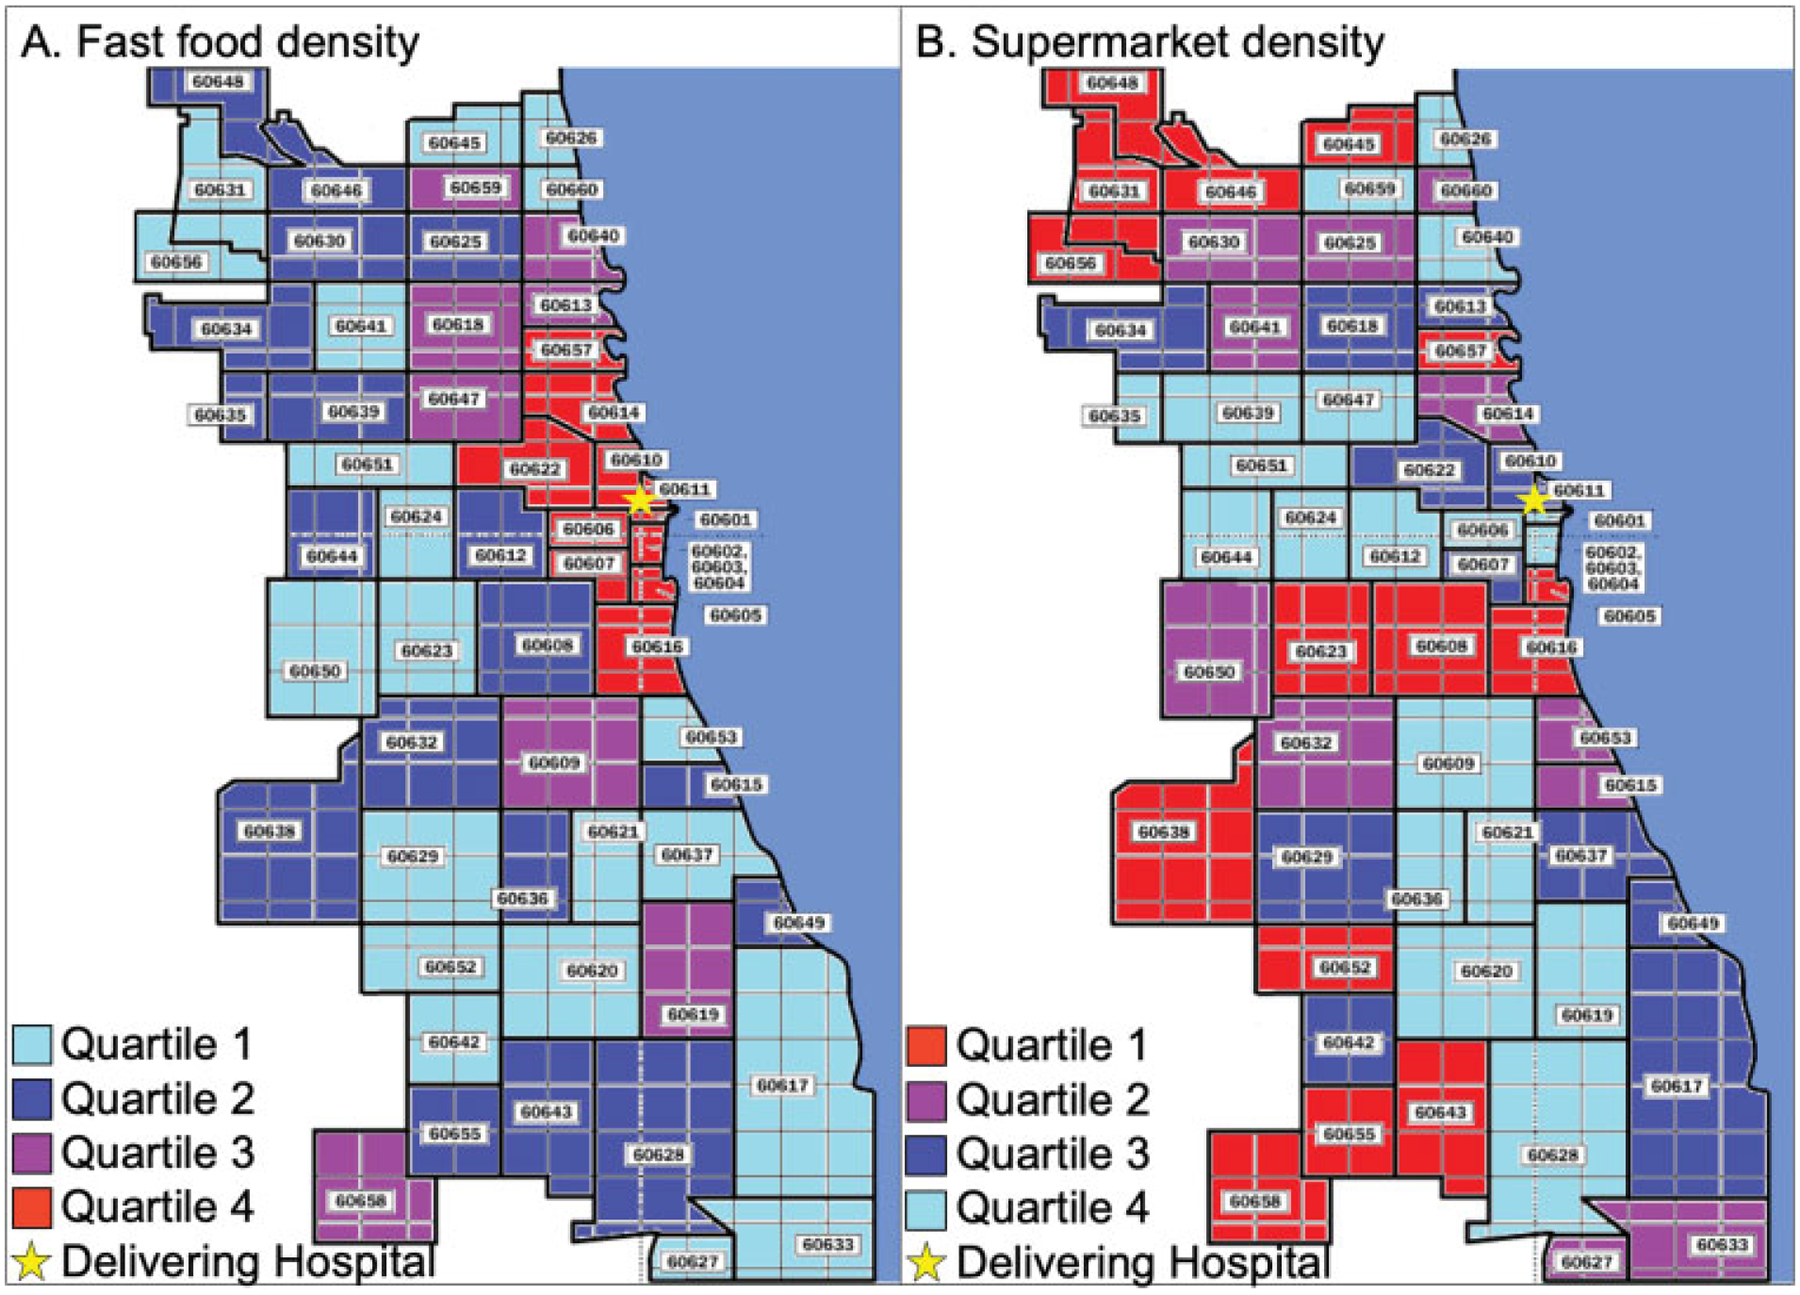
Fast food density (a) and supermarket density (b) by ZIP codes in Chicago, Illinois. Fast food density is calculated as the number of fast food restaurants per 100,000 residents. Quartile 1: <72.5; quartile 2: 72.5 to 90.4; quartile 3: 90.5 to 109; quartile 4: >109. Supermarket density is calculated as the number of supermarkets per 100,000 residents. Quartile 1: <19; quartile 2: 19 to 26.5; quartile 3: 26.6 to 33.8; quartile 4: >33.8. ZIP codes shaded in red correspond to negative food environments (fast food density quartile 4 and supermarket density quartile 1).
Demographic and clinical characteristics were abstracted directly from the electronic medical record used for clinical care. Missing or incomplete data were rereviewed by a member of the study team to ensure reliability. We assessed sociodemographic factors such as age, self-reported race/ethnicity, insurance type at the time of delivery, and primary language spoken, as well as medical and obstetric characteristics such as body mass index (BMI) at delivery and GDM type (diet-controlled vs. medication-requiring), which can affect perinatal outcomes. We assessed four major neonatal outcomes associated with degree of GDM control: LGA neonate, shoulder dystocia, neonatal hypoglycemia, and NICU admission greater than 3 days. LGA was defined as birthweight above the 90th percentile for gestational age. Shoulder dystocia was defined as a failure to deliver the fetal shoulders with gentle downward traction on the fetal head, requiring additional obstetric maneuvers to facilitate delivery. Neonatal hypoglycemia was defined as neonatal glucose less than 40 mg/dL before hospital discharge.11
Demographic and baseline characteristics were assessed across FFD quartiles and SD quartiles using chi-square, analysis of variance, and Kruskal–Wallis tests, as appropriate. Quartile 1 represented the lowest FFD or SD, and quartile 4 represented the highest density. The frequencies of perinatal outcomes were compared across FFD and SD quartiles using a nonparametric test of trend. Elements of a poor food environment are hypothesized to include high density of fast food and low availability of fresh food. For these reasons, we chose high (Q4) FFD and low (Q1) SD as the primary exposures of interest. To estimate the association of highest (Q4) FFD and lowest (Q1) SD with adverse perinatal outcomes, multivariable logistic regression modeling was used. We estimated the adjusted odds ratio (aOR) and 95% confidence interval (CI) for each of the main outcomes by the highest versus all lower FFD quartiles (Q4 vs. Q1–Q3 combined) and the lowest versus all higher SD quartiles (Q1 vs. Q2–Q4 combined). Initial models included factors identified from the literature as being associated with the outcomes of interest (maternal age, race, BMI, type of GDM, and gestational age at delivery) as well as factors that were significantly associated with the main exposures, FFD or SD, in bivariable analysis, with p < 0.2. Stepwise, backward elimination using a change-in-effect method was performed to reduce the models to include only those factors that significantly confounded the relationship between the exposure and outcome. The final models retained any confounders that changed the exposure outcome odds ratio by more than 10% when removed from the model. In a secondary analysis, we also evaluated the association between the ratio of fast food restaurants to supermarkets and each of the perinatal outcomes.
All analyses were performed with Stata, Version 14.0 (StataCorp, College Station, TX). All tests were two-tailed, and p < 0.05 was used to define significance. Approval for this study was obtained from the Northwestern University’s Institutional Review Board.
Results
Fast Food Density
During the study period, 2,373 women met eligibility criteria. The majority of women had diet-controlled GDM(73.4%), with a mean BMI at delivery of 33.2 ± 8.4 kg/m2. Women who lived in the highest FFD areas were less likely to have public insurance and more likely to be non-Hispanic white, married, and nulliparous and to speak English as their primary language (Table 1). There was no significant difference in type of GDM; however, women who lived in the highest FFD quartile had statistically significantly lower BMI.
Table 1.
Demographic and obstetric characteristics by fast food density
| FFD quartile 1 (n = 603) |
FFD quartile 2 (n = 583) |
FFD quartile 3 (n = 593) |
FFD quartile 4 (n = 594) |
p-Value | |
|---|---|---|---|---|---|
| Public insurance | 204 (39) | 208 (39.9) | 140 (26.4) | 95 (18.1) | <0.001 |
| Age (years) | 33.8 ± 5.5 | 33.7 ± 5.2 | 33.8 ± 5.1 | 33.8 ± 5.1 | 0.97 |
| Race/ethnicity | <0.001 | ||||
| Non-Hispanic white | 178 (35) | 148 (30) | 241 (49.6) | 247 (53.4) | |
| Non-Hispanic black | 114 (22.4) | 81 (16.4) | 57 (11.7) | 44 (9.5) | |
| Hispanic | 175 (34.4) | 218 (44.2) | 113 (23.3) | 57 (12.3) | |
| Asian | 39 (7.6) | 45 (9.1) | 75 (15.4) | 114 (24.6) | |
| Other | 3 (0.6) | 1 (0.2) | 0 | 1 (0.2) | |
| Non-English language | 58 (11.2) | 53 (10.2) | 36 (6.7) | 28 (5.3) | 0.001 |
| Married | 388 (66.9) | 363 (65.5) | 429 (75.4) | 464 (82.6) | <0.001 |
| Nulliparous | 245 (46.4) | 224 (44.4) | 288 (54.7) | 331 (63.7) | <0.001 |
| Gestational diabetes mellitus type | 0.98 | ||||
| Diet-controlled A1 | 440 (73) | 426 (73.1) | 437 (74) | 439 (73.9) | |
| Medication-managed A2 | 163 (27) | 157 (26.9) | 156 (26) | 196 (26.1) | |
| Body mass index at delivery (kg/m2) | 33.8 ± 7.5 | 34.2 ± 9.1 | 33.2 ± 7.7 | 31.8 ± 9 | <0.001 |
| Gestational age at delivery (weeks) | 38.2 ± 2.6 | 38.4 ± 2.2 | 38.3 ± 2.6 | 38.3 ± 3.3 | 0.60 |
| Cesarean delivery | 329 (38.1) | 309 (35.6) | 340 (37) | 301 (37.9) | 0.68 |
Abbreviation: FFD, fast food density.
Note: Data are presented as n (%) or as mean ± standard deviation.
Frequencies of adverse perinatal outcomes by FFD quartile are shown in Table 2. As FFD increased, there was a statistically significant trend toward fewer LGA births and fewer births complicated by shoulder dystocia (p = 0.01 for both). There were no significant trends noted across increasing FFD quartiles and neonatal hypoglycemia or NICU admission. After adjusting for confounding factors, residence in the highest (Q4) FFD quartile was associated with lower odds of LGA status neonate (aOR: 0.67; 95% CI: 0.47–0.96) compared with residence in the three lower FFD quartiles combined (Table 2). Other variables such as maternal BMI did not significantly change the association between exposure and outcome and thus did not remain in this final, parsimonious final model. There were no significant associations noted between high FFD, and shoulder dystocia, neonatal hypoglycemia, or NICU admission (Table 2).
Table 2.
Neonatal outcomes by fast food density
| FFD quartile 1 (n = 603) |
FFD quartile 2 (n = 583) |
FFD quartile 3 (n = 593) |
FFD quartile 4 (n = 594) |
Highest (Q4) vs. lower (Q1–3) FFD, aOR (95% CI)a |
|
|---|---|---|---|---|---|
| LGA neonate | 79 (13.6) | 87 (15.3) | 67 (11.7) | 56 (9.7) | 0.67 (0.47–0.96) |
| Shoulder dystocia | 27 (5.9) | 17 (3.8) | 10 (2.2) | 15 (3.1) | 0.47 (0.22–1.01) |
| Neonatal hypoglycemia | 46 (7.6) | 58 (10) | 66 (11.1) | 63 (10.6) | 1.09 (0.78–1.51) |
| NICU admission > 3 days | 55 (9.1) | 57 (9.8) | 62 (10.5) | 74 (12.5) | 1.12 (0.83–1.49) |
Abbreviations: aOR, adjusted odds ratio; CI, confidence interval; FFD, fast food density; LGA, large for gestational age; NICU, neonatal intensive care unit; Q, quartile.
Note: p-values for nonparametric test of trend across quartiles were 0.01 for both LGA neonate and shoulder dystocia, and p-values for neonatal hypoglycemia and NICU admission > 3 days were >0.05.
Final model after backward elimination included adjustment for nulliparity, primary language (English vs. non-English), type of gestational diabetes, and gestational age at delivery.
Supermarket Density
Women who lived in the lowest SD areas were less likely to have public insurance and more likely to be non-Hispanic white and married and to speak English as their primary language (Table 3). There was no significant difference in type of GDM; however, women who lived in the lowest SD quartile had lower BMI. There did not appear to be any statistically significant trends of association between SD quartile and frequency of neonatal outcomes (Table 4). Residence in the lowest (Q1) SD quartile was not significantly associated with higher odds of LGA neonate (aOR: 1.24; 95% CI: 0.88–1.76). There were also no significant associations noted between low SD, and shoulder dystocia, neonatal hypoglycemia, or NICU admission (Table 4).
Table 3.
Demographic and obstetric characteristics by supermarket density
| SD quartile 1 (n = 602) |
SD quartile 2 (n = 600) |
SD quartile 3 (n = 584) |
SD quartile 4 (n = 608) |
p-Value | |
|---|---|---|---|---|---|
| Public insurance | 93 (17.3) | 139 (26.2) | 167 (32.2) | 246 (46.8) | <0.001 |
| Age (years) | 33.8 ± 5.4 | 33.9 ± 5.2 | 33.9 ± 5.1 | 33.7 ± 5.2 | 0.83 |
| Race/ethnicity | <0.001 | ||||
| Non-Hispanic white | 278 (57.9) | 219 (44.4) | 206 (42.2) | 109 (21.7) | |
| Non-Hispanic black | 47 (9.8) | 60 (12.2) | 62 (12.7) | 124 (24.7) | |
| Hispanic | 84 (17.5) | 127 (25.8) | 164 (33.6) | 188 (37.4) | |
| Asian | 71 (14.8) | 85 (17.2) | 54 (11.1) | 79 (15.7) | |
| Other | 0 | 2 (0.4) | 2 (0.4) | 3 (0.6) | |
| Non-English language | 23 (4.3) | 46 (8.6) | 50 (9.6) | 57 (10.7) | 0.001 |
| Married | 476 (82.6) | 442 (77.3) | 394 (70.6) | 351 (60.7) | <0.001 |
| Nulliparous | 288 (55.1) | 283 (54.6) | 261 (49.9) | 279 (52.1) | 0.30 |
| Gestational diabetes mellitus type | 0.90 | ||||
| Diet-controlled A1 | 441 (73.3) | 437 (72.8) | 430 (73.6) | 454 (74.7) | |
| Medication-managed A2 | 161 (26.7) | 163 (27.2) | 154 (26.4) | 154 (25.3) | |
| Body mass index at delivery (kg/m2) | 32.6 ± 7.3 | 32.5 ± 7.4 | 33.5 ± 9.3 | 34 ± 9.2 | 0.01 |
| Gestational age at delivery (weeks) | 38.1 ± 3.3 | 38.5 ± 2.3 | 38.2 ± 2.3 | 38.3 ± 2.6 | 0.05 |
| Cesarean delivery | 235 (39) | 229 (38.2) | 205 (35.1) | 210 (34.5) | 0.28 |
Abbreviation: SD, supermarket density.
Note: Data are presented as n (%) or as mean ± standard deviation.
Table 4.
Neonatal outcomes by supermarket density
| SD quartile 1 (n = 602) |
SD quartile 2 (n = 600) |
SD quartile 3 (n = 584) |
SD quartile 4 (n = 608) |
Lowest (Q1) vs. higher (Q 2–4) SD, aOR (95% CI)a | |
|---|---|---|---|---|---|
| LGA neonate | 74 (12.6) | 73 (12.5) | 75 (13.4) | 66 (11.2) | 1.24 (0.88–1.76) |
| Shoulder dystocia | 8 (1.7) | 19 (4) | 26 (5.6) | 17 (3.6) | 0.41 (0.16–1.05) |
| Neonatal hypoglycemia | 55 (9.1) | 63 (10.5) | 59 (10.1) | 56 (9.2) | 1 (0.69–1.45) |
| NICU admission > 3 days | 68 (11.3) | 57 (9.5) | 55 (9.4) | 73 (12) | 1.07 (0.73–1.56) |
Abbreviations: aOR, adjusted odds ratio; CI, confidence interval; LGA, large for gestational age; NICU, neonatal intensive care unit; Q, quartile; SD, supermarket density.
Note: All p-values for nonparametric test of trend across quartiles > 0.05.
Final model after backward elimination included adjustment for nulliparity, public insurance, primary language, marital status, type of gestational diabetes, and gestational age at delivery.
Fast Food to Supermarket Density Ratio
In our cohort, there was a median of 3.4 fast food restaurants for every supermarket (interquartile range [IQR]: 2.1–5.3). Women with an LGA neonate lived in areas with similar fast food to supermarket ratios compared with those who did not have an LGA neonate (median: 3.3, IQR: 2.1–5 vs. median:3.4, IQR: 2.1–5.3; p = 0.17). Women who had shoulder dystocia had lower fast food to supermarket ratio (median:2.8, IQR: 2.1–3.7) compared with women who did not have shoulder dystocia (median: 3.4, IQR: 2.1–5.5). In multivariable logistic regression, however, no significant associations were noted between the ratio of fast food restaurants to supermarkets and any of the perinatal outcomes.
Comment
MNT is the cornerstone of therapy for GDM. Given the challenges women experience with nutritional therapy in the context of GDM,12 we hypothesized that poorer quality food environment, represented by high availability of fast food and/or low availability of supermarkets, would thus be associated with greater likelihood of adverse perinatal outcomes. Our findings demonstrated that residence in the highest FFD regions was associated with lower odds of an LGA status neonate compared with residence in lower density quartiles. However, no other associations were identified, suggesting the food environment may play only a partial role in mediating disparities in outcomes for women with GDM. Importantly, our findings also did not differ when accounting for maternal BMI at delivery.
Prior work suggests that there is a relationship between the food environment and occurrence of maternal disease in pregnancy, as seen in data from Houston regarding the incidence of GDM.10 Our work extends this concept and suggests that food environment may also affect neonatal outcomes in the context of a GDM diagnosis. However, we surprisingly found an association in the opposite direction than expected, where high FFD was associated with decreased odds of LGA neonate. It is possible that when women have an abundance of food options, they have the opportunity to choose from multiple healthy options and select foods that specifically appeal to them. Of note, unmeasured confounding may partially explain the association between high FFD and low odds of LGA neonate, as some of the regions of highest FFD in our study corresponded to areas of Chicago that are also areas of higher socioeconomic status. However, this was not universally true for all of the regions of highest FFD in our study, and thus differences in socioeconomic status and associated potential differences in education about food cannot completely explain our findings.
Although the food environment has been shown to affect obesity frequency and pregnancy complications such as development of GDM,10,13 some studies have not found the same effect.14 One possible explanation for these conflicting results is a difference in the study design and methods used. A systematic review of the methods used by 51 peer-reviewed studies measuring the effect of the food environment on obesity demonstrated considerable variation in classifying, locating, and analyzing food stores, which resulted in mixed results.15 Furthermore, the food environment that an individual is exposed to is not limited only to the residential neighborhood they live in, although this has been the most commonly used exposure in previous studies. For example, the food environment around where an individual works or visits regularly may impact health and adverse outcomes. Due to the complexity of human mobility, measures of individual activity using newer technology such as Global Positioning System (GPS) tracking may be necessary to more accurately define environmental exposure.16 Additional measures are also needed to evaluate the effect of supplementary programs such as Women, Infants, and Children Food and Nutrition Service, which can augment poor food environments and may not be captured with GPS tracking.
This study has several limitations to consider. In this retrospective observational study, we unable to determine exactly what type of education and nutrition counseling the women received, how far or where women traveled to access food, what food choices they made, or how stable their place of residence during pregnancy may have been. Each of these factors may influence exposure to different food environments and thus are important variables to consider in future studies. Another limitation was that the government-provided business listings used to map fast food and supermarket establishments did not provide detailed information about the exact rates of turnover during an individual woman’s pregnancy. While these directories should be kept up-to-date, our results were limited to the food retailer type and location provided by this resource and the most recent maternal ZIP code recorded in the electronic medical record. High turnover of establishments or frequent maternal relocation, however, would likely bias the findings toward the null. Moreover, it is possible that ZIP codes may not necessarily be the ideal geographic unit to assess the neighborhood environment and that perhaps Chicago ZIP codes do not fully capture hypothesized neighborhood dynamics. Although we included insurance status in models as a proxy for socioeconomic status, a woman’s insurance status is not fully reflective of her available resources, and we were unable to more precisely account for socioeconomic status with factors such as income or education. Additionally, we were not able to assess weight gain during pregnancy or prepregnancy BMI, gestational age at GDM diagnosis, degree of glycemic control, indication for NICU admission, or specific treatments for neonatal hypoglycemia. We were also not able to assess other social determinants of health, such as segregation in Chicago, which have been associated with adverse neonatal outcomes.17 Finally, although the size of the population was robust, some outcomes, such as shoulder dystocia, are uncommon; for example, with the available sample size, we only had sufficient power to detect a two-fold difference in shoulder dystocia.
Despite these limitations, our study also had several strengths. This is one of the first studies to evaluate the association between the maternal food environment and adverse neonatal outcomes, and prevention of adverse outcomes is the primary rationale for GDM treatment. Thus, understanding not only whether the food environment affects occurrence of a disease but also the sequelae of the disease once diagnosed is critical to further understanding social determinants of health. Furthermore, this was a diverse cohort of almost 3,000 pregnant women with GDM, which provided 80% power to detect a 40% increase in LGA between the highest and lowest quartiles, assuming a baseline incidence of LGA among women with GDM of 12%. Moreover, in contrast to studies relying on registry or birth certificate data, we had detailed information about all subjects’ medical and obstetrical history, which allowed us to control for sociodemographic and pregnancy factors in our final models.
In conclusion, an abundance of fast food establishments was associated with lower odds of neonatal LGA status among women with GDM, whereas other neonatal outcomes were not associated with fast food or supermarket abundance. As with many social determinants of health, the relationship between the determinant and the health outcome is complex and nuanced; yet, beginning to understand these social and environmental complexities are essential to developing public health strategies to improve maternal and child health. Considering the food environment as well as other social determinants of maternal health is crucial when addressing efforts to reduce disparities and improve neonatal outcomes associated with GDM.
Funding
Research reported in this publication was supported, in part, by the National Institutes of Health’s National Center for Advancing Translational Sciences (Grant Number UL1TR001422) through the Northwestern University Clinical and Translational Sciences Institute Enterprise Data Warehouse Pilot program. Additionally, Lynn M. Yee is supported by the NICHD K12 HD050121–11. The content is solely the responsibility of the authors and does not necessarily represent the official views of the National Institutes of Health.
Footnotes
Note
This study was presented in poster format at the 38th annual meeting of the Society for Maternal–Fetal Medicine, Dallas, TX, January 29 to February 3, 2018.
Conflict of Interest
None declared.
References
- 1.Committee on Practice Bulletins—Obstetrics. Practice Bulletin No. 180: Gestational Diabetes Mellitus. Obstet Gynecol 2017;130(01): e17–e37 [DOI] [PubMed] [Google Scholar]
- 2.Ferrara A Increasing prevalence of gestational diabetes mellitus: a public health perspective. Diabetes Care 2007;30(Suppl 2): S141–S146 [DOI] [PubMed] [Google Scholar]
- 3.Yee LM, McGuire JM, Taylor SM, Niznik CM, Simon MA. Social and environmental barriers to nutrition therapy for diabetes management among underserved pregnant women: a qualitative analysis. J Nutr Educ Behav 2016;48(03):170–180 [DOI] [PubMed] [Google Scholar]
- 4.Finkelstein EA, Strombotne KL, Zhen C, Epstein LH. Food prices and obesity: a review. Adv Nutr 2014;5(06):818–821 [DOI] [PMC free article] [PubMed] [Google Scholar]
- 5.Johnson F, Wardle J. Variety, palatability, and obesity. Adv Nutr 2014;5(06):851–859 [DOI] [PMC free article] [PubMed] [Google Scholar]
- 6.Gordon-Larsen P Food availability/convenience and obesity. Adv Nutr 2014;5(06):809–817 [DOI] [PMC free article] [PubMed] [Google Scholar]
- 7.Ahern M, Brown C, Dukas S. A national study of the association between food environments and county-level health outcomes. J Rural Health 2011;27(04):367–379 [DOI] [PubMed] [Google Scholar]
- 8.Bodicoat DH, Carter P, Comber A, et al. Is the number of fast-food outlets in the neighbourhood related to screen-detected type 2 diabetes mellitus and associated risk factors? Public Health Nutr 2015;18(09):1698–1705 [DOI] [PMC free article] [PubMed] [Google Scholar]
- 9.Laraia BA, Siega-Riz AM, Kaufman JS, Jones SJ. Proximity of supermarkets is positively associated with diet quality index for pregnancy. Prev Med 2004;39(05):869–875 [DOI] [PubMed] [Google Scholar]
- 10.Kahr MK, Suter MA, Ballas J, et al. Geospatial analysis of food environment demonstrates associations with gestational diabetes. Am J Obstet Gynecol 2016;214(01):110.e1–110.e9 [DOI] [PMC free article] [PubMed] [Google Scholar]
- 11.Adamkin DH. Neonatal hypoglycemia. Semin Fetal Neonatal Med 2017;22(01):36–41 [DOI] [PubMed] [Google Scholar]
- 12.Hui AL, Sevenhuysen G, Harvey D, Salamon E. Food choice decision-making by women with gestational diabetes. Can J Diabetes 2014; 38(01):26–31 [DOI] [PubMed] [Google Scholar]
- 13.Young C, Laurent O, Chung JH, Wu J. Geographic distribution of healthy resources and adverse pregnancy outcomes. Matern Child Health J 2016;20(08):1673–1679 [DOI] [PubMed] [Google Scholar]
- 14.Janevic T, Borrell LN, Savitz DA, Herring AH, Rundle A. Neighbourhood food environment and gestational diabetes in New York City. Paediatr Perinat Epidemiol 2010;24(03): 249–254 [DOI] [PMC free article] [PubMed] [Google Scholar]
- 15.Gamba RJ, Schuchter J, Rutt C, Seto EY. Measuring the food environment and its effects on obesity in the United States: a systematic review of methods and results. J Community Health 2015;40(03):464–475 [DOI] [PubMed] [Google Scholar]
- 16.Lyseen AK, Hansen HS, Harder H, Jensen AS, Mikkelsen BE. Defining neighbourhoods as a measure of exposure to the food environment. Int J Environ Res Public Health 2015;12(07): 8504–8525 [DOI] [PMC free article] [PubMed] [Google Scholar]
- 17.Salow AD, Pool LR, Grobman WA, Kershaw KN. Associations of neighborhood-level racial residential segregation with adverse pregnancy outcomes. Am J Obstet Gynecol 2018;218(03):351. e1–351.e7 [DOI] [PubMed] [Google Scholar]