. 2020 Apr 14;9:e54575. doi: 10.7554/eLife.54575

Figure 1. Dicistroviridae genome organization, in vitro complex formation and cryo-EM maps.

(A) Top, schematic representation of the genome organization of Dicistroviruses. The approximate genomic lengths of the different components are indicated by the arrows. Bottom, detailed view of the region described as harboring the IRES activity of the 5'-UTR of the CrPV. On the right, the sequence adjacent to the initiation AUG codon of ORF1, located at nucleotide 709 and preceded by a ‘start-stop uORF’ indicated in red. (B) Sucrose-gradient analysis showed that the 5'-UTR-IRES is dependent on eIF3 in order to form a stable complex with the 40S. 5'-UTR-IRES co-migrates with the 40S only in the presence of eIF3 (top). By contrast, HCV IRES does not require eIF3 for 40S binding (bottom). (C) Representative cryo-EM micrograph of the 40S–5'-UTR-IRES–eIF3 complex. Bottom, representative reference-free 2D class averages used for further image processing. (D, E) After 3D classifications, two classes showing density for 40S (yellow), eIF3 (red) and 5'-UTR-IRES (blue) could be identified in the dataset. Class-1 (D) presents a non-swiveled configuration of the 40S head and the density for eIF3d is absent. Class-2 (E) shows a swiveled configuration of the 40S head (arrows) with eIF3d (indicated) contacting eIF3's core subunits.

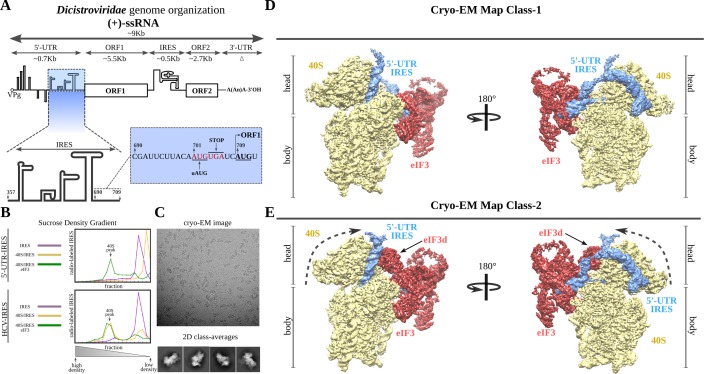
Figure 1.

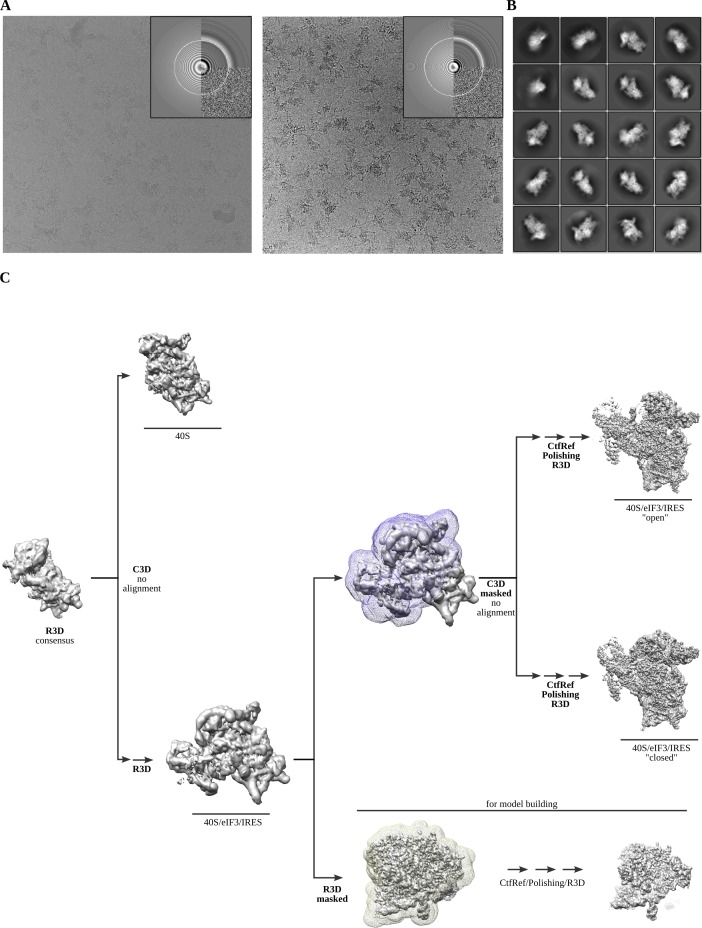
Figure 1—figure supplement 1. Cryo-EM representative images and classification workflow.

Figure 1—figure supplement 1.

(A) Two examples of aligned micrographs used for image processing. Data collection in thick ice was instrumental to avoid complex disassembly and preferential orientation. (B) Representative reference-free 2D averages. (C) The classification scheme followed to identify the two described complex classes.

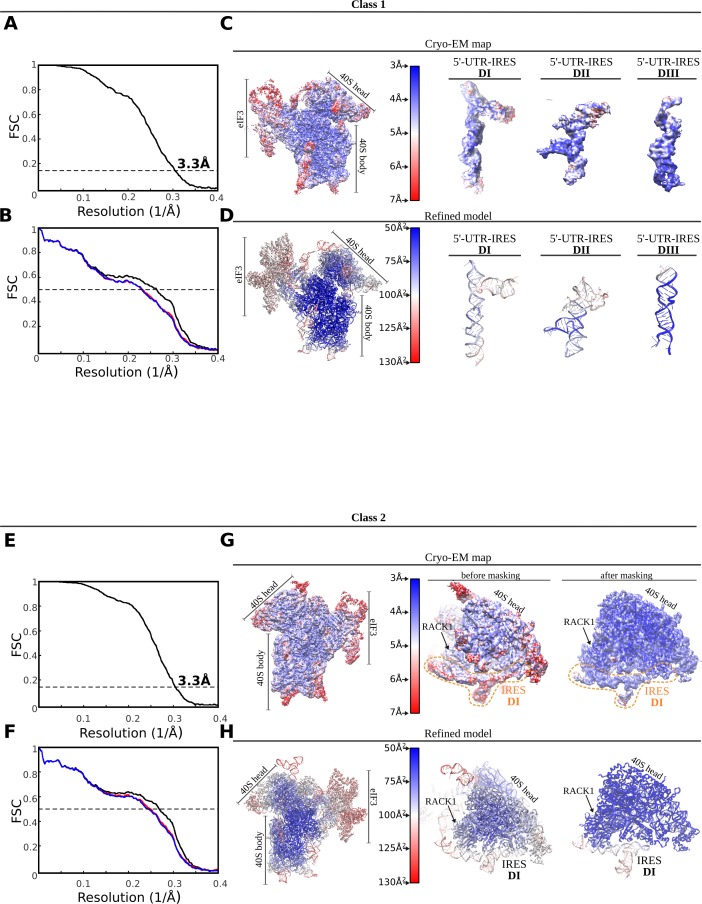
Figure 1—figure supplement 2. FSC correlation curves, local resolution and model validation.

Figure 1—figure supplement 2.

Top, class-1. (A) Gold-standard Fourier Shell Correlation (FSC) curves between half-maps independently refined in Relion3. Global resolution by the 0.143 cutoff criterium was estimated to be 3.3 Å. (B) FSC between the final refined model and the final unsharpened map (black curve). The absence of model overfitting is demonstrated by the overlapping of FSC curves between half-map 1 (included in the refinement, blue) and the model and half-map 2 (not included in the refinement, red). (C) Unsharpened map colored according to local resolution as computed by ResMap. On the right, detailed views for the three 5'-UTR-IRES domains. (D) Refined model colored according to estimated B-factors computed by Refmac. Bottom, class-2. (E) Gold-standard FSC curves between half-maps independently refined in Relion3. Global resolution by the 0.143 cutoff criterium was estimated to be 3.3 Å. (F) FSC between the final refined model and the final unsharpened map (black curve). The absence of model overfitting is demonstrated by the overlapping of FSC curves between half-map 1 (included in the refinement, blue) and the model and half-map 2 (not included in the refinement, red). (G) Unsharpened map colored according to local resolution as computed by ResMap. On the right, detailed views for the 40S head before and after masked refinements. (H) Refined model colored according to estimated B-factors computed by Refmac.