Abstract
Micropipette aspiration, optical tweezers, rheometry, or ecktacytometry have been used to study the shape recovery of healthy human Red Blood Cells (RBCs) and measure associated relaxation times of the order of 100–300 ms. These measurements are in good agreement with the Kelvin–Voigt model, which describes the cell as a visco-elastic material, predicting that its relaxation time only depends on cell intrinsic properties. However, such mechanical solicitation techniques are far from being relevant regarding RBC solicitation in vivo. In this paper, we report for the first time the existence of two different behaviors of the RBC shape recovery while flowing out of a microfluidic constricted channel. The calculation of the viscous stress corresponding to the frontier between the two recovery modes confirms that the RBC resistance to shear is the elastic property dominating the transition between the two recovery behaviors. We also quantified associated recovery times and report values as low as 4 ms—which is almost two decades smaller than the typical RBC relaxation time—at high viscosity and flow velocity of the carrier fluid. Although we cannot talk about relaxation time because the cell is never at rest, we believe that the measured shape recovery time arises from the coupling of the cell intrinsic deformability and the hydrodynamic stress. Depending on the flow conditions, the cell mechanics becomes dominant and drives the shape recovery process, allowing the measurement of recovery times of the same order of magnitude than relaxation times previously published. Finally, we demonstrated that the measurement of the shape recovery time can be used to distinguish Plasmodium falciparum (causing malaria) infected RBCs from healthy RBCs.
I. INTRODUCTION
The Red Blood Cell (RBC) membrane is composed of a phospholipidic bilayer, associated with a 2D spectrin network composing the cytoskeleton1 and enclosing a viscous cytoplasm loaded with hemoglobin. The mechanical properties of the cytoskeleton combined with a high surface to volume ratio give RBCs an impressive ability for reversible deformation. This particular property is very crucial for RBCs as they spend their 120 days of life flowing through microcapillaries to transport oxygen through the whole organism. The combination between the phospholipid bilayer and the cytoskeleton constituting its membrane confers to the RBC a visocoelastic behavior, which is intermediary between that of an elastic solid, characterized by energy conservation and a purely viscous Newtonian liquid, characterized by energy dissipation. This type of behavior can be described by the Kelvin–Voigt model,2 which is a linear combination of a spring and a damping Newtonian element. Using the Kelvin–Voigt model, the pioneering study of Hochmuth et al.3 predicted that the time necessary for RBCs to relax, from a deformed state to their stress-free equilibrium shape, is a constant, which depends only on the mechanical properties of the membrane. This constant is defined as , where is the 2D membrane viscosity and , its shear modulus.
Knowing that has been estimated4–6 to be of the order of magnitude of 0.5– N s/m and that has been measured experimentally through different methods3,4,7–10 in the range N/m, can be calculated to be of the order of 100 ms.
Different methods have been reported in the literature to characterize experimentally this relaxation time in static configurations, such as micropipette aspiration,8,11,12 optical tweezers,3,13 and electrodeformation.14 has also been measured under flow conditions, as, for example, using rheometry,15,16 ecktacytometry,17 and more recently microfluidics.18 All of these studies, which have been performed in low viscosity physiological buffer as the external medium, either in static or under flow, report roughly the same relaxation time to be of the order of 100–300 ms.8,11,15,18 Those values are in good agreement with the calculation of made by Hochmuth using the Kelvin–Voigt model to describe the RBC mechanics.
In the present paper, we propose to study experimentally the shape recovery of healthy human RBCs flowing out of a microfluidic constricted channel. We report for the first time two different types of shape recovery behaviors for the cell after exiting the constricted channel, depending on the viscous stress applied. We demonstrated that the transition between the two recovery modes is directly related to the RBC elastic properties. We measured experimentally associated shape recovery times, , defined as the time necessary for the cell to return to a steady shape after exiting the constricted geometry. Because RBC steady state is reached under hydrodynamic stress rather than at rest, the recovery time does not directly correspond to the relaxation time. However, in specific experimental conditions, values obtained for recovery times were found to be comparable to typical intrinsic relaxation time values reported in the literature while reaching values as low as 4 ms with very different flow parameters. From the highly abundant literature dealing with the flow of RBCs in close-fitting constriction, only the paper from Braunmüller et al.18 looked at the RBC shape relaxation. They report the existence of two relaxation times. A first relaxation time , corresponding to the time necessary to change from the compressed shape inside the microchannel to adopt the parachute-like shape, is found to be in the range 0.11–0.52 s, which is in good agreement with relaxation times reported by others. The second time, , corresponds to the time necessary to deform from the parachute-like shape to the discoidal shape and was measured to be of the order of 9–49 s. They found that the two times vary linearly with respect to each other. However, to the best of our knowledge, we are the first ones highlighting the coupling between the cell mechanics and the hydrodynamics at the exit of a microfluidic constriction, by measuring the variation of shape recovery time upon buffer viscosity and flow speed. Finally, the use of the shape recovery time to discriminate healthy from pathological cells was demonstrated on Plasmodium falciparum infected RBCs (iRBCs).
II. MATERIALS AND METHODS
A. Experiments
1. Device geometry
The microfluidic systems were made in polydimethylsiloxane (PDMS, Sylgard), using standard soft-lithography techniques19 and sealed on glass via an oxygen plasma treatment (Harrick plasma). The main width of the channel was set to 15, 25 and 50 m while keeping a fixed height of 5 m. A succession of 15 tooth-like shapes—composed of a narrowing followed by a widening—were implemented. This geometry is referred to as the oscillating width channel (OWC). In the zone of interest of the geometry, the channel width decreases from to 5 m and then increases up to 25 m. Each constriction and widening has a length of 10 m, and this width oscillation is repeated over a total length m as illustrated in Fig. 1. This specific geometry was chosen for its ability to quickly center RBCs (cf. Fig. 2).
FIG. 1.
The microfluidic channel used to study the shape recovery time of RBCs under confined flow is composed of 14 tooth-like shaped constrictions. The different dimensions are reported in the picture; here, m. The inset shows a close-up of a RBC in which the 2D projected area is fitted by an ellipse (white dashed line). The two axes of the ellipse along and normal to the flow direction, respectively, and , are defined.
FIG. 2.
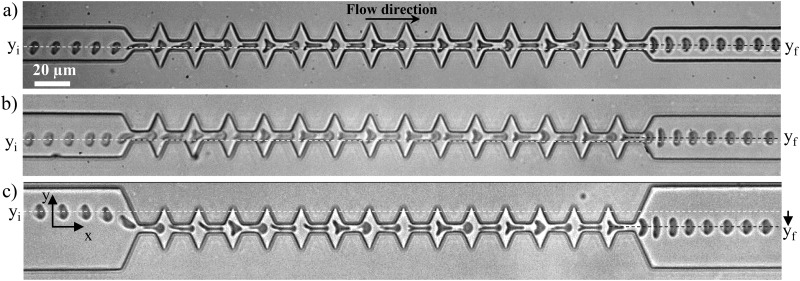
Time lapse microscopic images of cells entering the microfluidic channel at various off-centered positions, denoted as , and exiting centered in the channel, . The origin of the axis was chosen to coincide with the center axis of the channel. (a) m ( mPa s and m s), (b) m ( mPa s and m s), and (c) m ( mPa s and m s).
2. Suspension preparation
30 l of fresh blood were drawn from healthy volunteers by finger prick. RBCs were isolated from the rest of the sample by centrifugation and then re-suspended in phosphate buffered saline (PBS, Sigma-Aldrich, France), in which viscosity was varied from 1.3 to 31.5 mPa s, by solubilization of Dextran (Leuconostoc mesenteroides, , Sigma-Aldrich, France). All solutions were filtered at 200 nm prior to utilization. The RBC concentration was adjusted to approximately RBCs/ml in order to avoid the flow of several cells simultaneously in the microchannel. Malaria infected RBCs (iRBCs) were obtained by culture of 3D7 Plasmodium falciparum clone maintained in vitro as previously described.20 Healthy human RBCs were suspended in Roswell Park Memorial Institute Medium (RPMI) culture medium supplemented with 0.5% AlbuMAX II, 2.1 g l NaHCO, 0.025 g l Hypoxanthine, 25 mM HEPES, and 20 g ml Gentamicin at 5% hematocrit and inoculated with infected RBCs. Enrichment of iRBCs was obtained using a Percoll discontinuous density gradient centrifugation method.21 The isolated iRBC layer was washed three times in the culture medium before being suspended in supplemented RPMI. Parasitemia was evaluated by microscopical examination of Giemsa colored blood smear at roughly 80% as illustrated in Fig. 1 in the supplementary material. Finally, iRBCs were washed twice with PBS and suspended in a viscous saline buffer ( mPa s) at the optimum concentration for microfluidic experiments. A more detailed version of the iRBC enrichment procedure can be found in the supplementary material.
3. Experimental setup
The RBC suspension was injected into the microfluidic channel using a pressure driven flow. The applied pressure was varied between 13 and 500 mbar depending on the targeted cell velocity. The lower pressure gradients were achieved using hydrostatic setup, i.e., a height difference was set between the syringe containing the blood sample and the outlet reservoir, whereas higher pressure gradients were applied using a pressure regulator (Bellofram and Fluigent) with a precision of 1 mbar. Video-microscopic recordings of the cells behavior were performed with an inverted phase contrast microscope (Leica DMI 4000 B, Germany) with a magnification and a high speed camera (Mikrotron EoSens MC1362, Germany).
4. Image analysis routine
Post-processing of the movies was performed using a self-edited Matlab code to study cell dynamics and deformation. On every image, the RBC contour was fitted with an elliptical shape (Fig. 1); the position of the ellipse center of mass and the length of both axes, along (-direction) and perpendicular to (-direction) the flow direction, respectively, 2 and 2, were measured. Various parameters were then calculated: the cells velocity (see Fig. 2 in the supplementary material for a detailed definition of ) and the deformation index , defined as .
B. Numerical simulations
For the estimation of the hydrodynamic stress, 3D numerical simulations were performed using Comsol Multiphysics® to solve the hydrodynamic flow equations. Simulations were performed by applying a pressure gradient flow between the inlet and outlet of the microfluidic channel, using different values of fluid viscosities 2.8, 8.6, and 31.5 mPa s.
III. RESULTS AND DISCUSSIONS
A. Centering effect of the geometry
Although we focused in this paper on the cell behavior at the exit of a constricted channel, we have chosen to implement an oscillating width channel, including several 10 m long constrictions, instead of a single 10 m long one, because of the centering effect associated with the repetition of the restrictions. Indeed, one may notice from Fig. 2 that whatever their position in the inlet main microchannel, , RBCs tended to exit the geometry at the same position , associated with the half of , hence illustrating the centering effect of the design. Several studies reported in the literature have used different techniques to focus cells and facilitate single cell study. For example, sheath flow, where two streams of liquid force the alignment of the cells on the chip, has been reported.22 Similar results can be achieved using active approaches such as acoustophoresis23 or electrophoresis.24,25 The implementation of a geometrical constriction has been demonstrated to focus cells toward the centerline of the device when the width of the channel is subsequently increased.26,27 Finally, in order to obtain a single file of cells, Tsai et al. have used a 4.5 m wide and 30 m long geometrical restriction to center RBCs and align them so they would enter the evaluation zone on the same streamline.28
In the case of a unique 10 m long constriction, cells arriving off-centered in the channel tended to exit also off-centered. The centering effect associated with the oscillating width channel ensures a symmetrical deformation of the cells at the exit of the last narrowing, prevents them from rotating, and imposes that all cells are exposed to the same hydrodynamic stress, all cells being aligned on the same flow line. This centering effect is more pronounced for = 50 m, where it is more necessary as cells might arrive from various off-centered positions. Indeed, we can see that the centering amplitude , illustrated by the dashed lines, is larger for m (see Fig. 3 in the supplementary material). Finally, we have verified that the history of deformation, via the repetition of the constrictions, did not impact the mechanical response of healthy RBC (hRBC), by measuring the recovery time of healthy RBCs both after one single 10 m long geometric restriction and at the exit of the 15 repetitions of the 10 m long restriction (see Fig. 4 in supplementary material).
B. Dual shape recovery behavior
Video-microscopic recordings of RBCs flowing through a microfluidic channel with oscillating width allowed the visualization of cell deformation as it traveled through the device. The cell entering the 15 m wide channel presented a parachute-like shape, typical of RBCs in confined flow. As it approached the first constriction, the cell got compressed, which is traduced by its elongation in the flow direction (Fig. 2).
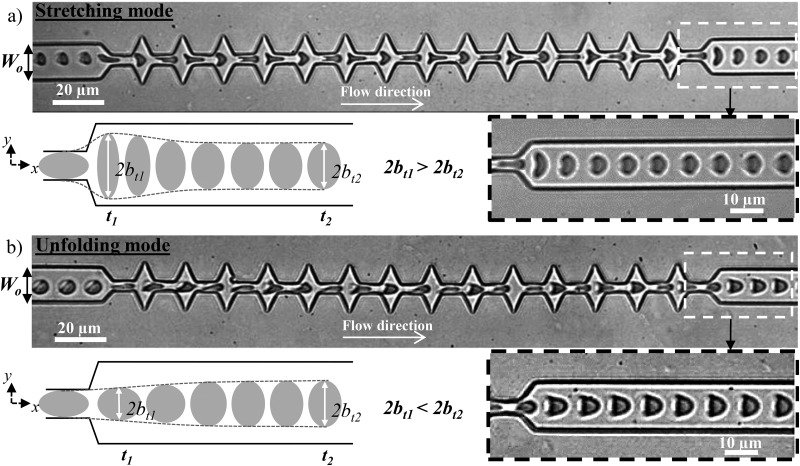
Then, it underwent a stretching along the y-axis when entering the widening, before being compressed again by the next constriction. This cycle of compression-stretching is repeated due to the series of narrowings and enlargements. Finally, as it exited the last narrowing, the cell returns to its final parachute-like shape. Because the steady state does not correspond to resting conditions, the recovery process by which cells return to their final shape, after flowing out of the geometry, cannot be directly assimilated to a cell relaxation. Thus, this recovery process does not depend only on its mechanics but rather on a coupling between the relaxation and the flow. At the exit, two different recovery behaviors were observed according to the experimental conditions as illustrated by the sequences of the deformation presented in Fig. 3.
FIG. 3.
Sequences of the deformation of two healthy RBCs under flow (a) at high and (b) at low speed and viscosity of the external medium. Along the geometry, both cells get compressed and elongated perpendicular to the flow direction when entering each narrowing and widening, respectively. (a) At high hydrodynamic stress, as the cell exits, it is stretched by the extensional flow before returning to the parachute-like shape, unlike at lower stress (b), where the cell recovers directly from the compression without being stretched. The external viscosity and the cell speed at the exit are, respectively, (a) mPa s and m s and (b) mPa s and m s. The schematics show a representation of the typical deformation in the two behaviors at two different times and .
At high speed and viscosity of the carrier fluid [Fig. 3(a)], we observed a first recovery mode—the stretching behavior—which is characterized by a sudden increase of the 2b-axis (normal to the flow direction) of the cell as it exited the last constriction, before recovering slowly its steady state shape as illustrated on the schematic and highlighted on the time lapse close-up [Fig. 3(a)]. At lower speed and external viscosity [Fig. 3(b)], the cell underwent the same compression-stretching cycles and behaved qualitatively similarly with a lower amplitude of deformation than the previous mode in the central zone of the microchannel. However, at the exit, the cell, which was compressed due to the last narrowing, recovers directly a parachute-like shape, without being stretched in the -direction as pointed out on the schematic and the time lapse close-up [Fig. 3(b)]. This mode is referred to as the unfolding behavior.
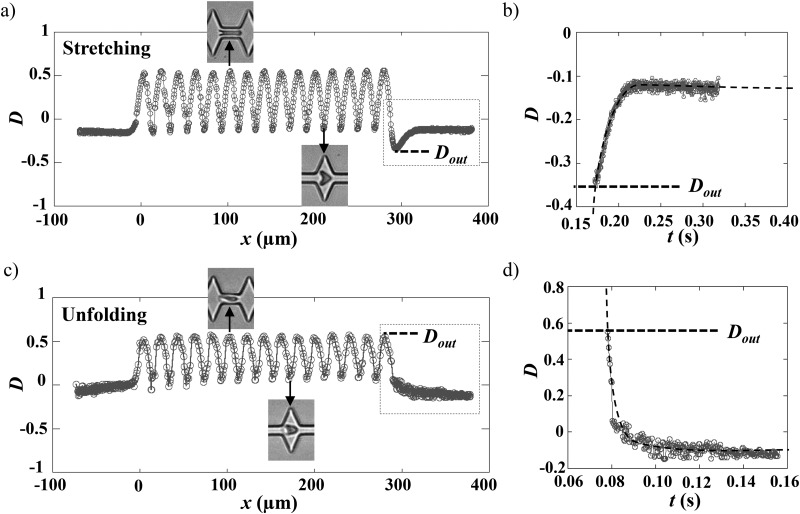
The deformation of the RBCs flowing in our geometry can be quantified using the deformation index D = ()/(), where and are the two axes of the elliptical shape fitting the cell. As an example, the variation of associated with the sequences of deformation presented in Fig. 3 is reported in Fig. 4.
FIG. 4.
Variation of the deformation index vs the position of the cell center of mass (a) and (b) for the stretching and (c) and (d) for the unfolding behaviors. The origin of the graphs was arbitrarily chosen to be the entry of the first narrowing. (b) and (d) show representations of vs time of the two previous curves, where only the time window corresponding to the recovery is reported. The exit of the last narrowing was arbitrarily chosen to be . The dashed lines are exponential fits allowing the determination of the recovery time , with the following equations exp(() and exp((), for unfolding and stretching, respectively, where , , and are constants to be adjusted.
As the RBC maintained its parachute-like shape, in the 15 m wide zone of the channel, the corresponding deformation index was relatively constant and nearly close to zero, hence traducing a projected area roughly circular (). The following oscillations in traduced the deformation undergone by the RBC in response to the oscillating width of the channel. Indeed, increased to positive values () due to the cell compression by the constriction [Figs. 4(a) and 4(c) upper photo] leading to its elongation in the flow direction. On the contrary, when entering an enlargement, it tended to be stretched in the y-direction [Figs. 4(a) and 4(c), lower photo] corresponding to a decrease in , which can reach negative values () depending on the experimental conditions.
In the stretching behavior [Fig. 4(a)], after reaching a maximum value at m, the sudden drop of traduces the large cell stretching after its exit from the last narrowing. Finally, after reaching a minimum, noted , around m, returns exponentially to its initial value and reaches a plateau corresponding to the cell steady shape. In the case of the unfolding behavior presented in Fig. 4(c), reaches a maximum value at m, denoted as ; however, it recovers directly a steady shape according to an exponential decay.
The variation of between the last deformed state at the exit, noted , and the steady shape corresponding to the plateau value were represented as a function of time [Figs. 4(b) and 4(d)]. The experimental data were fitted using an exponential growth or decay, depending on the stretching or unfolding mode, respectively, thus allowing the extraction of the recovery time .
C. The transition between the two recovery behaviors depends on RBC elastic properties
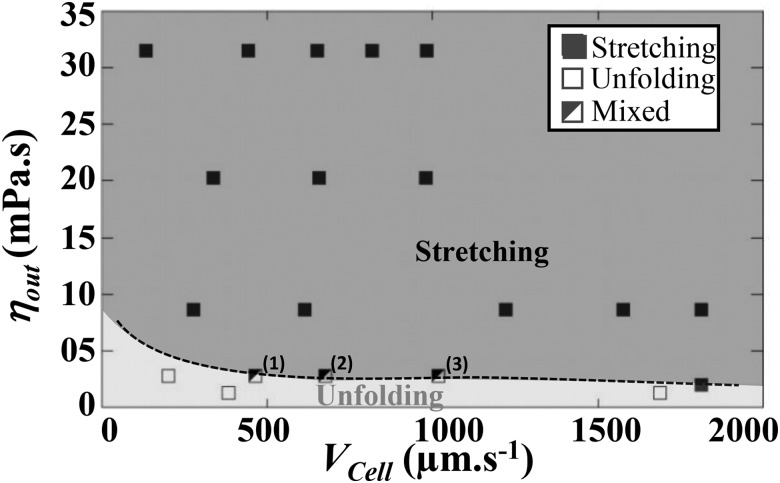
We evaluated the influence of external flow parameters on the shape recovery of healthy RBCs by varying buffer viscosities and cell velocities. We scanned a range of cell speeds from 100 to 2000 m s and the external viscosity was varied from 1 to 31.5 mPa s. We gathered experimental results in a diagram (Fig. 5), where the recovery mode is plotted as a function of and .
FIG. 5.
Experimental recovery diagram representing unfolding (open squares) or stretching (solid squares) behaviors according to the cell velocity and the viscosity of the surrounding medium . The mixed behavior refers to a mode where a portion of the RBCs experiences unfolding, whereas the rest of the population undergoes stretching. The percentages of stretching were (1) 27%, (2) 50%, and (3) 55%, respectively. The dashed line is a guide for the eyes representing the transition between the two modes.
For m s, stretching was observed experimentally for mPa s, whereas unfolding was obtained for mPa s. Thus, in this range of cell speed, the transition between the two recovery modes is mainly dictated by . In the frontier zone (highlighted by the dashed line in Fig. 5), we noticed experimentally a mixed behavior, where a portion of the RBC population experienced stretching, while the other one experienced unfolding. The percentage of the stretching behavior increased with the cell velocity, hence highlighting that the transition depends also on . At a lower cell speed, m s, the transition between the two recovery modes depended strongly on both and .
By increasing the viscosity and velocity of the carrier fluid, we tuned the viscous hydrodynamic stress probed by RBCs, which leads to a transition in shape recovery behavior. Indeed, the diagram reveals that at low viscous stress, the cell resists the deformation and recovers a steady shape according to the unfolding mode, whereas, when the viscous stress is sufficiently high, the RBC gets stretched at the exit and experiences stretching. Therefore, the Capillary number, ratio of the fluid viscous forces to the RBC elastic properties, can be used to describe the shape recovery of RBCs. To elucidate which elastic property dictates the experimental shape recovery of healthy RBCs, we aim at calculating the three Capillary numbers = , , and , associated with the bending modulus , the shear modulus and the stretching modulus , respectively, being the typical size of cells. In parallel, the viscous stress undergone by RBCs at the exit of our geometry was estimated using relation [Eq. (1)]. In a diverging channel, can be expressed29 as
| (1) |
In order to estimate probed by the cell at the exit, we used Comsol Multiphysics® to perform 3D simulations of the flow of buffer solutions at various viscosities in absence of any object. We calculated the local stress , according to Eq. (1) [see Fig. 5 in the supplementary material], for various conditions of and , with corresponding to the maximum velocity of the parabolic profile at the exit of the last constriction. In a first approximation, we considered the velocity gradients at the exit of the oscillating width channel in absence of cells.
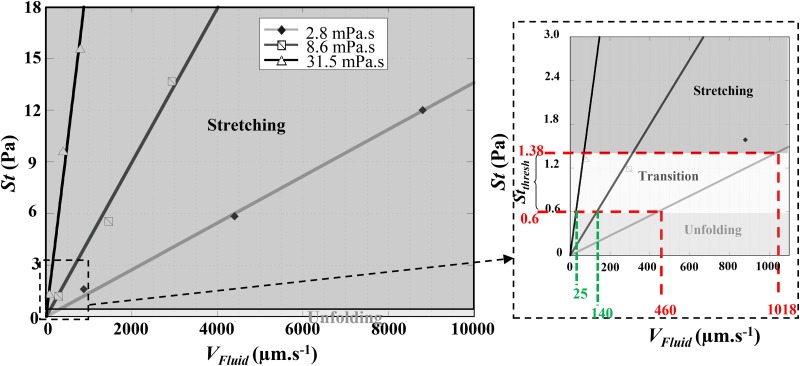
As expected, Fig. 6 illustrates that increases linearly with and varies also with . We report on the graph, the domains where each of the recovery modes is observed experimentally, assuming in a first approximation that . From Fig. 6, we could estimate a range of local stress, , corresponding to the frontier between the two modes.
FIG. 6.
Representation of the estimated applied stress at the exit of the last geometrical constriction vs the flow velocity at this location and the external medium viscosity showing the two behaviors regions (unfolding/stretching) as well as the threshold stress . The inset shows a close-up on the origin of the plot. The gray zone represents the transition zone. Numerical simulations were performed using m.
For hydrodynamic stresses larger than , RBCs are deformed and underwent a stretching behavior, whereas for lower stresses, they experienced unfolding. For mPa s and ranging from 460 to 1018 m s, the zone of the relaxation diagram where the mixed behavior was observed, we estimated to be between 0.6 and 1.4 Pa.
Using this threshold stress and reading the graph in Fig. 6, we can estimate that unfolding behavior would be observed for below 140 m s and 25 m s, for mPa s and 31.5 mPa s, respectively. This was consistent with our experimental observations for these two viscosity values. Indeed, minimum velocities that we could reach experimentally were m s for mPa s, and m s for mPa s, values above the extrapolated frontier values found previously. Therefore, we only observed stretching for these buffer viscosities.
RBC elastic moduli have been previously reported in the literature2,30–32 to be N , N m, and N m. These values allow the calculation of the associated Capillary numbers to be of the order of , , and , respectively. Therefore, we can conclude that the shear modulus drives the transition between the recovery behaviors of RBCs. It would be interesting to try to determine if the study of RBC shape recovery at the exit of a microfluidic constriction could be a novel way to evaluate RBC elastic shear modulus, although experiments performed with mechanically altered RBCs are required in order to demonstrate it. Mechanically altered RBCs would have to be flown at several speed in our geometry, while being suspended in buffers with various viscosities in order to determine the associated threshold stress . But more importantly, a quantitative measurement of the Young modulus of the impaired RBCs would be necessary to validate our hypothesis.
D. Shape recovery time
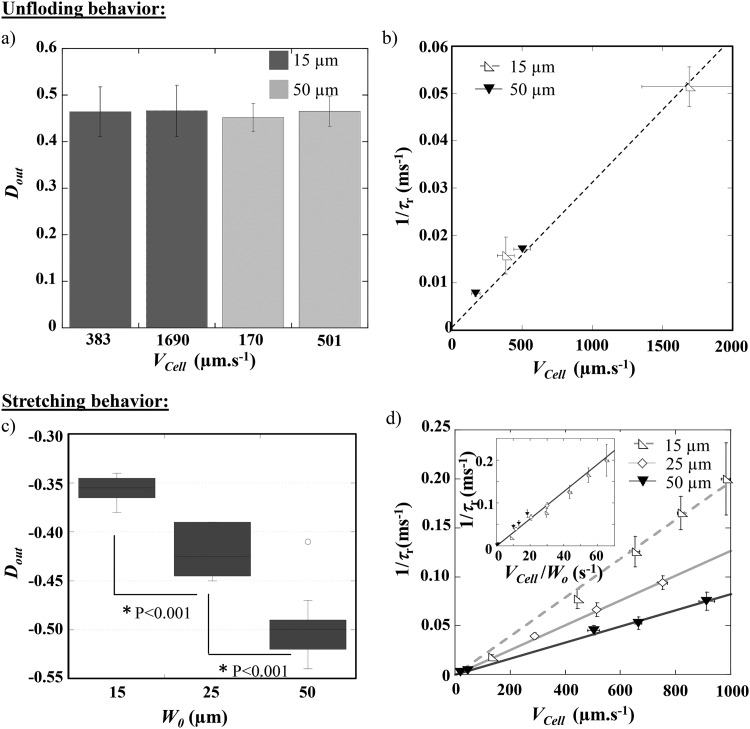
We quantified the deformation of RBCs according to the experimental conditions, i.e., at various , , and for three different main channel widths (, 25, and 50 m, all the other parameters—dimensions and number of constrictions—being maintained constant). The RBC deformation at the exit and the associated recovery time were measured. In the case of cells returning to a steady shape according to the unfolding mode [Fig. 7(a)], the maximum deformation experienced by cells flowing through the last geometric constriction, is independent of both parameters and .
FIG. 7.
Evolution of (a) the cell deformation at the exit of the last constriction and (b) 1/ with the cell speed , for healthy RBCs experiencing the unfolding behavior in channels of different main widths . The external viscosity was set at 1.3 mPa s. (c) Evolution of vs the main channel width , for the stretching behavior ( mPa s). (d) 1/ as a function of , for healthy RBCs undergoing stretching at the exit of channels with different widths ( mPa s). For both recovery modes, each point represents a statistic of at least 20 RBCs. P represents the P-value of the t-test.
Indeed, in the unfolding behavior, corresponds to the cell compression in the last narrowing, which remains constant through the whole study and, therefore, only depends on the constriction dimensions. Figure 7(b) presents the evolution of as a function of , being fixed at 1.3 mPa s, for two values of . The results show that is increasing linearly—thus, is decreasing—when increases. Such behavior has already been reported by Prado et al.33 for the relaxation time measured as the time necessary for RBC, initially at rest in a capillary, to adopt a steady shape when the flow is suddenly started. We can also mention that data issued from different OWC geometries (different ) aligned on the same linear regression [Fig. 7(b)], hence demonstrating that the recovery time in the unfolding mode was not impacted by the width of the channel but is rather governed by the cell mechanical properties.
In the case of the stretching mode, the maximum deformation at the exit is not influenced by the cell speed in the tested range (data not shown). We explain this result by the fact that although the applied stress is increased with the flow speed, RBCs transit through the high stress region more rapidly when increases. Consequently, the increase of St is counterbalanced by the short time RBCs spent in this region. Figure 7(c) presents the effect of on . For each external viscosity and , the data from different cell speed conditions were pooled. The graph reveals that, for a fixed external viscosity ( mPa s), cells are more stretched at the exit of a 50 m wide channel than when = 25 or 15 m. This behavior is attributed here to the fact that as is higher than , RBCs will deform according to the applied stress, which is larger in a 50 m than in a 15 m wide channel. In the stretching behavior, a linear relationship was retrieved between 1/ and [Fig. 7(d)]. The graph also reveals that for a given cell velocity, 1/ increases—i.e., decreases—when is decreased, which is consistent with the fact that cells take longer time to recover from a more deformed state. Moreover, by plotting 1/ vs /, we can collapse all the data on a single line as illustrated by the inset in Fig. 7(d). This indicates that, in the stretching mode, the recovery time is directly imposed by the flow. Previous studies in the literature have observed the decrease of RBC recovery time upon the increase of cell velocity and explained it through energy dissipation.34
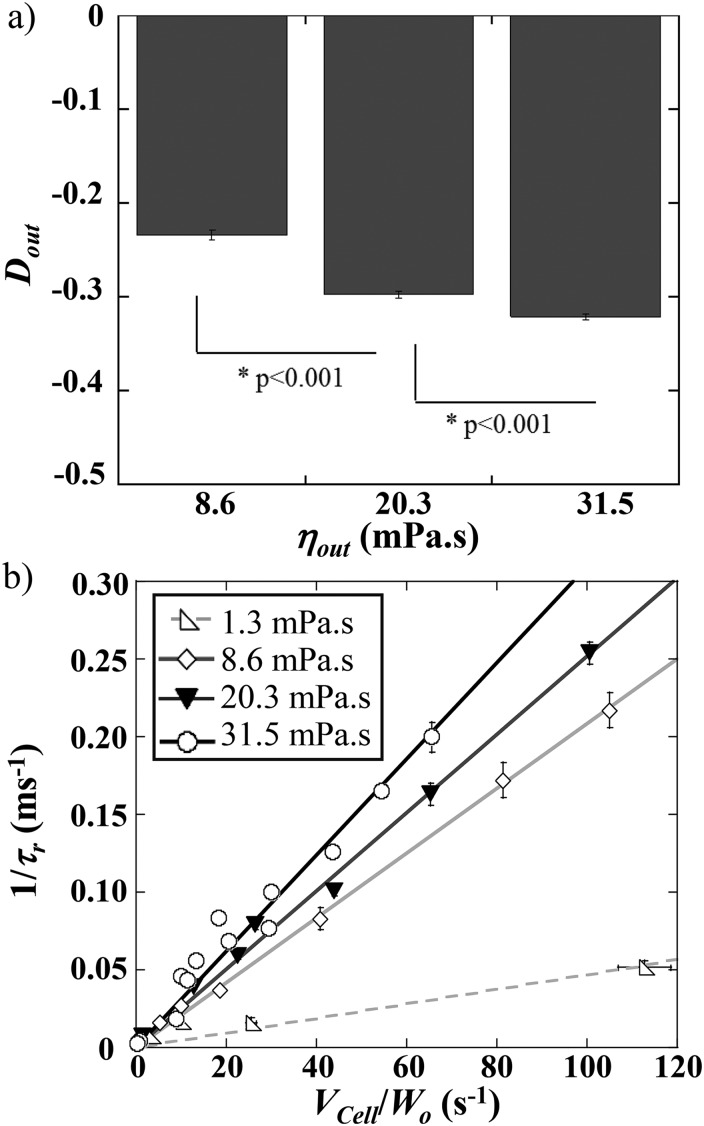
We report the effect of on RBC elongation and shape recovery at the exit. Figure 8(a) reveals that increased as is raised, which is consistent with the increase of the hydrodynamic stress.
FIG. 8.
(a) Evolution of vs the external medium viscosity, , for m. The data have been obtained by pooling the various conditions for each in the stretching mode. (b) 1/ as a function of /, for various conditions of . Each point represents a statistic of at least 20 RBCs. P represents the P-value of the t-test.
One would expect to observe a longer recovery time at higher external viscosity, as more elongated cells take longer time to recover a steady shape. However, Fig. 8(b) points out that increases and, therefore, decreases, with the viscosity of the suspending medium. We explain this behavior in terms of a coupling between the cell and the external medium, which may impact energy dissipation. Such dependency upon was previously observed while measuring the relaxation time using the startup flow of RBCs33 and ecktacytometry.34 Although such techniques report the measurement of the relaxation time, i.e., time necessary for the cells to relax to their equilibrium stress-free shape, we retrieved here the same features on the study of the time necessary to recover a steady shape while still under flow. We may notice that our measurements of in unfolding mode are starting around 129 ms, typically for mPa s and m s, which is in good agreement with relaxation time values previously reported in the literature31,32 and predicted by the Kelvin–Voigt model. But they can also reach values as low as 4 ms, in the stretching mode for mPa s and m s. These results illustrate that, during the flow of RBCs out of a constriction, varies with the flow conditions (i.e., and ). However, it can be assimilated to the cell intrinsic relaxation time dependent on the membrane mechanical properties only at very low flow speed and buffer viscosity.
E. Shape recovery time of pathological cells
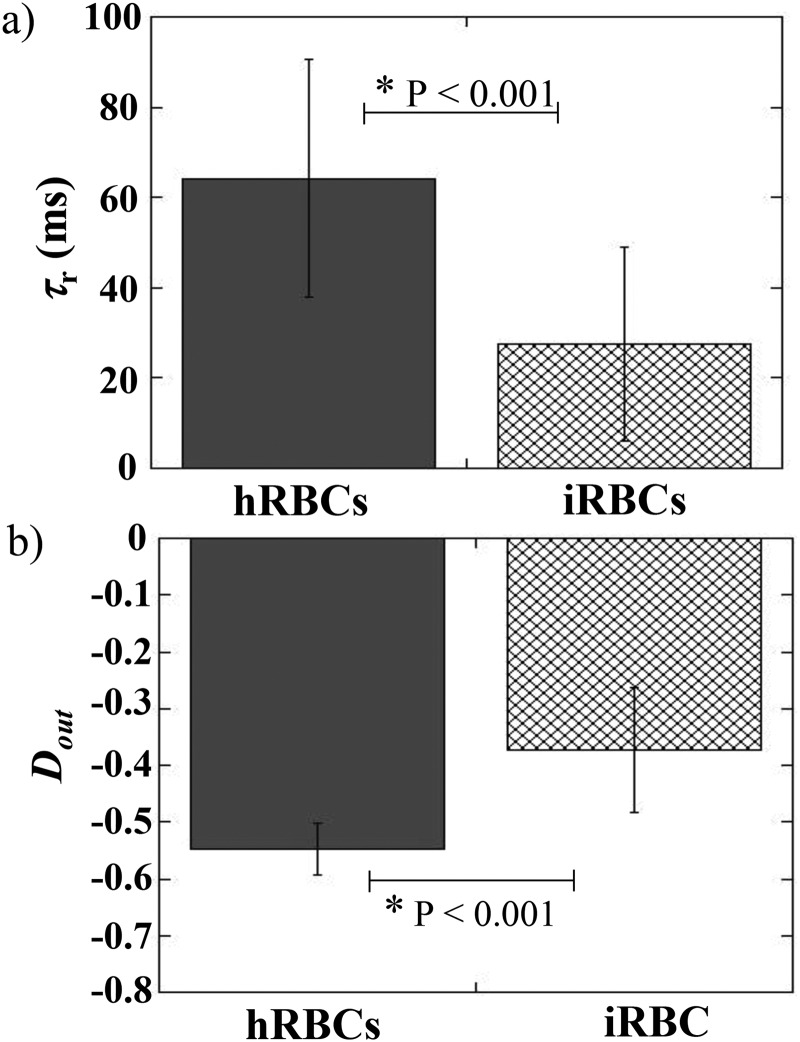
Finally, we evaluated if the shape recovery time could be used to discriminate healthy from pathological RBCs. To do so, the behavior of Plasmodium falciparum infected RBCs (iRBCs) was studied and compared to that of healthy RBCs (hRBCs). iRBCs were obtained by culture of Plasmodium falciparum parasites. Parasitemia was improved by gradient centrifugation technique21 in order to reach values of the order of 80%. iRBCs and hRBCs were flown into a 10 m deep tooth-like microchannel—in order to avoid total blockage of the channel by pathological cells—with m. Hydrodynamic conditions were chosen in order to observe the stretching behavior, i.e., mPa s and was fixed at 200 mbar, leading to m s. The shape recovery time, , of iRBCs was estimated and compared to that of hRBCs, as presented Fig. 9(a).
FIG. 9.
(a) Shape recovery time and (b) cell elongation at the exit , for healthy RBCs (hRBCs) and Plasmodium falciparum RBCs (iRBCs). P represents the P-value of the t-test calculated over roughly 50 cells for each conditions. Both populations were suspended at mPa s and flown at mbar in the device, leading to m s.
The graph highlights the strong decrease in recovery time between the two samples. Indeed, iRBCs recover a stationary shape roughly twice as fast as healthy cells. This difference can be explained by the measurement of [Fig. 9(b)], which reveals that iRBCs elongate roughly 1.6 times less than hRBCs. These findings underly that it takes less time for pathological cells to recover from a less elongated state. The measurements of shape recovery time can, therefore, be used to discriminate healthy from Plasmodium falciparum infected samples. Hence, demonstrating that the recovery time traduces the cell intrinsic mechanical properties, if cells undergo the same hydrodynamic stress, i.e., they are submitted to the same external viscosity and flown at the same speed, in the same geometry.
IV. CONCLUSION
Our results have shown that RBCs flowing out of a microfluidic constriction undergo two different shape recovery behaviors, depending on the experimental conditions. At high external viscosity and flow speed, we highlighted a stretching mode where the impact of the flow on the shape recovery is dominant, whereas at low viscosity and velocity of the carrier fluid, we found an unfolding mode where the mechanical phenotype of RBCs dominates the shape recovery. The calculation of the corresponding Capillary numbers shows that the RBC shear resistance governs the transition between the two recovery dynamics. It would be interesting to evaluate if the calculation of the viscous stress corresponding to the frontier between these two recovery modes (at ) could be used to estimate an elastic shear modulus of healthy RBCs. We also showed that the associated recovery times, , vary strongly according to the viscosity and velocity of the carrier fluid. Indeed, we report values comparable with relaxation times published in the literature—and in good agreement with the Hochmuth Evans calculation based on the Kelvin–Voigt model ( ms)—for very low flow speed and buffer viscosity, as well as values as low as 4 ms at specific experimental conditions. The RBCs shape the recovery under flow, being dictated by the coupling between the cell and the external medium, and it is expected that varies with the flow parameters. Indeed, we found that decreases with the raise of the external viscosity and the relative velocity between the surrounding fluid and the RBC. We explain this reduction of the recovery time in terms of the strong coupling between the cell and the external fluid, which impacts the energy dissipation. Finally, the comparison of the behaviors of Plasmodium falciparum infected and healthy RBCs flowing out of constricted channels illustrates that diseased cells are less stretched and thus recover a steady shape twice as fast as normal ones. Such results demonstrate that provides a signature of the cell intrinsic mechanical properties and that its measurement has the potential to detect the pathological state of RBCs.
SUPPLEMENTARY MATERIAL
See the supplementary material for a detailed description of the preparation of the Plasmodium falciparum infected red blood cells. More information on the determination of cell velocity is illustrated in the supplementary material. The effect of stress history on the mechanical response of healthy RBCs is also detailed. The quantification of the centering effect of our geometry is also provided and briefly discussed. Finally, a description of the numerical simulations performed to calculate the viscous stress necessary to extract the shear modulus is included.
ACKNOWLEDGMENTS
A.A. is thankful to Ecole Doctorale E.E.A. for a Ph.D. fellowship. J.E. is thankful to UCBL and INSA for postdoctoral fellowships. This work was supported by the iMUST grant. All the experiments were performed on the Nanolyon technological facilities. M.F. acknowledges the CNRS and the Mission pour les Initiatives Transverses et Interdisciplinaires for supporting the installation of an experimental setup at Institut of Parasitology and medical Mycology. The authors thank Pr. Thierry Biben for fruitfull discussions.
DATA AVAILABILITY
The data that support the findings of this study are available from the corresponding author upon reasonable request.
REFERENCES
- 1.Mohandas N. and Evans E., “Mechanical properties of the red cell membrane in relation to molecular structure and genetic defects,” Annu. Rev. Biophys. Biomol. Struct. 23, 787–818 (1994). 10.1146/annurev.bb.23.060194.004035 [DOI] [PubMed] [Google Scholar]
- 2.Evans E. A. and Hochmuth R. M., “Membrane viscoelasticity,” Biophys. J. 16, 1–11 (1976). 10.1016/S0006-3495(76)85658-5 [DOI] [PMC free article] [PubMed] [Google Scholar]
- 3.Hochmuth R. M., Worthy P. R., and Evans E. A., “Red cell extensional recovery and the determination of membrane viscosity,” Biophys. J. 26, 101–114 (1979). 10.1016/S0006-3495(79)85238-8 [DOI] [PMC free article] [PubMed] [Google Scholar]
- 4.Engelhardt H. and Sackmann E., “On the measurement of shear elastic moduli and viscosities of erythrocyte plasma membranes by transient deformation in high frequency electric fields,” Biophys. J. 54, 495–508 (1988). 10.1016/S0006-3495(88)82982-5 [DOI] [PMC free article] [PubMed] [Google Scholar]
- 5.Waugh R. and Hochmuth R. M., “Erythrocyte membrane elasticity and viscosity,” Annu. Rev. Physiol. 49, 209–219 (1987). 10.1146/annurev.ph.49.030187.001233 [DOI] [PubMed] [Google Scholar]
- 6.Chien S., Song K.-L. P., Skalak R., and Usami S., “Theoretical and experimental studies on viscoelastic properties of erythrocyte membrane,” Biophys. J. 24, 463–487 (1978). 10.1016/S0006-3495(78)85395-8 [DOI] [PMC free article] [PubMed] [Google Scholar]
- 7.Waugh R. and Evans E. A., “Thermoelasticity of red blood cell membrane,” Biophys. J. 26, 115–131 (1979). 10.1016/S0006-3495(79)85239-X [DOI] [PMC free article] [PubMed] [Google Scholar]
- 8.Nash G. B. and Meiselman H. J., “Red cell and ghost viscoelasticity. effects of haemoglobin concentration and in vivo aging,” Biophys. J. 43, 63–73 (1983). 10.1016/S0006-3495(83)84324-0 [DOI] [PMC free article] [PubMed] [Google Scholar]
- 9.Tomaiuolo G. and Guido S., “Start-up shape dynamics of red blood cells in microcapillary flow,” Microvasc. Res. 82, 35–41 (2011). 10.1016/j.mvr.2011.03.004 [DOI] [PubMed] [Google Scholar]
- 10.Hochmuth R. M., Mohandas N., and Blackshear Jr. P. L., “Measurement of the elastic modulus for red cell membrane using a fluid mechanical technique,” Biophys. J. 13, 747–761 (1973). 10.1016/S0006-3495(73)86021-7 [DOI] [PMC free article] [PubMed] [Google Scholar]
- 11.Evans E. A., “Structure and deformation properties of red blood cells: Concepts and quantitative methods,” Meth. Enzymol. 173, 3–35 (1989). 10.1016/S0076-6879(89)73003-2 [DOI] [PubMed] [Google Scholar]
- 12.Linderkamp O. and Meiselman H. J., “Geometric, osmotic, and membrane mechanical properties of density-separated human red cells,” Blood 59, 1121–1127 (1982). 10.1182/blood.V59.6.1121.1121 [DOI] [PubMed] [Google Scholar]
- 13.Svoboda K., Schmidt C. F., Branton D., and Block S. M., “Conformation and elasticity of the isolated red blood cell membrane skeleton,” Biophys. J. 63, 784–793 (1992). 10.1016/S0006-3495(92)81644-2 [DOI] [PMC free article] [PubMed] [Google Scholar]
- 14.Engelhardt H., Gaud H., and Sackmann E., “Viscoelastic properties of erythrocyte membranes in high-frequency electric fields,” Nature 307, 378–380 (1984). 10.1038/307378a0 [DOI] [PubMed] [Google Scholar]
- 15.Sutera S. P., Gardner R. A., Boylan C. W., Carroll G. L., Chang K. C., Marvel J. S., Kilo C., Gonen B., and Williamson J. R., “Age related changes in deformability of human erythrocytes,” Blood 65, 275–282 (1985). 10.1182/blood.V65.2.275.275 [DOI] [PubMed] [Google Scholar]
- 16.Williamson J. R., Gardner R. A., Boylan C. W., Caroll G. L., Chang K., Marvel J. S., Gonen B., Kilo C., Tran-Son-Tay R., and Sutera S. P., “Microrheologic investigation of erythrocyte deformability in diabetes mellitus,” Blood 65, 283–288 (1985). 10.1182/blood.V65.2.283.283 [DOI] [PubMed] [Google Scholar]
- 17.Mohandas N., Clark M. R., Jacobs M. S., and Shohet S. B., “Analysis of factors regulating erythrocyte deformability,” J. Clin. Invest. 66, 563–573 (1980). 10.1172/JCI109888 [DOI] [PMC free article] [PubMed] [Google Scholar]
- 18.Braunmüller S., Schmid L., Sackmann E., and Franke T., “Hydrodynamic deformation reveals two coupled modes/times scales of red blood cell relaxation,” Soft Matter 8, 11240–11248 (2012). 10.1039/c2sm26513c [DOI] [Google Scholar]
- 19.Duffy D. C., McDonald J. C., Schueller O. J. A., and Whitesides G. M., “Rapid prototyping of microfluidic systems in poly(dimethylsiloxane),” Anal. Chem. 70, 4974–4984 (2004). 10.1021/ac980656z [DOI] [PubMed] [Google Scholar]
- 20.Trager W. and Jensen J. B., “Human malaria parasites in continuous culture,” Science 193, 673–675 (1976). 10.1126/science.781840 [DOI] [PubMed] [Google Scholar]
- 21.Kutner S., Breuer W. V., Ginsburg H., Aley S. B., and Cabantchik Z. I., “Characterization of permeation pathways in the plasma membrane of human erythrocytes infected with early stages of plasmodium falciparum: Association with parasite development,” J. Cell. Physiol. 125, 521–527 (1985). 10.1002/jcp.1041250323 [DOI] [PubMed] [Google Scholar]
- 22.Blankenstein G. and Larsen U., “Modular concept of a laboratory on a chip for chemical and biochemical analysis,” Biosens. Bioelectron. 13, 427–438 (1998). 10.1016/S0956-5663(97)00109-7 [DOI] [Google Scholar]
- 23.Rico L., Juncá J., Ward M., Bradford J., Bardina J., and Petriz J., “Acoustophoretic orientation of red blood cells for diagnosis of red cell health and pathology,” Sci. Rep. 8, 15705 (2018). 10.1038/s41598-018-33411-0 [DOI] [PMC free article] [PubMed] [Google Scholar]
- 24.Schrum D., Culbertson C., Jacobson S., and Ramsey J., “Microchip flow cytometry using electrokinetic focusing,” Anal. Chem. 71, 4173–4177 (1999). 10.1021/ac990372u [DOI] [PubMed] [Google Scholar]
- 25.Kim Y. and Yoo J., “Three-dimensional focusing of red blood cells in microchannel flows for bio-sensing applications,” Biosens. Bioelectron. 24, 3677–3682 (2009). 10.1016/j.bios.2009.05.037 [DOI] [PubMed] [Google Scholar]
- 26.Faivre M., Abkarian M., Bickraj K., and Stone H. A., “Geometrical focusing of cells in a microfluidic device: An approach to separate blood plasma,” Biorheology 43, 147–159 (2006). [PubMed] [Google Scholar]
- 27.Abay A., Recktenwald S., John T., Kaestner L., and Wagne C., “Cross-sectional focusing of red blood cells in a constricted microfluidic channel,” Soft Matter 16, 534–543 (2020). 10.1039/C9SM01740B [DOI] [PubMed] [Google Scholar]
- 28.Tsai C., Sakuma S., Arai F., Taniguchi T., Ohtani T., Sakata Y., and Kaneko M., “Geometrical alignment for improving cell evaluation in a microchannel with application on multiple myeloma red blood cells,” RSC Adv. 4, 45050–45058 (2014). 10.1039/C4RA08276A [DOI] [Google Scholar]
- 29.Tomaiuolo G., Barra M., Preziosi V., Cassinese A., Rotoli B., and Guido S., “Microfluidics analysis of red blood cell membrane viscosity,” Lab Chip 11, 449–454 (2011). 10.1039/C0LC00348D [DOI] [PubMed] [Google Scholar]
- 30.Evans E. A., “Bending elastic modulus of red blood cell membrane derived from buckling instability in micropipette aspiration tests,” Biophys. J. 43, 27–30 (1983). 10.1016/S0006-3495(83)84319-7 [DOI] [PMC free article] [PubMed] [Google Scholar]
- 31.Evans E. A., “New membrane concept applied to the analysis of fluid shear- and micropipette-deformed red blood cells,” Biophys. J. 13(9), 941–954 (1973). 10.1016/S0006-3495(73)86036-9 [DOI] [PMC free article] [PubMed] [Google Scholar]
- 32.Hénon S., Lenormand G., Richert A., and Gallet F., “A new determination of the shear modulus of the human erythrocyte membrane using optical tweezers,” Biophys. J. 76, 1145–1151 (1999). 10.1016/S0006-3495(99)77279-6 [DOI] [PMC free article] [PubMed] [Google Scholar]
- 33.Prado G., Farutin A., Misbah C., and Bureau L., “Viscoelastic transient of confined red blood cells,” Biophys. J. 108, 2126–2136 (2015). 10.1016/j.bpj.2015.03.046 [DOI] [PMC free article] [PubMed] [Google Scholar]
- 34.Baskurt O. K. and Meiselman H. J., “Determination of red blood cell shape recovery time constant in a couette system by the analysis of light reflectance and ektacytometry,” Biorheology 33, 489–503 (1996). 10.3233/BIR-1996-33607 [DOI] [PubMed] [Google Scholar]
Associated Data
This section collects any data citations, data availability statements, or supplementary materials included in this article.
Supplementary Materials
See the supplementary material for a detailed description of the preparation of the Plasmodium falciparum infected red blood cells. More information on the determination of cell velocity is illustrated in the supplementary material. The effect of stress history on the mechanical response of healthy RBCs is also detailed. The quantification of the centering effect of our geometry is also provided and briefly discussed. Finally, a description of the numerical simulations performed to calculate the viscous stress necessary to extract the shear modulus is included.
Data Availability Statement
The data that support the findings of this study are available from the corresponding author upon reasonable request.


