Abstract
Seizures often herald the clinical appearance of gliomas or appear at later stages. Dissecting their precise evolution and cellular pathogenesis in brain malignancies could inform the development of staged therapies for these highly pharmaco-resistant epilepsies. Studies in immunodeficient xenograft models have identified local interneuron loss and excess glial glutamate release as chief contributors to network disinhibition, but how hyperexcitability in the peritumoral microenvironment evolves in an immunocompetent brain is unclear. We generated gliomas in WT mice via in utero deletion of key tumor suppressor genes and serially monitored cortical epileptogenesis during tumor infiltration with in vivo electrophysiology and GCAMP7 calcium imaging, revealing a reproducible progression from hyperexcitability to convulsive seizures. Long before seizures, coincident with loss of inhibitory cells and their protective scaffolding, gain of glial glutamate antiporter xCT expression, and reactive astrocytosis, we detected local Iba1+ microglial inflammation that intensified and later extended far beyond tumor boundaries. Hitherto unrecognized episodes of cortical spreading depolarization that arose frequently from the peritumoral region may provide a mechanism for transient neurological deficits. Early blockade of glial xCT activity inhibited later seizures, and genomic reduction of host brain excitability by deleting MapT suppressed molecular markers of epileptogenesis and seizures. Our studies confirmed xenograft tumor–driven pathobiology and revealed early and late components of tumor-related epileptogenesis in a genetically tractable, immunocompetent mouse model of glioma, allowing the complex dissection of tumor versus host pathogenic seizure mechanisms.
Keywords: Oncology, Therapeutics
Keywords: Brain cancer, Epilepsy, Neurological disorders
Introduction
The invasion of the neocortex by malignant brain tumor cells is accompanied by seizures and cognitive impairments that are highly refractory to treatment even after surgical resection, indicating persistent hyperexcitability in neuronal networks, yet the timing and precise cellular mechanisms driving abnormal cortical synchronization and tumor-related epileptogenesis are unclear. At least 40% to 45% of adult patients with glioblastoma multiforme (GBM), the most severe form of diffuse glioma (1), experience seizures as the presenting clinical sign, and another 10% to 30% develop cortical seizures at some point during their disease (2, 3). This latency demonstrates that surrounding cortical network instability is not simply related to either the physical presence of malignant cells or distortion due to the expanding structural mass effect, but grows according to a sequence of cellular death and molecular remodeling in the peritumoral microenvironment that is still poorly characterized.
Multiple inherent obstacles complicate the analysis of this complex excitability landscape. The irregular anatomical margins of aggressively invasive high-grade tumor cell clusters and remote tumor microislets reflect the heterogeneous stages of cellular and molecular crosstalk between the proliferating malignant cells and surrounding brain networks (4). High-grade gliomas differ in the pediatric and adult brain (5) and contain multiple cellular lineages at various stages of differentiation (6, 7), including malignant glial subsets enriched in synaptogenic markers, suggesting that some tumor cells may promote neosynaptogenesis as a substrate for excitation-inhibition imbalance (8). Recent findings show that some, but not all, oncogenic variant profiles in mouse models of GBM favor seizures, demonstrating that epileptogenesis in the host brain can be determined by tumor genetics (9). Of equal importance, tumor proliferation may reflect activity-dependent secreted and synaptic signaling in the peritumoral microenvironment (10–12), promoting a potentially vicious symbiosis between tumor growth and excitability. Finally, if this reciprocal relationship applies to most gliomas, tumor epileptogenicity may be linked to the underlying excitability genetics of the host brain, although this relationship has not been experimentally explored. Urgent translational research priorities include the following: (a) tracing the natural progression of epileptogenesis in genetically defined glioma subtypes to pinpoint the time and location of seizure onset; (b) isolating mechanisms underlying pharmaco-resistant tumor seizures in order to select better drug targets; and (c) determining whether early proactive suppression of neural circuit hyperexcitability by interfering with these mechanisms retards seizure onset and progression.
Until recently, experimental in vivo mouse models of transplanted human GBM tumors have been used to isolate molecular and cellular mechanisms underlying invasive brain tumor–related epilepsy. In these xenograft models, a solitary primary cortical tumor is generated by injecting a soluble graft of patient-derived tumor cell lines into an immunocompromised host (SCID) adult mouse brain. This approach has identified excess glutamate secretion through the glial xCT antiporter (13), along with synaptic disinhibition due to cell death, loss of KCC2 chloride gradients, and degradation of perineuronal nets (PNNs) that protect vulnerable fast-spiking interneurons (14, 15) as important mechanisms contributing to epileptogenesis. However, tumor-specific immunity plays a critical role in the GBM microenvironment and even alters therapeutic response biology (16). In SCID mice, although the tumor cell lines studied are patient-derived, cultured xenografts may lack specific malignant cellular subsets and interactions that arise in a developing host brain, and their proliferation in an immunocompromised adult cortex may or may not fully recapitulate the complex evolution of tumor cell–host neuron interactions in the peritumoral microenvironment.
Here we use CRISPR-based in utero electroporation (IUE) of deletions in defined human glioma genes to characterize a mouse model of GBM in immunocompetent mice that display rapid astrocytic progenitor–derived brain tumor growth with intracortical invasion, culminating in generalized tonic-clonic seizures and early lethality by 3 months of age (8). Using serial in vivo monitoring with video EEG, cortical neurophysiology, and calcium-activated fluorescent imaging, we visualized the tumor-invaded and tumor-free cortex throughout the lifespan in this model. We observed a gradual and orderly progression of early cortical hyperexcitability followed by the emergence of frequent electrographic and behavioral seizures at later disease stages, validating it as a robust chronic model of glioblastoma-related epileptogenesis. We correlated these stages with progressive changes of biomarkers in the tumor microenvironment, including neuronal cell death, interneuron loss, PNN degradation, reactive astrocytosis, and elevated glial xCT expression with increasing cortical hyperexcitability. The similarity of these changes with those identified in xenograft models demonstrated that they were driven by malignant glioma invasion rather than suppressed innate immunity. We also confirmed the ability of sulfasalazine (SAS), an xCT-mediated glutamate release blocker, to preemptively control late-stage epileptogenesis. In addition, to our knowledge, we have newly identified 2 potentially interrelated early abnormalities before the onset of seizures, namely, a striking pattern of widespread and persistent microglial infiltration previously unreported in immunocompromised models, and spontaneous episodes of cortical spreading depolarization (SD). SD is accompanied by extreme elevation of extracellular glutamate and tissue hypoxia linked to excitotoxicity (17) and microglial recruitment (18, 19), and is therefore a potential biomarker of mechanisms contributing to tumor-related epileptogenesis. Finally, we showed that genetic reduction of host-intrinsic cortical network excitability by deletion of MapT (tau), a robust epistatic seizure modifier in inherited models of epilepsy (20, 21) and neurodegeneration (22), is also antiepileptogenic in this model, thereby identifying a shared role of the host genome in tumor-related epileptogenicity, as well as a potential therapeutic target and excitability biomarker in the host brain, which could be of future utility for stratifying allelic profiles in precision clinical trials of tumor-related epilepsy management.
Results
CRISPR-based glioblastoma model exhibits progressive cortical hyperexcitability, spontaneous seizures, and SD.
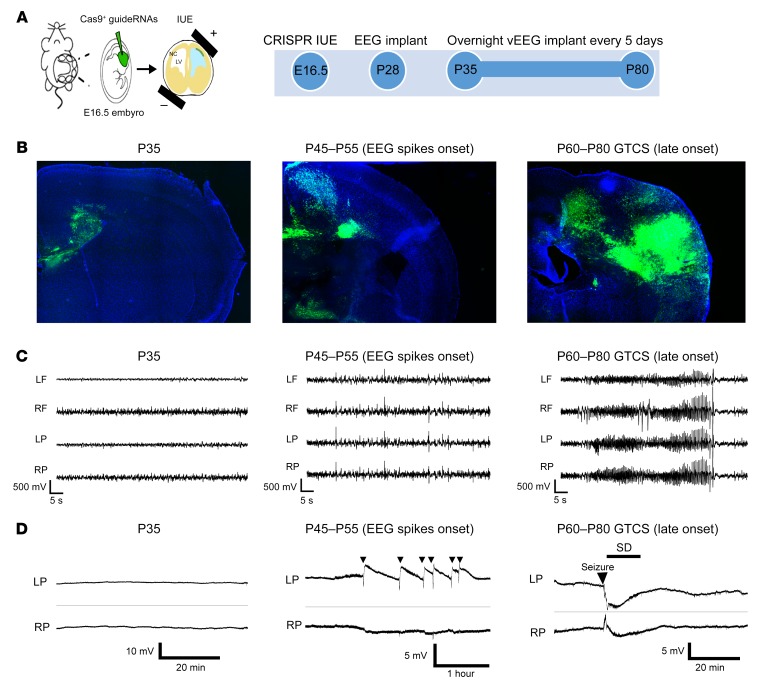
We studied epileptogenesis in a non-xenograft model of human glioma in the immunocompetent mouse brain previously described by our group (8). In brief, this model relies on IUE of gRNA-expressing vectors that target neural stem cells into the cerebral ventricles of mouse fetuses on E16.5. Using these vectors, we deleted 3 genes encoding phosphatase and tensin homolog (Pten), neurofibromin 1 (Nf1), and p53 (Trp53) linked to tumorigenesis in human GBM (23–25), and expressed reporter constructs encoding GFP or red fluorescent protein (RFP, for in vivo imaging) and the endonuclease Cas9. As we previously reported (8), these animals develop reproducible GFP- or RFP-positive malignant glial tumors, display spontaneous behavioral seizures, and show an average survival time of 3 months on C57BL6/J and CD-1 inbred backgrounds. We surgically implanted tumor-bearing mice at P28 with 4-lead intracranial electrodes and conducted video-EEG recordings on freely behaving animals for 17 to 24 hours every 5 days from P35 to P80 (Figure 1, A–C). In other animals, cortical surface electrodes were implanted for direct current (DC) recordings to detect possible slow SD events (Figure 1D). This prolonged monitoring period provided a reliable timeline to assess the emergence of spontaneous electrographic cortical hyperexcitability and epileptiform activity that precede the clinical appearance of spontaneous, generalized tonic-clonic seizures. In chronic video-EEG recordings (n = 28 mice), cortical EEG activity patterns were unaffected until 1.5 months of age, and then readily divisible into 2 stages marked by the episodic appearance of aberrant cortical spike discharges between P45 and P55, followed by generalized electrographic and behavioral motor seizures arising between P60 and P80 that correlated with the progressive expansion of malignant glioma cells within the neocortex (Figure 1, B and C). Intermittent spike discharges and occasional generalized seizure activity appeared as early as P45, ranging from 0.2 to 29.2 spikes/hour. By P80, surviving mice showed steadily abnormal electrographic aberrant spike discharges ranging from 3.7 to 63.6 spikes/hour and intensifying behavioral seizures (0–0.58 seizures/hour) until death. In vivo DC recordings of slow potentials directly from the cortical surface in 7 additional mice at both early and late stages revealed spontaneous and sometimes recurrent episodes of SD that occurred unilaterally, often following a brief EEG hyperactive discharge; more prolonged EEG seizures sometimes preceded SD at the later stage (Figure 1D). SD waves are pathological events associated with transient neurological deficits during migraine aura and acute human brain injuries (26, 27) that are absent in the WT mouse brain. SD arises experimentally from profound local metabolic stress (hypoxia, hypoglycemia, excess glutamate, and mitochondrial ATP depletion), which collapse membrane polarization levels and alter functional ionic gradients in neurons and astrocytes (28). Recurrent SD episodes are linked to prolonged ischemic tissue injury and have been shown to drive microglial infiltration in the neocortex and trigger seizures in disinhibited networks (18, 29–31).
Figure 1. IUE tumor mice exhibited progressive cortical hyperexcitability and generalized tonic-clonic seizures during GBM invasion of the neocortex.
(A) Embryos were electroporated with 3 defined tumor gene variants at E16.5. Timeline shows steps in EEG monitoring protocol. GFP+ fluorescence in whole brain reveals typical end-stage brain tumor. LV, left ventricle; NC, neocortex. (B) Representative sections show GFP+ tumor growth at P35 (before onset of EEG abnormalities), P45 to P55 (onset of cortical spiking activity), and P60 to P80 (behavioral seizures, late-stage tumor). (C) Representative bilateral frontal and parietal EEG traces during tumor growth. EEG shows normal activity until P35, vigorous interictal spike activity during the early stage of tumor emergence (P45–P55), and convulsive seizures (generalized tonic-clonic) during the late stage (P60–P80). Rarely, generalized seizures occurred before P55, and spikes may emerge before P45, possibly due to asymmetric tumor invasion. GTCS, generalized tonic-clonic seizures; LF, left frontal lobe; RF, right frontal lobe; LP, left parietal lobe; RF, right parietal lobe. (D) Prolonged DC monitoring of cortical surface slow potentials revealed normal signal at P35 (left); spontaneous episodes of unilateral SD emerged at the onset of hyperexcitability and can be recurrent events (denoted by arrows; center), or occur postictally in mice experiencing generalized seizure activity (arrow, right) at late disease stage.
In vivo calcium GCAMP imaging of seizures and SD in the tumor cortex.
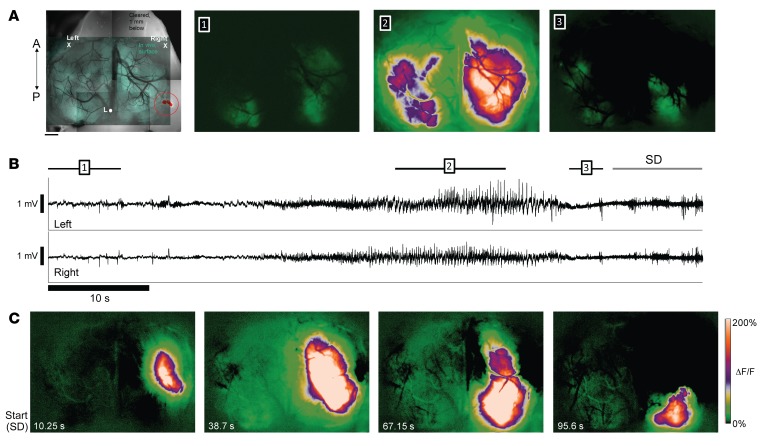
Although tumors were commonly lateralized to 1 hemisphere at the early stage, possibly due to asymmetry of the electroporation technique and divergent proliferation rates of malignant glial subsets, both the interictal spike discharge and seizure activity detected by EEG were typically bilateral (Figure 1C), likely reflecting long-range transcallosal synchronization. In order to more precisely resolve the spatiotemporal evolution of seizures and slow depolarization events relative to the tumor and peritumoral cortical regions, we employed chronic, in vivo widefield intracellular calcium imaging in unanesthetized mice to monitor the progression of cortical excitability over both hemispheres. A second set of mice aged greater than P50 (n = 13) were chronically implanted with a combination of bilateral EEG electrodes and a bilateral cranial window. Using simultaneous in vivo calcium imaging and EEG recording in awake mice (32) after specific viral transfection of cortical neurons with AAV synapsin-1–driven GCAMP7, we visualized recurrent seizure activity in 2 mice during prolonged monitoring sessions at late stages (Figure 2 and Supplemental Video 1; supplemental material available online with this article; https://doi.org/10.1172/JCI133316DS1). Although 1-photon calcium imaging sampled at a 100-Hz frame rate cannot distinctly capture the fast voltage transients of isolated EEG spike discharge activity, we clearly observed strong bilateral calcium activity flashes concurrent with 7 cortical EEG seizures in 3 mice (Supplemental Video 1). When imaged, spontaneous seizure activation appeared ipsilateral to the tumor and then rapidly generalized to the contralateral tumor-free cortex (Figure 2, A and B, and Supplemental Video 1). The amplitude of the ΔF/F fluorescence signal during the seizures was approximately 6 to 8 times greater than during baseline cortical activity, and no signals in this range were ever observed interictally. Although most seizures terminated with a return to baseline EEG activity, 1 seizure triggered SD, as evidenced by a wave of intense intracellular calcium signal with a clearly focal onset arising in cortical tissue adjacent to the tumor mass, slowly spreading to engulf the majority of the affected hemisphere (Figure 2C and Supplemental Video 1, same mouse with circled brain tumor shown in Figure 2A). The dynamics of peritumoral SD spread (2.6 mm/min speed, uniform progression, and profound depression of EEG amplitude) were consistent with those described in SD waves that spread pathologically in the cortex of mice and humans (26), and the uneven recovery of normal calcium activation levels after SD revealed local inhomogeneities in the excitability of the peritumoral cortex. SD waves reflect extreme levels of neuronal depolarization that propagate through gray but not white matter pathways, confining them to the ipsilateral tumor hemisphere (Figure 1D and Supplemental Video 1). Prolonged DC recordings from mice with implanted electrodes captured 33 SD events in 3 of 7 mice (43%). Spontaneous SDs were frequent; the mean SD interval was 5.0 ± 6.1 hours, ranging from 0 to 9 SDs/hour. These pathological SD events never appeared in nontumor control WT mice, and signify excess local cortical levels of glutamate release, elevated extracellular potassium, and transient intracortical tissue hypoxia.
Figure 2. In vivo 1-photon imaging of epileptiform activity and SD in tumor animals.
(A) Left: Green transparent overlay: in vivo, 1-photon, widefield GCaMP7f fluorescence image of the cortical surface of a 3xCr mouse at P70 illuminated using blue light. Average of 1,000 frames (10 seconds). Left X/Right X mark locations of 2 cortical leads used to record EEG below. Reference in cerebellum. Grayscale background image shows horizontal section 1 mm below brain surface, illuminated using green light for visualization of fluorescent protein–labeled tumor cells (highlighted and circled in red). A/P arrow indicates anterior/posterior orientation. L, Lambda. Top panels 1–3: Average ΔF/F fluorescence over 10-second, 12-second, and 2-second periods of GCaMP7f fluorescence (focused at 300 μm below cortical surface), respectively. 1: Baseline calcium signal activity several seconds before generalized seizure onset (indicated by bar 1 in B). 2: Intense bilateral activation during middle portion of seizure (bar 2 in B). 3: Postictal activity before SD (bar 3 in B). (B) EEG traces simultaneously acquired during optical recording of calcium signal (top, left cortex; bottom, right cortex). Black bars above EEG traces indicate time spans corresponding to averaged image frames above (sampled at 100 Hz). (C) (Left to right) Evolution of SD wave originating in peritumoral region and moving across cortical surface. Beginning of SD event is marked by gray arrow above EEG traces in B. First panel on the left shows extent of the spreading wave at time point corresponding to the end of the gray arrow (10.25 seconds after wave first appears). Remaining 3 panels show serial snapshots of wave at 38.7, 67.15, and 95.6 seconds, respectively, as it spreads and recedes. Note that intense wave (white zone) remained confined to right hemisphere. Video of episode in Supplemental Video 1.
Tumor infiltration of the neocortex induces early peritumoral neuronal loss before onset of seizures.
We next characterized early- through late-stage cytological and molecular markers of disinhibition in the cortex in order to construct a timeline of pathogenic changes contributing to epileptogenesis. Studies in xenograft glioma models have implicated peritumoral cell death, glutamate excitotoxicity, and loss of fast-spiking parvalbumin (PV) interneurons and PNNs as among the mechanisms leading to disinhibition of cortical networks and epileptiform activity when analyzed in an established brain tumor 2 weeks after the graft (14, 15, 33). Since the IUE model features a prolonged time course of proliferating tumor cells invading the neocortex, with the progressive appearance of cortical hyperexcitability over a 3- to 6-week period, we examined which cytopathological changes were evident in tumor mice upon emergence of interictal spike activity (P45–P55) and at later disease stages when recurrent generalized seizures become frequent (P60–P80). We used immunohistochemistry to examine cellular densities labeled by the pan-neuronal marker NeuN and the fast-spiking interneuron marker PV on serial coronal brain sections. To ensure sample uniformity, we used Scholl analysis to quantify cells in 3 specified zones: within the cortical tumor (i.e., centered in the main mass of GFP+ cells), in a peritumoral zone within a 500-μm radius of the confluent GFP+ tumor edge, and a distant site well outside the tumor mass (500 μm or more from the border of the peritumoral region in a zone microscopically free of GFP+ cells) (Supplemental Figure 1).
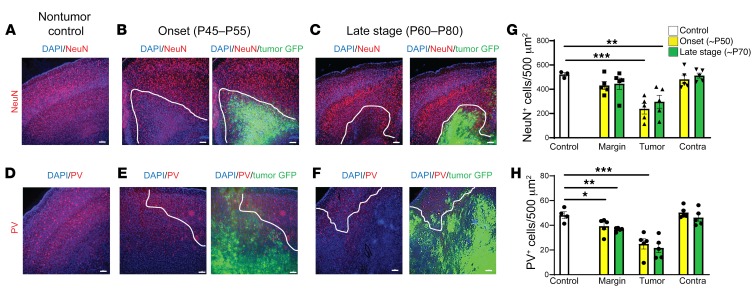
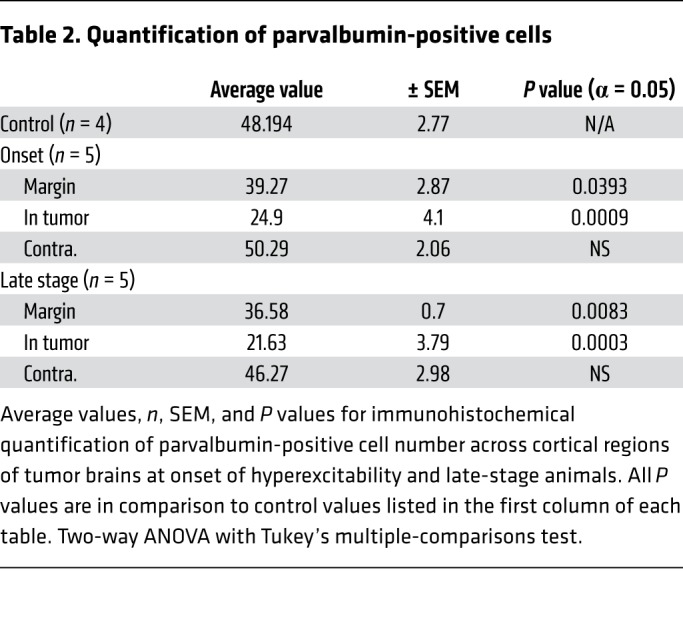
At age P35 in IUE tumor mice, no detectable cellular GFP+ signal was present in the neocortex under high-power microscopy, and there were no differences in the pan-neuronal NeuN+ cell number compared with control unelectroporated mice (Figure 3A). Ten to 20 days later (P45–55), malignant cells had expanded into deeper cortical layers, forming medium-sized colonies of GFP+ tumor cells. Concurrent with the onset of cortical hyperexcitability at this stage, tumor mice exhibited significant NeuN+ loss within GFP+ tumor regions, whereas loss in the peritumoral margin was not significant compared to the control mice (Figure 3, A, B, and G, and Table 1). In late-stage-tumor mice experiencing generalized seizure activity, we found a similar pattern of NeuN+ loss that was statistically significant within the tumor but not peritumoral regions (Figure 3, C and G, and Table 1). Similarly, at onset of hyperexcitability, PV+ interneuron loss was significant within GFP+ tumor regions but not in peritumoral regions compared to controls (Figure 3, E and H, and Table 2). At the late stage, compared with controls, PV+ interneuron loss was equally significant in both GFP+ tumor and peritumoral regions (Figure 3, D, F, and H, and Table 2). Given the stepwise progression of cortical excitability from a pattern of early intermittent spike discharges to the abrupt appearance of spontaneous behavioral seizures, we expected that peritumoral interneuronal loss could be more significant at the late stage, assuming that greater GABAergic disinhibition due to cell loss in the margins would contribute to the observed severe seizure phenotype. Instead, we found no difference in the degree of peritumoral interneuron loss from early to late disease time points or in the fractional density (balance of NeuN+/PV+) of interneuron loss within the peritumoral margin between onset and late-stage animals (Supplemental Figure 1, B and C). These results indicate that local cell death at the peritumoral margin caused by tumor infiltration into cortical networks is already substantial at the onset of EEG-detectable network hyperexcitability, and that a majority of cell loss in the tumoral microenvironment actually precedes the final excitability progression from aberrant EEG discharges into recurrent seizure activity, implying the subsequent recruitment of additional epileptogenic factors.
Figure 3. Tumor mice exhibited cortical cell loss at early stage of hyperexcitability before seizures were detected.
Representative images and quantification of cortical pan-neuronal (NeuN) (A–C), and PV (D–F) interneuron loss. White line indicates local tumor margin demarcating subcortical tumor-rich from tumor-poor cortex. Images shown without and with green fluorescent infiltrating tumor cells. (G) Compared with control animals (n = 3), NeuN neuronal expression was significantly reduced in tumor cortex at both onset (P = 0.0004, n = 5) and late-stage animals (P = 0.0052, n = 5), but loss in peritumoral regions was not significant. (H) PV+ cells were significantly reduced in peritumoral regions at both onset (P = 0.0393, n = 5), and late-stage tumor animals (P = 0.0083, n = 5). Data are presented as mean ± SEM. *P < 0.05, **P < 0.01, ***P < 0.001 by 2-way ANOVA with Tukey’s multiple-comparisons test. Scale bars: 100 μm.
Table 1. Quantification of NeuN-positive cells.
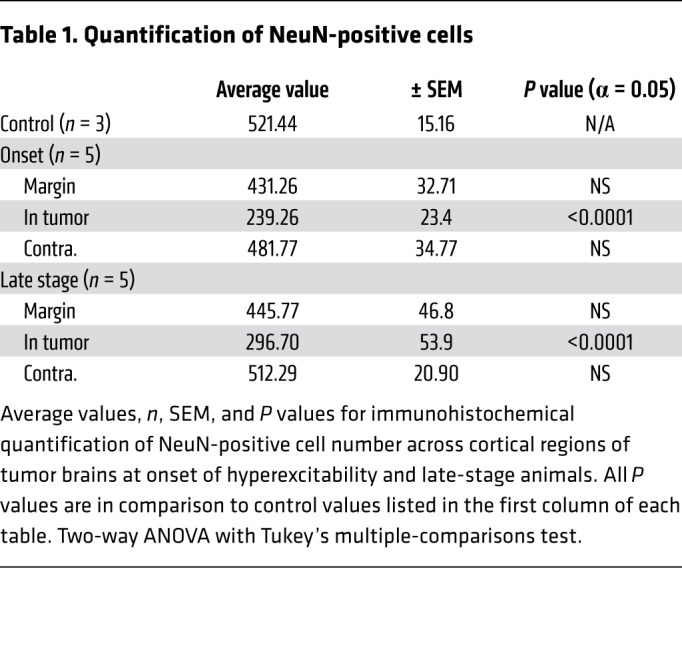
Table 2. Quantification of parvalbumin-positive cells.
Microglial inflammation and PNN disruption during epileptogenesis.
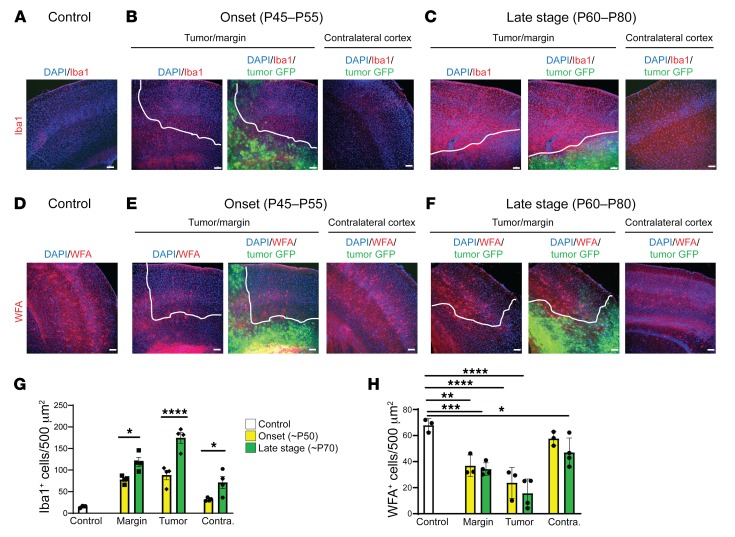
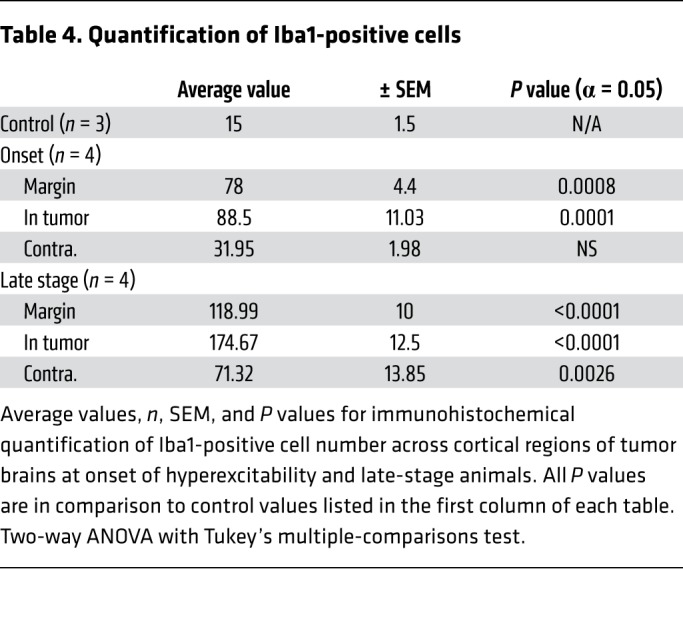
Cellular inflammation is a prime candidate for progressive changes in network excitability in the context of tumor-related epilepsy, but it is understudied in mouse xenograft models, even though SCID mice display a robust cortical microglial population (34). Microglial infiltration is enhanced in human glioma (35), and may contribute to metastases (5, 36, 37), synaptic stripping (38), and increased likelihood of recurrent seizures, justifying its emergence as a therapeutic target (39–41). Peritumoral hyperexcitability may be aggravated by tumor cell secretion of extracellular matrix degrading proteins (MMPs) that degrade PNN scaffolds, which support interneuron function (15); pathologically activated microglia are known contributors to MMP secretion (42). We therefore analyzed the expression of Iba1, a microglial marker, and Wisteria floribunda agglutinin (WFA), a PNN marker, at onset and late stages. Iba1+ cell number was increased approximately 5-fold in the peritumoral margin at onset (Figure 4, A, B, and G, and Table 3) compared with nontumor controls (Figure 4, A and G, and Supplemental Table 1). Iba1+ cell density further increased in the tumor margin during the ensuing period (Figure 4, C and G, and Table 3). Interestingly, the efflorescence of Iba1+ cells was pervasive and present even in the contralateral cortex, distant from the principal tumor mass and devoid of GFP+ microislets. Although peritumoral cortical cell loss was comparable between onset and late stages, levels of microglial infiltration correlated positively with the growth of hyperexcitability and cortical tumor progression. Iba1+ cells in tumoral (Supplemental Figure 2A) and peritumoral (Supplemental Figure 2A2) regions assumed a more amoeboid morphology indicative of an activated state compared with microglia in tumor-free regions and in control brains, which more frequently resembled the resting ramified state (Supplemental Figure 2B), demonstrating that tumorigenesis in late-stage mice entailed a marked shift toward reactive microgliosis.
Figure 4. Tumor mice exhibited increases in microglial activation and PNN degradation that correlated with increased hyperexcitability.
Representative images and quantification of Iba1+ microglia (A–C and G) and WFA+ cells (D–F and H). Dotted white line indicates local tumor margin demarcating subcortical tumor-rich from tumor-poor cortex. Images shown without and with infiltrating green fluorescent tumor cell signal. (A–C and G) Relative to control brain, there was a marked increase in Iba1+ microglia at onset of hyperexcitability. This microglial invasion progressed into the late stage, where, relative to onset, Iba1+ cell number was further increased in tumor margin (P = 0.0163), GFP+ tumor (P < 0.0001), and tumor-free (P = 0.0217) regions of cortex. (D–F and H) WFA labels PNNs in the CNS. Compared with controls, WFA+ cells (red) were reduced to similar levels in tumor margin (onset, P = 0.0016; late stage P = 0.0003) and tumor regions (onset and late stage, P < 0.0001). WFA+ cells were reduced in contralateral tumor-free regions of late-stage animals (P = 0.0275), but not onset animals. However, WFA+ cell number was not significantly reduced between onset and late stage in any cortical region, including tumor-free cortex, and statistical analysis subsequently did not show a significant interaction of disease time point on WFA+ cell number. n = 3 animals for all controls, n = 4 animals for onset and late-stage Iba1, n = 3 for onset WFA, n = 4 for late-stage WFA; data presented as mean ± SEM. *P < 0.05, **P < 0.01, ***P < 0.001, ****P < 0.0001 by 2-way ANOVA. Scale bars: 100 μm.
Table 3. Quantification of WFA-positive cells.
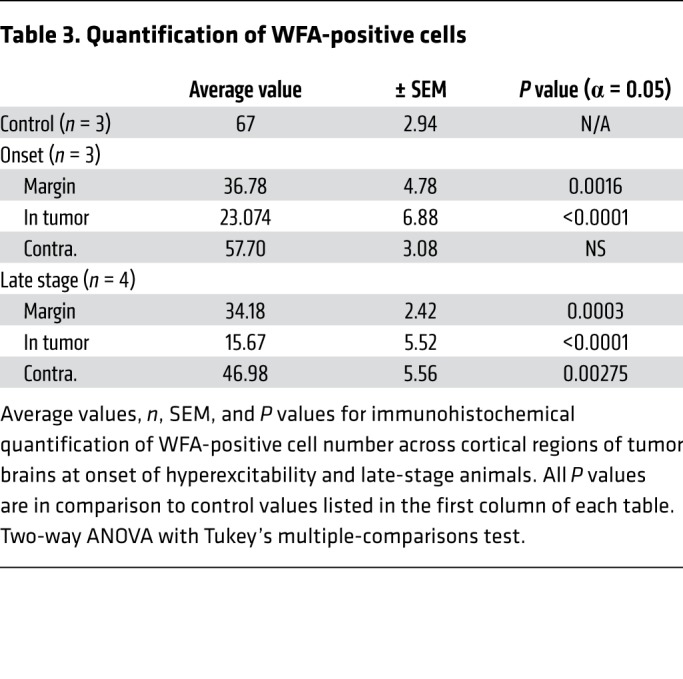
The microglial infiltration was spatially and temporally associated with PNN degradation, as we found a sharp reduction in WFA+ cells (Figure 4, D–F) within peritumoral margins compared with control tumor-free mice at early and late stages, mirroring the loss of PV+ interneurons in these regions. Outside tumor-positive regions, there was no significant loss of WFA+ cells in mice at the early stage (Figure 4, E and H, and Table 4), but at the late stage, the WFA+ cell number was reduced by 15% in the contralateral tumor-free cortex, compared with controls (Figure 4H and Table 4), even without a loss of PV+ interneurons. These results raise the possibility that although MMP secretion by tumor cells is one candidate mechanism for PNN degradation in regions within the tumor, microglial infiltration near and far away from the tumor (contralateral cortex) could also contribute to PNN degradation and facilitate the transition from peritumoral hyperexcitability to generalized seizure activity. Other specific mechanistic relationships remain to be evaluated; for example, we also found evidence of moderate reactive astrocytosis at onset and late disease stages (Supplemental Figure 4), which has been linked to epileptogenesis (43), yet conversely, has been proposed to exert an antiinflammatory influence in the tumoral milieu (44).
Table 4. Quantification of Iba1-positive cells.
Excess glutamate release and xCT expression.
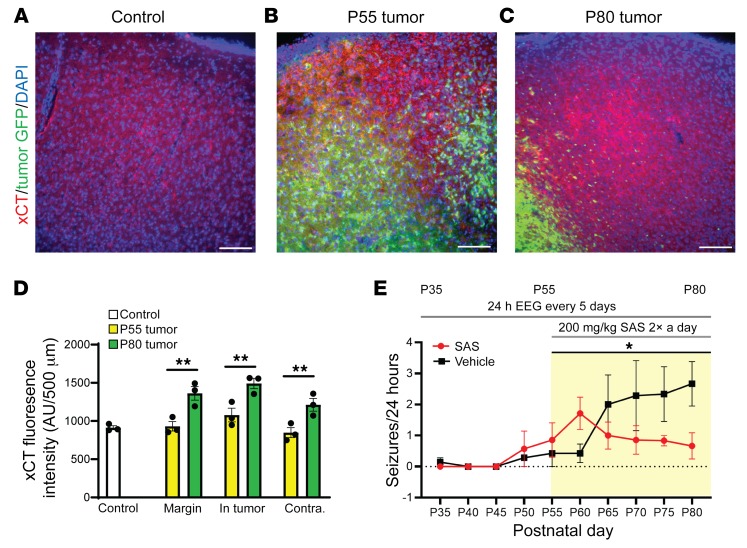
Elevated extracellular glutamate is a key contributor to cortical hyperexcitability, SD, epileptiform activity, and excitotoxicity (26, 33). Although a principal role of glia in glutamate homeostasis involves extracellular glutamate uptake via Glut1-mediated transport, astrocytes also regulate extracellular glutamate release via the cysteine/glutamate antiporter system xc-. System xc- activity and expression of the catalytic subunit xCT is elevated in GBM xenograft tissue and leads to excess secretion of glutamate into the surrounding cortex, inducing spike discharges and lowering the seizure threshold (13). In samples of human glioma tissue, high levels of xCT expression correlate with increased tumor-associated epilepsy (45, 46), suggesting that upregulation of xc- might occur early during epileptogenesis in our model. We examined expression of system xc- by comparing xCT antibody immunostaining in the WT control cortex, the P55 tumor cortex of mice that exhibited aberrant spike activity, and the P80 tumor cortex of mice with recurrent seizures. We found that the intensity of xCT staining was similar in WT and all regions of hyperexcitable P55 tumor brains (Figure 5, A, B, and D; control = 911.95 ± 25.65 arbitrary units (AU), n = 3; margin = 930.49 ± 61.53 AU, NS, n = 3; in tumor = 1078.32 ± 89.69 AU, NS, n = 3; contralateral = 847.20 ± 65.05 AU, NS, n = 3). However, in P80 tumor brains, xCT expression was significantly increased compared with controls and P55 tumor animals across all regions, coinciding with seizure onset (Figure 5, A, C, and D; late stage: margin = 1362.206 ± 88.96 AU, P = 0.001, n = 3; in tumor = 1491.08 ± 68.60 AU, P = 0.002, n = 3; contralateral = 1212.79 ± 82.99 AU, P = 0.006, n = 3). This finding is consistent with data in the xenograft model demonstrating that elevated xCT expression contributes to late-stage seizure activity (15), and further confirms that in the IUE model, the cytopathic xCT and microglial inflammatory changes associated with recurrent seizure activity appear sequentially at a later time point in the tumor life cycle and define late-stage epileptogenesis.
Figure 5. Antibody staining for xCT was increased in late-disease-stage mice, and xCT inhibitor SAS downregulated generalized seizure activity.
Representative patterns of xCT expression in coronal brain sections using specific fluorescent anti-xCT antibody. Compared with nontumor controls (A) ×20 images of xCT in control, (B) P55 tumor animals experiencing hyperexcitability, and (C) P80 tumor animals that exhibited generalized seizure activity. (D) Analysis of fluorescence intensity in xCT stained tumor brains showed that, compared with controls and with P55 tumor animals, xCT fluorescence intensity was significantly increased in peritumoral (P = 0.001), GFP-positive tumor (P = 0.002), and tumor-free regions of cortex (P = 0.006); N = 3 animals for all regions and time points. Two-way ANOVA with Tukey’s correction for multiple comparisons. (E) Blockade of xCT reduces seizures. Tumor mice were administered 200 mg/kg SAS twice daily from P55 to P80, while control animals received PBS. Seizure activity monitored in SAS-treated mice declined gradually throughout the treatment period, differing significantly from that in untreated tumor littermates (P = 0.028; PBS n = 8, SAS n = 7); mixed-effects ANOVA. *P < 0.05; **P < 0.01. Scale bars: 100 μm.
Early chronic SAS administration downregulates seizure activity.
SAS, the FDA-approved drug that blocks xc-, acutely reduces established seizure activity both in vitro and in vivo (12). We tested whether early treatment with SAS during the hyperexcitability stage could prevent the transition from intermittent cortical discharge activity to recurrent spontaneous seizures, using interictal spikes as a measure of hyperexcitability and generalized tonic-clonic seizures as a measure of epileptiform activity. We implanted tumor mice for intracranial video-EEG monitoring at P28 and recorded baseline activity at 24-hour intervals every 5 days starting at P35. We administered 200 mg/kg intraperitoneal injections of SAS twice daily from P55, when peritumoral cell loss and interictal spiking were both significant, until P80, when all animals experienced seizures, while monitoring video EEG every 5 days. Spontaneous seizure activity in SAS-treated mice decreased during the treatment period, whereas it steadily increased over time in control animals treated with saline (PBS) (Figure 5E; P80, PBS = 2.667 ± 0.715 seizures/24 hours; SAS = 0.667 ± 422 seizures/24 hours; n = 8 per group, P < 0.01). Despite its antiseizure effect, SAS treatment did not suppress interictal discharges.
Tau deletion reduces interictal spike activity and delays seizure prevalence.
Finally, we asked whether the intrinsic excitability of host cortical networks plays a role in the development of GBM-related epilepsy. Human epilepsy risk is highly genetic and the broad spectrum of the biological functions of known epilepsy genes even overlaps with some known brain cancer genes (47). This relationship suggests that an intrinsic increase in cortical network hyperexcitability may serve as yet another factor contributing to tumor-related epileptogenesis, and is thus a future target for clinical management of glioma-related epilepsy.
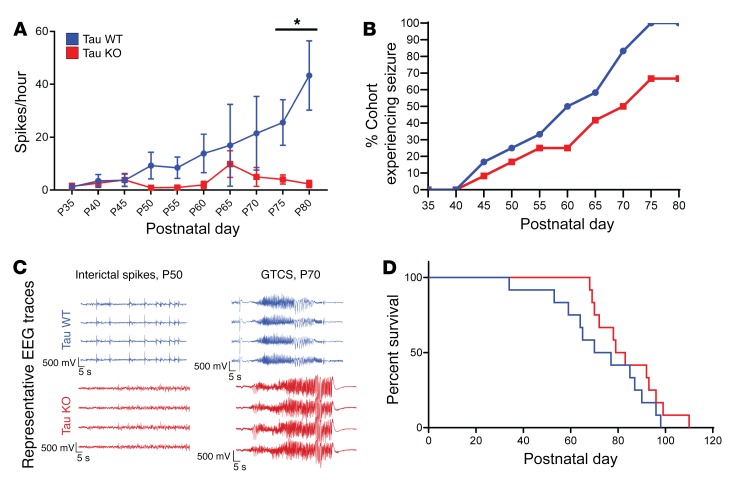
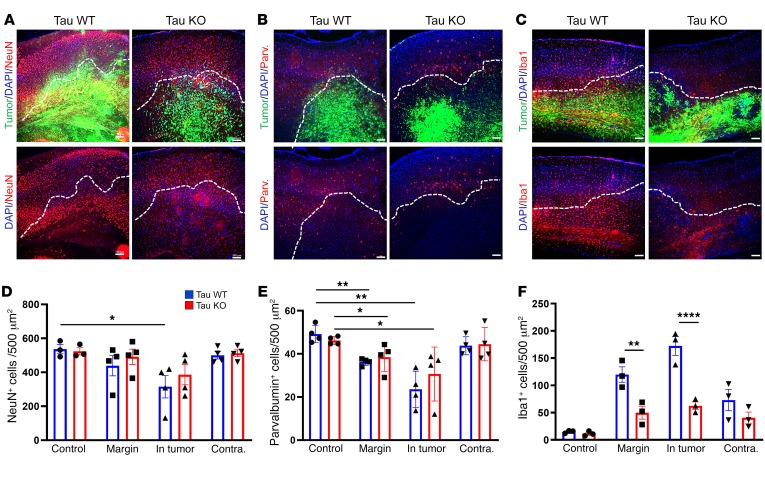
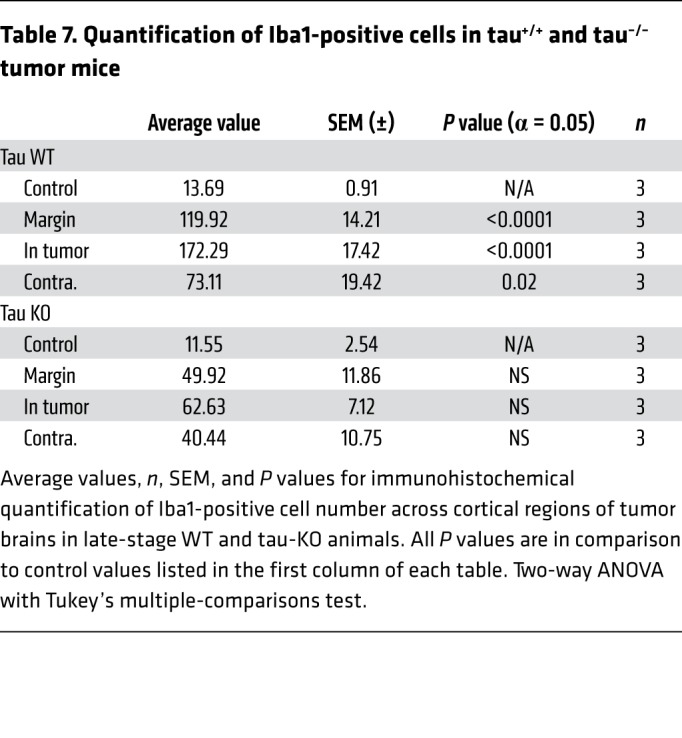
To test this hypothesis, we examined whether reducing the level of network excitability in the host brain influenced glioma-related epilepsy progression. Genomic deletion of MapT, the gene encoding the microtubule-associated protein tau, is a remarkably effective suppressor of cortical network hyperexcitability in various monogenic epilepsy and neurodegeneration models (20–22, 48–50), and there is evidence that MapT-KO neural circuits are resistant to elevated extracellular glutamate (51), a key driver of epileptiform activity in glioma. We generated IUE tumors in mice on a MapT–/– background to determine whether absence of tau protein could effectively suppress cortical hyperexcitability biomarkers in the GBM model. All tumor mice generated on the MapT+/+ (tau WT) background exhibited a significant increase in interictal spike activity throughout their lifespan, with most spikes occurring at late disease stages (Figure 6, A and C; P35 WT = 1.3 spikes/hour ± 0.6, n = 12; P80 WT = 29.29 ± 13.3 spikes/hour, n = 5; P = 0.001). In contrast, tumor mice generated on the MapT–/– (tau KO) background did not show significant increases in spike activity as the tumor progressed (Figure 6A; P35 KO = 1.104 ± 0.65 spikes/hour, n = 12; P80 KO = 1.086 ± 0.703 spikes/hour, n = 5; NS). Both tau-WT and tau-KO tumor mice developed generalized seizures (Figure 6C), but tau-KO tumor mice exhibited a slower progression (Figure 6B; WT n = 12, KO n = 12), and seizures were detected in only 20% of these mice by P60 compared with 50% in tau WT. By P80, only 67% of tau-KO tumor mice had experienced seizures, compared with 100% of tau-WT-tumor mice. The delayed appearance of seizures is also reflected in the onset of mortality (Figure 6D). While overall survival was not clearly prolonged, the earliest death in the tau-KO cohort occurred 3 weeks later than the sentinel death in the tau-WT cohort. The range of EEG seizure discharge durations varied in all mice (15–75 seconds), and there was no certain difference in either length or pattern between genotypes. Interestingly, tumor-induced late-stage cell loss was similar between both genotypes; at P80 both tau-KO and WT tumor mice exhibited similar reductions in NeuN+ cells within peritumoral and tumor-positive regions (Figure 7, A and D, and Table 5). PV+ cells were reduced by tau deletion within the tumoral and peritumoral regions (Figure 7, B and E, and Table 6). In contrast, Iba1+ cells were not elevated in tau-KO tumors or peritumoral margins, as observed in WT tumor brains (Figure 7, C and F, and Table 7). The reduction in peritumoral neuronal microglial expression in both tau-KO and WT animals indicates that although absence of tau protein does not protect against cortical tumor infiltration and cell death, it effectively suppresses network hyperexcitability and microgliosis, adding further evidence supporting microglial inflammation as a potential contributing factor to this critical period of epileptogenesis.
Figure 6. Tau deletion in host brain suppressed generalized spikes and seizures.
(A) Interictal spike and seizure activity sampled over a 17-hour period every 5 days from P35 to P80 in WT and tau-KO tumor mice. WT mice exhibited a significant increase in spike activity over the course of disease compared with tau-KO-tumor mice (P = 0.0015), 1-way ANOVA, WT n = 11, KO n = 13. (B) Comparison of generalized seizure activity in cohorts of WT and tau-KO-tumor mice. WT tumor mice showed progressive increases in seizure activity, with 100% of WT tumor mice experiencing seizure by P80 (n = 12). In contrast, tau-KO-tumor mice exhibited seizures, but the increase in seizure prevalence was slower than WT tumor animals; by P80 only 67% of tau-KO-tumor mice had had a seizure (n = 12). (C) Representative EEG of interictal spikes and seizures in tau-KO and WT mice. (D) Kaplan-Meier survival plot of WT (blue) and tau-KO-tumor (red) mice. WT median 73.5 days; n = 12. KO median 81 days; n = 12. Data are presented as mean ± SEM. *P < 0.05.
Figure 7. Histopathological analysis of tumoral and peritumoral regions in tau-WT- and tau-KO-tumor animals.
Representative images of (A) NeuN, (B) PV, and (C) Iba1 expression in tumor-burdened cortex of tau-WT and -KO mice. The lower images are the same as the upper, but the tumor GFP channel has been removed so that changes in expression within the tumor burden can be more easily seen. The dotted white line demarcates the tumor margin. (D) Compared with control brain, NeuN+ cell number was significantly reduced in GFP+ tumor regions of WT (P = 0.0236) but not KO animals. (E) Relative to control brain, PV+ cells were significantly reduced in peritumoral margin (WT P = 0.0014, KO P = 0.0385) and GFP+ tumor regions (WT P = 0.012, KO P = 0.0385). (F) Increase in Iba1+ cell number was significantly larger in tau-WT-tumor animals compared with tau-KO-tumor animals in both peritumoral margin (P = 0.0038) and GFP+ tumor regions (P < 0.0001). NeuN (WT and KO), control n = 3, tumor n = 4. PV (WT and KO) control and tumor n = 4. Iba1 (WT and KO) control and tumor n = 3. Data are presented as mean ± SEM. *P < 0.05; **P < 0.01; ****P < 0.0001 by 2-way ANOVA with Tukey’s multiple-comparisons test. Scale bars: 100 μm.
Table 5. Quantification of NeuN-positive cells in tau+/+ and tau–/– tumor mice.
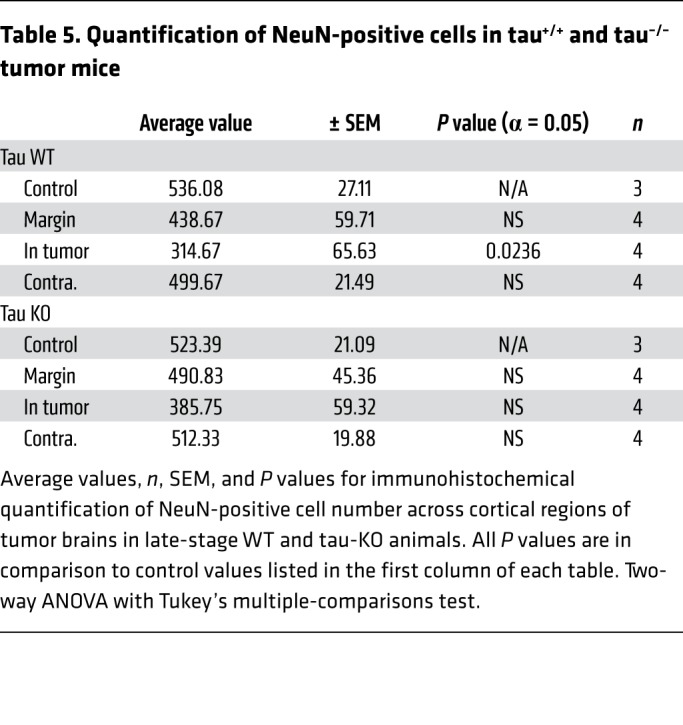
Table 6. Quantification of parvalbumin-positive cells in tau+/+ and tau–/– tumor mice.
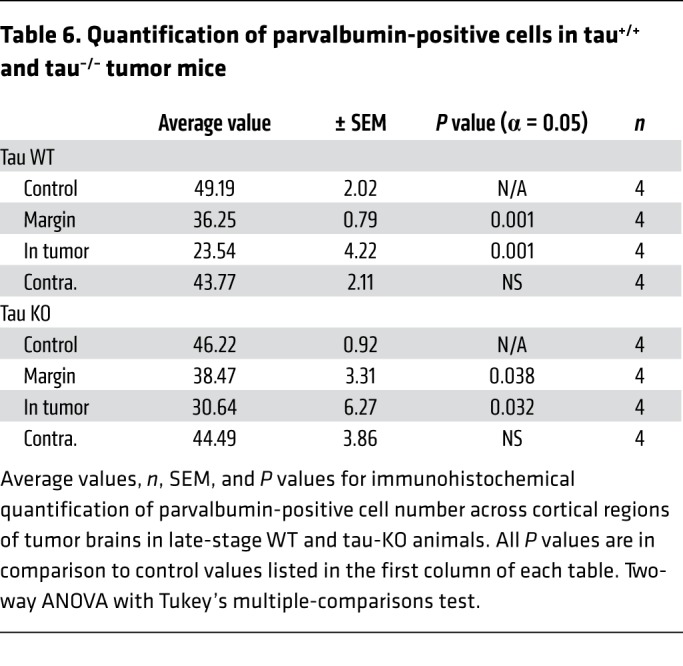
Table 7. Quantification of Iba1-positive cells in tau+/+ and tau–/– tumor mice.
Discussion
Cognitive impairments and recurring seizures affect up to 80% of all patients with diffuse glioma and up to 50% of patients with GBM during the course of their disease (52, 53). Although no single experimental model recapitulates the full diversity of human glioma, insight into the emergence of hyperexcitability and natural history of epileptogenesis in cortical networks, along with the opportunity to link these to specific oncogenic drivers (9), can provide a precision, mechanism-based approach to individualized medical management of this serious tumor comorbidity. Here we show by EEG and cortical imaging of a defined gene variant mouse model of GBM that tumor propagation in an immunocompetent host reveals a steady progression from cortical hyperexcitability with spike discharges to the spontaneous appearance of tonic-clonic seizures, an aggressive stage reached by 65% of hospitalized patients in the final 10 days of life (54). Repeated episodes of cortical SD, hitherto unrecognized in brain tumor models, were captured; their potential proinflammatory effect adds a pathogenic mechanism that may play an amplifying role in progressive hyperexcitability. These pathological waves involve massive intracellular calcium influx mediated in part by NMDA receptor activation that transiently silences neuronal activity and briefly impairs the precise coding of high-frequency synaptic inputs in recovering neurons (55). SD appearance in brain tumors is of clinical relevance and may contribute to common transient neurological symptoms including confusional spells, motor deficits, and headache in glioma patients (56).
Sequence of epileptogenesis.
The clearly defined excitability progression in this model allowed us to stage cellular mechanisms contributing to epileptogenesis. We found a consistent pattern that provides new details and unexpected incongruities in the timing of these pathogenic events. At the early stage of cortical hyperexcitability, malignant cell invasion correlated with substantial interneuronal loss and PNN degradation in the peritumoral margin, in accordance with findings at 2 weeks after xenograft in SCID mice (13–15). Although relative interneuron loss and total neuronal loss clearly contribute to cortical spiking at the earliest stage, we found little evidence of significant amplification of these 2 peritumoral mechanisms in the subsequent stage of spontaneous seizure activity. Serial coronal sections showed that by the time of seizure onset, tumor burden had expanded within the cortex as malignant cells migrated from the initial mass to more distant satellite regions, while the fractional loss of interneurons in the margins remained relatively constant. Previous studies in the xenograft model showed that marginal PV loss was present and might directly account for the appearance of seizure activity (15); however, here we found that peritumoral disinhibition was present far earlier, at the onset of interictal spikes, indicating that there is no simple relationship between this defect and seizure onset. Over subsequent weeks, although the absolute density of peritumoral PV cell loss per high-powered field remained fairly constant from early to late disease stages, the tumor perimeter steadily expanded, which might account for the initiation of seizure activity after disinhibition reached a critical size or location. This hypothesis is supported by experiments showing that focal microapplication of toxins that block synaptic GABA release disinhibit neurons but do not cause seizures, indicating that network seizure threshold varies according to the cytoarchitecture and extent of disinhibition in different cortical regions (57). However, additional pathophysiology, including the late-onset upregulation of xCT and inflammation we observed, may also contribute to the temporal delay until this threshold is surpassed. In many experimental models, injury to the neocortex requires a latency of weeks to mature into a chronic epileptogenic focus, which may reflect a slow, multifactorial process that includes disinhibition, inflammation, and neosynaptogenesis (41, 58).
Excess peritumoral extracellular glutamate.
Along with lost peritumoral synaptic inhibition, increased extracellular glutamate due to overexpression of glial glutamate antiporter system xc- has been proposed as an important contributor to epileptogenesis in tumor-related epilepsy (45, 46, 59). In our model, peritumoral expression of xCT, the catalytic subunit of system xc-, was not significantly increased at the earliest onset of hyperexcitability, as indicated by the appearance of abnormal EEG spikes, but was upregulated in later-stage animals experiencing seizures. The positive correlation between xCT expression and epileptogenesis in our model agrees with prior work demonstrating a higher seizure incidence in patients who have greater expression of system xc- (59). We assayed the effect of daily SAS administration on seizure activity, reported to be effective in modulating acute epileptiform activity for specific tumor subtypes both in vitro and in vivo (13, 60). In agreement with these studies, we found that SAS treatment did not acutely block interictal spiking EEG activity; however, we found a gradual suppression of generalized seizure activity during a 25-day period of continued SAS treatment, further emphasizing the importance of exploring SAS’s therapeutic potential. Although cortical glutamate levels were not measured in this study, our evidence further supports the view that changes in xCT levels may be instrumental in seizure expression and that reversal can contribute to its delayed appearance.
Progressive neuroinflammation.
A benefit of the CRISPR-based glioma model is that inflammation can be longitudinally studied in immunocompetent inbred mouse strains. We correlated changes in cortical microgliosis at various stages during progression of hyperexcitability, finding that microglial infiltration within the neocortex coincided with the onset of tumor invasion and steadily increased throughout epileptogenesis in regions both near and remote from tumor cells. Using Iba1 as a microglial marker, we found that at early disease stages, microglial density rose 5-fold, whereas in late-stage animals, there was a further 1.5-fold generalized increase in Iba1+ microglia across both brain hemispheres. In contrast, the extent of interneuron loss and PNNs in the marginal zone present at the onset of EEG hyperexcitability did not grow after seizures began.
PNNs stabilize the function of fast-spiking interneurons, and tumor cells secrete PNN-degrading MMPs into the peritumoral space, contributing to network hyperexcitability (15). Activated microglia also secrete these MMPs and sculpt network excitability in multiple brain diseases (61). Here we found that microglial infiltration in tumor, peritumoral, and tumor-free regions of the cortex in late-stage disease mice correlated positively with PNN degradation in these same regions. Thus, tumor cells may drive MMP degradation in regions contiguous with the tumor mass, while a lesser degradation of PNNs in regions remote from even isolated malignant cells may contribute to network hyperexcitability across a broader expanse of the tumor-free neocortex. Microglia also release MMPs, and it is worth noting that they possess significant biological and regional heterogeneity (62, 63) and are also driven by tumor genetics (64).
Genomic reduction of host brain intrinsic cortical network excitability delays onset of tumor-induced seizures.
A newly emerging paradigm based on neuron-glia crosstalk has led to important insights on how modulation of neuronal activity might affect proliferative diseases such as malignant glioma (65, 66). It is likely that the mechanisms underlying peritumoral hyperexcitability in glioma are recursive, in that greater excitability drives tumor progression, and greater tumor progression promotes further hyperexcitability. After defining a sequence of peritumoral network alterations that contribute to hyperexcitability, we further explored how the dynamics of reducing intrinsic network excitability in the host brain could affect epilepsy progression. To this end, we generated IUE tumors in a genetically seizure-resistant cortex using the tau-KO mouse. Deletion of tau significantly reduces seizures and mortality in 2 monogenic channelopathy epilepsy models, namely Kcna1 potassium channel subunit–deficient (20) and Scn1a sodium channel subunit–deficient mice (21). Tau loss also rescues cortical hyperexcitability due to GABAergic interneuron loss in Aβ overexpression mouse models of Alzheimer’s disease (22, 49, 67–69). The mechanisms linking tau deficiency with network excitability are poorly understood, but may relate to impaired NMDA receptor glutamate sensitivity. Tau-KO neurons have a reduced NMDA receptor–dependent calcium influx and show less excitotoxicity in the presence of increased extracellular glutamate (51). It is worth noting that our MapT deletion lines remove tau from neurons and glia, and therefore the cells critical for the protective effect of tau loss is still uncertain. We found a difference in the hyperexcitability profile in mice with tumors expressed on either a WT or tau-KO genetic background. In tau-WT mice, interictal spike activity gradually increased, and remained stable throughout later stages after seizures appeared. In contrast, tau-KO mice showed a lower frequency of interictal spike activity and no increase until the latest stage. Seizure prevalence was reduced in tau-KO-tumor mice, but overall lifespan was not longer. Based on interictal spikes as a measure of cortical excitability, we found that, as in the epilepsy models, tau-KO networks are more resistant to hyperexcitability. Fewer KO mice experienced seizures at P80 compared with WT mice, even in the presence of a steadily expanding glioblastoma. The fact that this was not reflected in prolonged survival suggests that the cause of death likely depended on tumor-related variables other than seizures, since monitored tumor mice eventually died after prolonged periods of flat EEG brain activity likely due to increased intracranial pressure or brainstem spreading depression, as seen in other mouse epilepsy models with sudden death (70). The effect of germline tau loss demonstrates that the host, as well as tumor genetic heterogeneity (11), play key roles in tumor-related epileptogenesis. Apart from survival, we did not examine the effect of seizure reduction on tumor cytology or growth due to its widespread infiltration.
In conclusion, we have established a model of WT adult GBM in the immunocompetent brain that confirmed reported mechanisms driving peritumoral epilepsy in the immunodeficient brain, demonstrated functional dysregulation of glutamate homeostasis in the form of spontaneous episodes of spreading depression, and added detailed insight into the timing and pervasive appearance of reactive microglia during epileptogenesis. We have confirmed that SAS blockade of glial glutamate xCT antiporter reduced seizures in an already disinhibited network, and showed that it effectively delayed the onset of seizures in this model before they appear. Our finding that tau deletion limits the severity of tumor-related epilepsy establishes an important link to NMDA-dependent mechanisms in other inherited forms of epilepsy, and designates MapT as a candidate epilepsy suppressor gene for precision genotyping of patients with refractory tumor-related seizures.
Methods
Animals
CRISPR mice were generated on CD-1 and C57BL/6 backgrounds (The Jackson Laboratory) as described previously (8) and below. Tau-KO mice (provided by Michael P. Vitek, Duke University School of Medicine, Durham, North Carolina, USA) containing a targeted knockout mutation of the MapT gene on chromosome 11 were used to generate brain tumor models with suppressed excitability (71). Heterozygous MapT mice on a C57BL/6 background (tau+/–) from the lab of Michael P. Vitek were crossed to generate offspring of various tau backgrounds (tau+/+, tau+/–, tau–/–) for IUE models. In some studies, CD-1 mice were also deleted for tau. Mice of either sex were studied for all experiments unless stated otherwise. Mice were housed at 22°C with a 12-hour light/dark cycle.
Genotyping
Genomic DNA was isolated from tail clips using DirectPCR Lysis Reagent (VWR). Genotype was determined using PCR amplification for specific alleles, as described previously for tau (72). PCR products were separated in a 1% agarose gel by electrophoresis.
Mouse models of glioma
For germline mutant tumor studies, all mouse gliomas were generated in the MapT C57BL/6 background. Mice used for SAS studies were generated on a CD-1 IGS mouse background. IUEs were performed as described previously (7). CRISPR-IUE GBM were generated by electroporating the 3 pX33- constructs targeting Pten, Trp53, and Nf1. Guide sequences for these CRISPRs were selected from previously published sequences (7, 8) and validated in the IUE model. CRISPR-IUE GBM constructs were also electroporated with the pGLAST-PBase vector to visualize fluorescently labeled tumor cells. CRISPR-IUE tumors were harvested at P45 to P80 from male and female mice.
In vivo EEG recordings
Mice were anesthetized by isoflurane vaporization pump and surgically implanted with bilateral silver wire electrodes (0.005-inch diameter) attached to a microminiature connector. EEG wires were inserted into the subdural space over the frontal and temporal cortices through cranial burr holes. Mice were allowed to recover for 5 days or longer before the study. EEG and behavioral activity in freely behaving mice with food and water available ad libitum were analyzed using simultaneous video-EEG monitoring (Harmonie software version 6.1c, Stellate Systems). All EEG signals were acquired at 200 Hz and filtered using a 0.3-Hz high-pass filter, 70-Hz low-pass filter, and a 60-Hz notch filter. Mice were recorded in 17- or 24-hour monitoring sessions every 5 days from 5 to 12 weeks of age. Seizure activity defined by EEG waveform and corresponding video-recorded behavior were quantified by visual inspection. Interictal spike (IS) activity defined by EEG waveform during intervals between seizures was processed in MATLAB (R2018b, MathWorks, Inc.) using an established automated spike counter optimized for processing murine EEG data in conjunction with the original creators (72). The data were then filtered in MATLAB to ensure that only time-locked generalized IS discharges, defined as spikes occurring within 2 milliseconds of each other across 2 or more EEG leads, were counted.
In vivo cortical slow depolarization monitoring
During surgery, a pair of silver wires (0.5 mm) were placed bilaterally over the dura surface covering the somatosensory cortex (2 mm lateral, –1 mm posterior from bregma), with a third wire over the cerebellum for ground. EEG signals were amplified by Bio Amp (ADI) and digitized by PowerLab system (ADI). Electrophysiological voltage data were acquired at 1 kHz in DC mode.
SAS administration
SAS powder (MilliporeSigma, catalog S0883) was dissolved in 0.1 N NaOH at a concentration of 20 mg/mL on a stir plate, with pH adjusted to 7.8. Mice were dosed at 200 mg/kg twice daily via intraperitoneal injection from P55 to P80. The solution was prepared fresh daily for morning and afternoon administration.
Immunocytochemistry
Mice were intracardially perfused with PBS followed by chilled 4% paraformaldehyde/PBS solution. Brains were removed and immersed in 30% sucrose PBS solution for 24 to 28 hours, embedded in OCT medium, and frozen. Cryopreserved brains were cut into 30-μm coronal sections using a Leica CM1950 cryostat and the sections mounted on charged microscope slides. All immunostaining was done on the slide. Before immunolabeling, the tissue border on the slide was circumscribed with a hydrophobic pen (Immedge, Vector Labs) to confine the staining solution. Slides were incubated in a light-protected benchtop humidity chamber and processed for staining.
Sections were first washed 3 times with PBS for 5 minutes each, and then blocked with 10% BSA in 0.3% Triton X-100/PBS for 1 hour at room temperature. Primary antibodies were incubated overnight at 4°C. Primary antibodies used were PV (Novus Biologicals, catalog NB120-11427; 1:500), NeuN (MilliporeSigma, catalog MAB377; 1:800), Iba1 (code 019-19741, Wako Chemicals; 1:1000), and xCT P3 (astroglial xCT; gift of Thadd Reeder, Zogenix, Inc. Emeryville, California, USA; 1:500). Alexa Fluor–labeled secondary antibodies were incubated for 1 hour at room temperature (Thermo Fisher Scientific, 1:500). WFA+ cells were labeled using a modified version of the above protocol. After washing and blocking, slides were incubated with biotinylated WFA (Vector Laboratories, catalog B-1355; 1:500) for 2 hours at room temperature, incubated for 1 hour at room temperature with Alexa Fluor 594–conjugated streptavidin (Thermo Fisher Scientific, catalog S32356), and mounted with DAPI after washing 3 times in PBS.
Calcium imaging methods
Animal preparation: EEG and headpost surgery.
3xCr-IUE–injected mice of both sexes were anesthetized around P40 (± 5 days) with 5% isoflurane. After administration of 5 mg/kg meloxicam, the scalp was removed, the skin was glued to the side of the head with Vetbond tissue adhesive (3M), and 3 holes were carefully drilled at bregma + 2 mm, 5 mm left of midline; bregma + 2 mm, 5 mm right of midline (EEG left and right channels); and lambda – 3 mm, 3 mm right of midline, using a dental drill (Midwest Dental) with a 1/4 FG carbide bit until only a thin bone flap was left above the dura, which was then carefully lifted using a 30-gauge needle. Three Teflon-coated, 0.25-mm diameter silver wires (1-mm tip stripped of insulation, beveled, and chlorided) were implanted epidurally and attached parallel to the skull surface with Vetbond. A custom-made 25-mm diameter aluminum headpost was attached permanently on top of the skull surface and the EEG wires fixed with dental cement (Lang Dental). Animals were allowed to recover and given meloxicam injections for the following 3 days.
Animal preparation: AAV injection.
Three to 5 days after the EEG and headpost surgery, we injected pGP-AAV-syn-jGCaMP7f-WPRE (Addgene plasmid 104488), diluted with sterile saline solution (1:2.25) at 2 depths (~350 μm and ~650 μm below dura) in 4 locations per hemisphere: bregma – 3.5 mm, 2.5 mm lateral; bregma – 2 mm, 1 mm lateral; bregma – 2 mm, 4 mm lateral; and bregma – 0.5 mm, 2.5 mm lateral. Per location and depth, approximately 210 nL of virus solution was injected in 23 pulses (every 10 seconds) of 9.2 nL each at low speed using a Nanoject II injector (Drummond Scientific). The glass injection pipette was kept in place for 5 minutes before moving locations to aid diffusion of the virus.
Animal preparation: Craniotomy.
Two weeks after AAV injection, a craniotomy was performed. Skull bone was drilled for 30-second intervals, and then cooled with saline solution. A thin strip of the skull covering the superior sagittal sinus was thinned but not removed. A custom-cut no. 1 cover glass window covering both hemispheres (lambda – 1.5 mm posterior to bregma + 1 mm anterior; – 5 mm to + 5 mm lateral) was implanted using Vetbond and dental cement. Dexamethasone (0.5 mg/kg) was injected on the day of the craniotomy and for the following 3 days to control inflammation.
Imaging and physiological recording.
Mice were typically imaged every 4 to 5 days before P70, and every 2 to 3 days thereafter until spontaneous seizures occurred. Then imaging was performed every day until the animal appeared moribund and was euthanized. The mouse was head-fixed and allowed to freely run on top of a custom-built Styrofoam wheel (12 cm diameter), whose rotational speed was recorded by a velocity sensor. One-photon image sequences were acquired with an Edge 4.2 sCMOS camera (PCO AG), mounted on top of the scan head of a Bruker Ultima IV microscope with a ×2 objective lens (CFI Plan Apo Lambda ×2, Nikon). Blue illumination light was generated by a Xenon arc lamp (Zeiss), guided through a 480/20 excitation filter. Images were acquired at 100 Hz with 2 × 2 digital binning (1024 × 1024-pixel resolution) on a Lenovo P920 workstation. EEG signals were amplified (HP 0.1 Hz, LP 5 kHz, gain ×100) using a Model 1700 differential AC amplifier (A-M Systems), digitized with a USB-6211 multifunction I/O device (National Instruments), and recorded using WinEDR freeware (Strathclyde University) at 10 kHz. Pupil size of the right eye was illuminated with an IR LED and recorded at 30 Hz with a GC660 IR camera (Allied Vision Technologies) using custom MATLAB routines. The position and movement of the animal’s head, front paws, and frontal parts of the body were monitored and recorded at 30 Hz with another IR camera (model SC1280G12N, Thorlabs).
Data visualization.
One-photon images were down-sampled (2 × 2, linear interpolation) in ImageJ (FIJI distribution), and imported into MATLAB for motion correction. The corrected TIFF files were loaded into FIJI, and substacks were selected for the time periods depicted in Figure 2. A median projection of baseline activity was calculated for each segment, and the frames in each segment were divided by the median projection, generating ΔF/F movie segments. For the panels in Figure 2, A and C, these ΔF/F frames were then averaged across the respective time segments, and a custom lookup table was applied. Unfiltered EEG traces were plotted in MATLAB.
Statistics
PV, NeuN, Iba1, and WFA cell counts.
Design-based stereology used to quantify staining-positive cell number in cortical regions of tumor-bearing and sham mice was adapted from previous work (14). Sections were viewed using a Nikon TE2000-S epifluorescence microscope. Cortex and tumor burden were identified on slide-mounted sections. Estimated total of fluorescent tumor cells was determined using the optical fractionator probe, and all sampling was done under ×10 objective using a concentric circle counting frame superimposed on the image. Positively stained cells were counted in triplicate sections per slide and averaged across slides to obtain an average slide value. Three slides were counted per animal, resulting in 3 averaged slide values per animal; each n value represents the average of the 3 average slide values. The tumor interior was defined as a region of cortex within an area of the highest density of confluent GFP-positive tumor cells. The “tumor margin” was defined as GFP-positive cells counted in the region up to 500 μm from the confluent tumor edge, taking care to avoid small populations of migrating tumor cells. “Outside the tumor margin” was defined as the region beyond this 500-μm radius, and was frequently assessed on the side of the cortex that had not been invaded by tumor cells, since tumors often arise in 1 hemisphere and migrate to the alternate hemisphere over time. Cells in control mice were quantified using similar cortical regions in an area of the same size and shape as in tumor-burdened cortical sections, with the same number of slices counted per animal. Fluorescence intensity was quantified using a 500-μm line plot of fluorescence intensity for cortical regions defined as described above using the NIS-Elements image acquisition and analysis program. The top 200 peak values of fluorescence intensity were taken and averaged for the cortical region of each optical section, and 3 optical sections were used from each animal.
P values for EEG recordings were obtained using 1-way ANOVA with Tukey’s multiple-comparisons test and mixed-methods ANOVA. P values for immunohistochemical analysis were obtained using 2-way ANOVA with Sidak’s multiple-comparisons test. P values for the log-rank test were used for Kaplan-Meier survival analysis. Statistics were generated and graphed with Prism 7 (GraphPad Software) with an α level of P less than 0.05. Error bars represent standard error of the mean. Seizure prevalence is defined as the percentage of mice in each group that have experienced at least 1 seizure throughout their lifetime.
Study approval
All studies were carried out in accordance with NIH guidelines (Guide for the Care and Use of Laboratory Animals, National Academies Press, 2011) and with the approval of Baylor College of Medicine’s Animal Care and Use Committee.
Author contributions
AH designed, performed, and analyzed all EEG, cytopathology, and drug studies. KY engineered IUE mouse models. IA performed in vivo SD cortical electrophysiology. JM performed serial in vivo GCAMP calcium imaging. BD designed experiments and contributed scientific direction. JLN designed experiments, supervised all research, and cowrote the manuscript with AH.
Supplementary Material
Acknowledgments
This study was supported by an HHMI Gilliam Predoctoral Fellowship (to AH), NCI R01CA223388 (to JLN and BD), Zogenix research grant (to JLN and BD), and Blue Bird Circle Foundation (to JLN).
Version 1. 04/06/2020
Electronic publication
Version 2. 05/01/2020
Print issue publication
Footnotes
Conflict of interest: The authors have declared that no conflict of interest exists.
Copyright: © 2020, American Society for Clinical Investigation.
Reference information: J Clin Invest. 2020;130(5):2286–2300.https://doi.org/10.1172/JCI133316.
Contributor Information
Asante Hatcher, Email: hatcher@bcm.edu.
Kwanha Yu, Email: Kwanha.Yu@bcm.edu.
Jochen Meyer, Email: jfmeyer@bcm.edu.
Isamu Aiba, Email: Isamu.Aiba@bcm.edu.
References
- 1.Molinaro AM, Taylor JW, Wiencke JK, Wrensch MR. Genetic and molecular epidemiology of adult diffuse glioma. Nat Rev Neurol. 2019;15(7):405–417. doi: 10.1038/s41582-019-0220-2. [DOI] [PMC free article] [PubMed] [Google Scholar]
- 2.Englot DJ, Chang EF, Vecht CJ. Epilepsy and brain tumors. Handb Clin Neurol. 2016;134:267–285. doi: 10.1016/B978-0-12-802997-8.00016-5. [DOI] [PMC free article] [PubMed] [Google Scholar]
- 3.Dührsen L, et al. Seizures as presenting symptom in patients with glioblastoma. Epilepsia. 2019;60(1):149–154. doi: 10.1111/epi.14615. [DOI] [PubMed] [Google Scholar]
- 4.Quail DF, Joyce JA. The microenvironmental landscape of brain tumors. Cancer Cell. 2017;31(3):326–341. doi: 10.1016/j.ccell.2017.02.009. [DOI] [PMC free article] [PubMed] [Google Scholar]
- 5.Jones C, et al. Pediatric high-grade glioma: biologically and clinically in need of new thinking. Neuro-oncology. 2017;19(2):153–161. doi: 10.1093/neuonc/now101. [DOI] [PMC free article] [PubMed] [Google Scholar]
- 6.Lan X, et al. Fate mapping of human glioblastoma reveals an invariant stem cell hierarchy. Nature. 2017;549(7671):227–232. doi: 10.1038/nature23666. [DOI] [PMC free article] [PubMed] [Google Scholar]
- 7.Laug D, Glasgow SM, Deneen B. A glial blueprint for gliomagenesis. Nat Rev Neurosci. 2018;19(7):393–403. doi: 10.1038/s41583-018-0014-3. [DOI] [PMC free article] [PubMed] [Google Scholar]
- 8.John Lin CC, et al. Identification of diverse astrocyte populations and their malignant analogs. Nat Neurosci. 2017;20(3):396–405. doi: 10.1038/nn.4493. [DOI] [PMC free article] [PubMed] [Google Scholar]
- 9.Yu KY, et al. PIK3CA variants selectively initiate brain hyperactivity during gliomagenesis. Nature. 2020;578(7793):166–171. doi: 10.1038/s41586-020-1952-2. [DOI] [PMC free article] [PubMed] [Google Scholar]
- 10.Venkatesh HS, et al. Neuronal activity promotes glioma growth through neuroligin-3 secretion. Cell. 2015;161(4):803–816. doi: 10.1016/j.cell.2015.04.012. [DOI] [PMC free article] [PubMed] [Google Scholar]
- 11.Venkatesh HS, et al. Electrical and synaptic integration of glioma into neural circuits. Nature. 2019;573(7775):539–545. doi: 10.1038/s41586-019-1563-y. [DOI] [PMC free article] [PubMed] [Google Scholar]
- 12.Venkataramani V, et al. Glutamatergic synaptic input to glioma cells drives brain tumour progression. Nature. 2019;573(7775):532–538. doi: 10.1038/s41586-019-1564-x. [DOI] [PubMed] [Google Scholar]
- 13.Buckingham SC, et al. Glutamate release by primary brain tumors induces epileptic activity. Nat Med. 2011;17(10):1269–1274. doi: 10.1038/nm.2453. [DOI] [PMC free article] [PubMed] [Google Scholar]
- 14.Campbell SL, et al. GABAergic disinhibition and impaired KCC2 cotransporter activity underlie tumor-associated epilepsy. Glia. 2015;63(1):23–36. doi: 10.1002/glia.22730. [DOI] [PMC free article] [PubMed] [Google Scholar]
- 15.Tewari BP, Chaunsali L, Campbell SL, Patel DC, Goode AE, Sontheimer H. Perineuronal nets decrease membrane capacitance of peritumoral fast spiking interneurons in a model of epilepsy. Nat Commun. 2018;9(1):4724. doi: 10.1038/s41467-018-07113-0. [DOI] [PMC free article] [PubMed] [Google Scholar]
- 16.Takenaka MC, et al. Control of tumor-associated macrophages and T cells in glioblastoma via AHR and CD39. Nat Neurosci. 2019;22(5):729–740. doi: 10.1038/s41593-019-0370-y. [DOI] [PMC free article] [PubMed] [Google Scholar]
- 17.Aiba I, Shuttleworth CW. Sustained NMDA receptor activation by spreading depolarizations can initiate excitotoxic injury in metabolically compromised neurons. J Physiol (Lond) 2012;590(22):5877–5893. doi: 10.1113/jphysiol.2012.234476. [DOI] [PMC free article] [PubMed] [Google Scholar]
- 18.Takizawa T, et al. Non-invasively triggered spreading depolarizations induce a rapid pro-inflammatory response in cerebral cortex [published online June 26, 2019] J Cereb Blood Flow Metab. doi: 10.1177/0271678X19859381. https://doi.org/ 10.1177/0271678X19859381 [DOI] [PMC free article] [PubMed] [Google Scholar]
- 19.Shibata M, Suzuki N. Exploring the role of microglia in cortical spreading depression in neurological disease. J Cereb Blood Flow Metab. 2017;37(4):1182–1191. doi: 10.1177/0271678X17690537. [DOI] [PMC free article] [PubMed] [Google Scholar]
- 20.Holth JK, et al. Tau loss attenuates neuronal network hyperexcitability in mouse and Drosophila genetic models of epilepsy. J Neurosci. 2013;33(4):1651–1659. doi: 10.1523/JNEUROSCI.3191-12.2013. [DOI] [PMC free article] [PubMed] [Google Scholar]
- 21.Gheyara AL, et al. Tau reduction prevents disease in a mouse model of Dravet syndrome. Ann Neurol. 2014;76(3):443–456. doi: 10.1002/ana.24230. [DOI] [PMC free article] [PubMed] [Google Scholar]
- 22.Roberson ED, et al. Amyloid-β/Fyn-induced synaptic, network, and cognitive impairments depend on tau levels in multiple mouse models of Alzheimer’s disease. J Neurosci. 2011;31(2):700–711. doi: 10.1523/JNEUROSCI.4152-10.2011. [DOI] [PMC free article] [PubMed] [Google Scholar]
- 23.Benitez JA, et al. PTEN regulates glioblastoma oncogenesis through chromatin-associated complexes of DAXX and histone H3.3. Nat Commun. 2017;8:15223. doi: 10.1038/ncomms15223. [DOI] [PMC free article] [PubMed] [Google Scholar]
- 24.Jeong TS, Yee GT. Glioblastoma in a patient with neurofibromatosis type 1: a case report and review of the literature. Brain Tumor Res Treat. 2014;2(1):36–38. doi: 10.14791/btrt.2014.2.1.36. [DOI] [PMC free article] [PubMed] [Google Scholar]
- 25.Zhang Y, et al. The p53 pathway in glioblastoma. Cancers (Basel) 2018;10(9):E297. doi: 10.3390/cancers10090297. [DOI] [PMC free article] [PubMed] [Google Scholar]
- 26.Pietrobon D, Moskowitz MA. Chaos and commotion in the wake of cortical spreading depression and spreading depolarizations. Nat Rev Neurosci. 2014;15(6):379–393. doi: 10.1038/nrn3770. [DOI] [PubMed] [Google Scholar]
- 27.Dreier JP, Lemale CL, Kola V, Friedman A, Schoknecht K. Spreading depolarization is not an epiphenomenon but the principal mechanism of the cytotoxic edema in various gray matter structures of the brain during stroke. Neuropharmacology. 2018;134(pt B):189–207. doi: 10.1016/j.neuropharm.2017.09.027. [DOI] [PubMed] [Google Scholar]
- 28.Dreier JP. The role of spreading depression, spreading depolarization and spreading ischemia in neurological disease. Nat Med. 2011;17(4):439–447. doi: 10.1038/nm.2333. [DOI] [PubMed] [Google Scholar]
- 29.Takizawa T, et al. High-mobility group box 1 is an important mediator of microglial activation induced by cortical spreading depression. J Cereb Blood Flow Metab. 2017;37(3):890–901. doi: 10.1177/0271678X16647398. [DOI] [PMC free article] [PubMed] [Google Scholar]
- 30.Lima CB, Soares Gde S, Vitor SM, Andrade-da-Costa BL, Castellano B, Guedes RC. Spreading depression features and Iba1 immunoreactivity in the cerebral cortex of developing rats submitted to treadmill exercise after treatment with monosodium glutamate. Int J Dev Neurosci. 2014;33:98–105. doi: 10.1016/j.ijdevneu.2013.12.008. [DOI] [PubMed] [Google Scholar]
- 31.Eickhoff M, et al. Spreading depression triggers ictaform activity in partially disinhibited neuronal tissues. Exp Neurol. 2014;253:1–15. doi: 10.1016/j.expneurol.2013.12.008. [DOI] [PubMed] [Google Scholar]
- 32.Meyer J, Maheshwari A, Noebels J, Smirnakis S. Asynchronous suppression of visual cortex during absence seizures in stargazer mice. Nat Commun. 2018;9(1):1938. doi: 10.1038/s41467-018-04349-8. [DOI] [PMC free article] [PubMed] [Google Scholar]
- 33.Patel DC, Tewari BP, Chaunsali L, Sontheimer H. Neuron-glia interactions in the pathophysiology of epilepsy. Nat Rev Neurosci. 2019;20(5):282–297. doi: 10.1038/s41583-019-0126-4. [DOI] [PMC free article] [PubMed] [Google Scholar]
- 34.Lorke DE, Ip CW, Schumacher U. Increased number of microglia in the brain of severe combined immunodeficient (SCID) mice. Histochem Cell Biol. 2008;130(4):693–697. doi: 10.1007/s00418-008-0463-2. [DOI] [PubMed] [Google Scholar]
- 35.Gutmann DH, Kettenmann H. Microglia/brain macrophages as central drivers of brain tumor pathobiology. Neuron. 2019;104(3):442–449. doi: 10.1016/j.neuron.2019.08.028. [DOI] [PMC free article] [PubMed] [Google Scholar]
- 36.De Palma M. Origins of brain tumor macrophages. Cancer Cell. 2016;30(6):832–833. doi: 10.1016/j.ccell.2016.11.015. [DOI] [PubMed] [Google Scholar]
- 37.Zhu W, et al. Glioma-mediated microglial activation promotes glioma proliferation and migration: roles of Na+/H+ exchanger isoform 1. Carcinogenesis. 2016;37(9):839–851. doi: 10.1093/carcin/bgw068. [DOI] [PMC free article] [PubMed] [Google Scholar]
- 38.Salter MW, Stevens B. Microglia emerge as central players in brain disease. Nat Med. 2017;23(9):1018–1027. doi: 10.1038/nm.4397. [DOI] [PubMed] [Google Scholar]
- 39.Prionisti I, Bühler LH, Walker PR, Jolivet RB. Harnessing microglia and macrophages for the treatment of glioblastoma. Front Pharmacol. 2019;10:506. doi: 10.3389/fphar.2019.00506. [DOI] [PMC free article] [PubMed] [Google Scholar]
- 40.Chia K, Keatinge M, Mazzolini J, Sieger D. Brain tumours repurpose endogenous neuron to microglia signalling mechanisms to promote their own proliferation. Elife. 2019;8:e46912. doi: 10.7554/eLife.46912. [DOI] [PMC free article] [PubMed] [Google Scholar]
- 41.Vezzani A, Balosso S, Ravizza T. Neuroinflammatory pathways as treatment targets and biomarkers in epilepsy. Nat Rev Neurol. 2019;15(8):459–472. doi: 10.1038/s41582-019-0217-x. [DOI] [PubMed] [Google Scholar]
- 42.Könnecke H, Bechmann I. The role of microglia and matrix metalloproteinases involvement in neuroinflammation and gliomas. Clin Dev Immunol. 2013;2013:914104. doi: 10.1155/2013/914104. [DOI] [PMC free article] [PubMed] [Google Scholar]
- 43.Robel S, et al. Reactive astrogliosis causes the development of spontaneous seizures. J Neurosci. 2015;35(8):3330–3345. doi: 10.1523/JNEUROSCI.1574-14.2015. [DOI] [PMC free article] [PubMed] [Google Scholar]
- 44.Henrik Heiland D, et al. Tumor-associated reactive astrocytes aid the evolution of immunosuppressive environment in glioblastoma. Nat Commun. 2019;10(1):2541. doi: 10.1038/s41467-019-10493-6. [DOI] [PMC free article] [PubMed] [Google Scholar]
- 45.Sørensen MF, et al. High expression of cystine-glutamate antiporter xCT (SLC7A11) is an independent biomarker for epileptic seizures at diagnosis in glioma. J Neurooncol. 2018;138(1):49–53. doi: 10.1007/s11060-018-2785-9. [DOI] [PubMed] [Google Scholar]
- 46.Yuen TI, et al. Glutamate is associated with a higher risk of seizures in patients with gliomas. Neurology. 2012;79(9):883–889. doi: 10.1212/WNL.0b013e318266fa89. [DOI] [PubMed] [Google Scholar]
- 47.Noebels J. Pathway-driven discovery of epilepsy genes. Nat Neurosci. 2015;18(3):344–350. doi: 10.1038/nn.3933. [DOI] [PMC free article] [PubMed] [Google Scholar]
- 48.Li Z, Hall AM, Kelinske M, Roberson ED. Seizure resistance without parkinsonism in aged mice after tau reduction. Neurobiol Aging. 2014;35(11):2617–2624. doi: 10.1016/j.neurobiolaging.2014.05.001. [DOI] [PMC free article] [PubMed] [Google Scholar]
- 49.Roberson ED, et al. Reducing endogenous tau ameliorates amyloid beta-induced deficits in an Alzheimer’s disease mouse model. Science. 2007;316(5825):750–754. doi: 10.1126/science.1141736. [DOI] [PubMed] [Google Scholar]
- 50.DeVos SL, et al. Antisense reduction of tau in adult mice protects against seizures. J Neurosci. 2013;33(31):12887–12897. doi: 10.1523/JNEUROSCI.2107-13.2013. [DOI] [PMC free article] [PubMed] [Google Scholar]
- 51.Miyamoto T, et al. Phosphorylation of tau at Y18, but not tau-fyn binding, is required for tau to modulate NMDA receptor-dependent excitotoxicity in primary neuronal culture. Mol Neurodegener. 2017;12(1):41. doi: 10.1186/s13024-017-0176-x. [DOI] [PMC free article] [PubMed] [Google Scholar]
- 52.van Breemen MS, Wilms EB, Vecht CJ. Epilepsy in patients with brain tumours: epidemiology, mechanisms, and management. Lancet Neurol. 2007;6(5):421–430. doi: 10.1016/S1474-4422(07)70103-5. [DOI] [PubMed] [Google Scholar]
- 53.van Kessel E, Baumfalk AE, van Zandvoort MJE, Robe PA, Snijders TJ. Tumor-related neurocognitive dysfunction in patients with diffuse glioma: a systematic review of neurocognitive functioning prior to anti-tumor treatment. J Neurooncol. 2017;134(1):9–18. doi: 10.1007/s11060-017-2503-z. [DOI] [PMC free article] [PubMed] [Google Scholar]
- 54.Thier K, Calabek B, Tinchon A, Grisold W, Oberndorfer S. The last 10 days of patients with glioblastoma: assessment of clinical signs and symptoms as well as treatment. Am J Hosp Palliat Care. 2016;33(10):985–988. doi: 10.1177/1049909115609295. [DOI] [PubMed] [Google Scholar]
- 55.Revah O, Stoler O, Neef A, Wolf F, Fleidervish IA, Gutnick MJ. Dynamic gain analysis reveals encoding deficiencies in cortical neurons that recover from hypoxia-induced spreading depolarizations. J Neurosci. 2019;39(39):7790–7800. doi: 10.1523/JNEUROSCI.3147-18.2019. [DOI] [PMC free article] [PubMed] [Google Scholar]
- 56.IJzerman-Korevaar M, Snijders TJ, de Graeff A, Teunissen SCCM, de Vos FYF. Prevalence of symptoms in glioma patients throughout the disease trajectory: a systematic review. J Neurooncol. 2018;140(3):485–496. doi: 10.1007/s11060-018-03015-9. [DOI] [PMC free article] [PubMed] [Google Scholar]
- 57.Hagemann G, Hoeller M, Bruehl C, Lutzenburg M, Witte OW. Effects of tetanus toxin on functional inhibition after injection in separate cortical areas in rat. Brain Res. 1999;818(1):127–134. doi: 10.1016/S0006-8993(98)01293-1. [DOI] [PubMed] [Google Scholar]
- 58.Esclapez M, Hirsch JC, Ben-Ari Y, Bernard C. Newly formed excitatory pathways provide a substrate for hyperexcitability in experimental temporal lobe epilepsy. J Comp Neurol. 1999;408(4):449–460. doi: 10.1002/(SICI)1096-9861(19990614)408:4<449::AID-CNE1>3.0.CO;2-R. [DOI] [PubMed] [Google Scholar]
- 59.Robert SM, et al. SLC7A11 expression is associated with seizures and predicts poor survival in patients with malignant glioma. Sci Transl Med. 2015;7(289):289ra86. doi: 10.1126/scitranslmed.aaa8103. [DOI] [PMC free article] [PubMed] [Google Scholar]
- 60.Campbell SL, Buckingham SC, Sontheimer H. Human glioma cells induce hyperexcitability in cortical networks. Epilepsia. 2012;53(8):1360–1370. doi: 10.1111/j.1528-1167.2012.03557.x. [DOI] [PMC free article] [PubMed] [Google Scholar]
- 61.De Luca C, Colangelo AM, Alberghina L, Papa M. Neuro-immune hemostasis: homeostasis and diseases in the central nervous system. Front Cell Neurosci. 2018;12:459. doi: 10.3389/fncel.2018.00459. [DOI] [PMC free article] [PubMed] [Google Scholar]
- 62.Masuda T, et al. Author correction: Spatial and temporal heterogeneity of mouse and human microglia at single-cell resolution. Nature. 2019;568(7751):E4. doi: 10.1038/s41586-019-1045-2. [DOI] [PubMed] [Google Scholar]
- 63.Böttcher C, et al. Human microglia regional heterogeneity and phenotypes determined by multiplexed single-cell mass cytometry. Nat Neurosci. 2019;22(1):78–90. doi: 10.1038/s41593-018-0290-2. [DOI] [PubMed] [Google Scholar]
- 64.Wang Q, et al. Tumor evolution of glioma-intrinsic gene expression subtypes associates with immunological changes in the microenvironment. Cancer Cell. 2017;32(1):42–56.e6. doi: 10.1016/j.ccell.2017.06.003. [DOI] [PMC free article] [PubMed] [Google Scholar]
- 65.Gillespie S, Monje M. An active role for neurons in glioma progression: making sense of Scherer’s structures. Neuro Oncol. 2018;20(10):1292–1299. doi: 10.1093/neuonc/noy083. [DOI] [PMC free article] [PubMed] [Google Scholar]
- 66.Venkatesh HS, et al. Targeting neuronal activity-regulated neuroligin-3 dependency in high-grade glioma. Nature. 2017;549(7673):533–537. doi: 10.1038/nature24014. [DOI] [PMC free article] [PubMed] [Google Scholar]
- 67.Andrews-Zwilling Y, et al. Apolipoprotein E4 causes age- and tau-dependent impairment of GABAergic interneurons, leading to learning and memory deficits in mice. J Neurosci. 2010;30(41):13707–13717. doi: 10.1523/JNEUROSCI.4040-10.2010. [DOI] [PMC free article] [PubMed] [Google Scholar]
- 68.Li G, et al. GABAergic interneuron dysfunction impairs hippocampal neurogenesis in adult apolipoprotein E4 knockin mice. Cell Stem Cell. 2009;5(6):634–645. doi: 10.1016/j.stem.2009.10.015. [DOI] [PMC free article] [PubMed] [Google Scholar]
- 69.Hunter JM, et al. Emergence of a seizure phenotype in aged apolipoprotein epsilon 4 targeted replacement mice. Brain Res. 2012;1467:120–132. doi: 10.1016/j.brainres.2012.05.048. [DOI] [PubMed] [Google Scholar]
- 70.Aiba I, Noebels JL. Spreading depolarization in the brainstem mediates sudden cardiorespiratory arrest in mouse SUDEP models. Sci Transl Med. 2015;7(282):282ra46. doi: 10.1126/scitranslmed.aaa4050. [DOI] [PMC free article] [PubMed] [Google Scholar]
- 71.Dawson HN, Ferreira A, Eyster MV, Ghoshal N, Binder LI, Vitek MP. Inhibition of neuronal maturation in primary hippocampal neurons from tau deficient mice. J Cell Sci. 2001;114(pt 6):1179–1187. doi: 10.1242/jcs.114.6.1179. [DOI] [PubMed] [Google Scholar]
- 72.Barkmeier, et al. High inter-reviewer variability of spike detection on intracranial EEG addressed by an automated multi-channel algorithm. Clin Neurophysiol. 2012;123(6):1088–1095. doi: 10.1016/j.clinph.2011.09.023. [DOI] [PMC free article] [PubMed] [Google Scholar]
Associated Data
This section collects any data citations, data availability statements, or supplementary materials included in this article.


