Abstract
Colorectal cancer (CRC) is one of the most common malignancies, with varying prognoses and a high mortality. There is an urgent need to establish a new prediction model to predict the survival risk of CRC patients. The long non-coding RNAs (lncRNAs) expression profiles and corresponding clinical information of CRC patients were obtained from The Cancer Genome Atlas, TCGA. We identified a total of 1,176 lncRNAs differentially expressed between 480 CRC and 41 normal tissues. In the training test, we combined these differentially expressed lncRNAs with overall survival of CRC patients. Six lncRNAs (AL356270.1, LINC02257, AC020891.2, LINC01485, AC083967.1 and RBAKDN) were finally screened out by using LASSO regression mode to establish a novel prediction model as a prognostic indicator for CRC patients. The area under the curve (AUC) of 3- and 5-year ROC analysis in CRC were 0.6923 and 0.7328 for training set, and were 0.6803 and 0.7035 for testing set, respectively. K-M analysis revealed a significant difference between high risk and low risk in the training set (P-value = 5.0e-05) and testing set (P-value = 0.00052), respectively. Our study shows that the six lncRNAs model can improve the survival prediction mechanism of patients with CRC and provide help for patients through personalized treatment.
Keywords: CRC, overall survival, lncRNAs, LASSO regression
Introduction
Colorectal cancer (CRC) showed the second highest mortality rate among all cancers, and its morbidity and mortality ranked the third (10.9%) and the fourth (9.0%) among male cancer patients, the second (9.5%) and the third (9.5%) among female cancer patients, respectively [1]. Despite the therapeutic advances and earlier detection, the five-year survival rate of patients with CRC remains unsatisfactory [2]. One of the main reasons is that existing staging systems (such as TNM), which classify the extent of cancer basing on clinicopathologic data, can neither assess the prognosis nor reflect the biologic heterogeneity of cancer [3-5]. Thus, it is necessary to find novel predictive biomarkers related to prognosis or efficacy of treatment.
Long non-coding RNAs (lncRNAs) are a class of RNA molecules with more than 200 nucleotides in length and without protein-coding capacity, which once were considered to be transcriptional noise [6]. There is increasing evidence that the aberrant expression of lncRNAs is closely related to the occurrence and development of CRC and can be used as diagnostic and prognostic biomarker of CRC [7]. For example, SLCO4A1-AS1 promotes tumor growth and metastasis and serves as an oncogenic role in CRC [8]. LINC00312 [9] and BCYRN1 [10] have shown to play an important regulatory role in CRC cancer cell proliferation and metastasis invasion. LINC02257 and AC083967.1 were found to be associated with the prognosis of CRC patients through the ceRNA network [11]. These studies also reported that the lncRNA may be a biomarker for CRC diagnosis and prognosis. However, due to the complexity of the physiological mechanism of cancer, it is difficult to accurately predict the prognosis of CRC patients by single molecule or combined clinical features.
In this work, the lncRNA expression profiles and corresponding clinical information of CRC patients were obtained from The Cancer Genome Atlas (TCGA). We identified a total of 1,176 lncRNAs differentially expressed between 480 CRC and 41 normal tissues. We combined these differentially expressed lncRNAs with overall survival of CRC patients; six lncRNAs were finally screened out by using the least absolute shrinkage and selection operator regression (LASSO) regression mode to establish a novel prediction model as a prognostic indicator for CRC patients. Furthermore, this model was proved to be independent of other clinicopathologic variables by using univariate and multivariate Cox regression analysis and can be used as a survival evaluation model for CRC patients.
Materials and methods
Data source and preprocessing
The lncRNAs and mRNAs expression profile data and the corresponding clinical information of CRC patients were obtained from TCGA database on March 13, 2018, containing 480 CRC tumor specimens and 41 normal specimens. We determined that mRNAs and lncRNAs with expression values < 1 in 90% of the samples were low abundance RNA and then removed them. For the duplication data, the average values of the RNA expression were used. The differentially expressed mRNA and lncRNA were analyzed using R/Bioconductor package edgeR [12], with the criterion of a |log2FC| > 1.5 and P-value < 0.01.
Establishment of regression model and construction of risk score
After removing the samples without complete clinical information, univariate Cox models were performed to investigate the correlation between the lncRNA expression levels and the overall survival (OS) in CRC patients. LncRNAs with hazard ratio (HR) for death < 1 were defined as a protective RNAs and those with HR > 1 were defined as high-risk RNAs. We first selected lncRNAs as survival-related lncRNAs according to the P-value < 0.05, and then used the LASSO regression model to analyze and determine the most powerful prognostic markers [13]. Risk score (RS) was calculated according to the formula generated by LASSO regression model. To accurately classify CRC patients into high or low risk groups, cutoff point of RS was calculated using Youden’s index, which is obtained according to favorable sensitivity and specificity based on ROC curve of predicting 5-year survival in the training set.
Survival analysis and the nomogram construction
To verify that the prognostic value of the lncRNAs model can be independent of clinical features, univariate and multivariate Cox regression models were performed using SPSS (version 24.0). The receiver-operator characteristics (ROC) were used to compare the different manifestations of regression models and clinical features in predicting the prognosis of CRC patients. Kaplan-Meier (K-M) curve analysis also was utilized to estimate the survival for the patients between the high risk and the low risk group in the training and testing set. Nomogram was established based on the results of the multivariate Cox model analysis. The calibration plot was also performed to assess the relationship between the predictive values and the observation values in the probabilities of 3 year overall survival in the entire dataset. We used “glmnet” [14], “TimeROC” [15] and “rms” [16] package to do LASSO regression model analysis, time-dependent ROC curve analysis and nomogram plots, respectively.
Functional enrichment analysis
Based on the expression levels of key lncRNAs and mRNAs, Pearson correlation between them was calculated. The lncRNA-mRNA co-expression network was conducted by Cytoscape [17]. Cytoscape software (two plugins: ClueGO and CluePedia) was used for Gene Ontology (GO) and the Kyoto Encyclopedia of Genes and Genomes (KEGG) analysis.
Results
Differential lncRNA identification and regression model establishment
LncRNA array profiles and corresponding clinical records for patients with CRC were obtained from the TCGA database. Using the edgeR package, we identified a total of 1,176 lncRNAs with dysregulated expression between the 480 CRC tumor specimens and the 41 normal specimens, including 912 up-regulated and 264 down-regulated lncRNAs (Figure 1A). Among these aberrantly expressed lncRNAs, 70 prognostic lncRNAs were obtained by univariate Cox analysis (P-value < 0.05). Then, we removed the sample without adequate clinical information and obtained 438 CRC patients with complete survival information. These samples were randomly divided into training and test sets, each with 219 patients (Table 1). Finally, six lncRNAs (AL356270.1, LINC02257, AC020891.2, LINC01485, AC083967.1 and RBAKDN) were identified in the training set using LASSO regression model analysis (Figure 1B, 1C). The prognostic score was calculated as follows: (-0.0081515236 × expression level of AL356270.1) + (0.0396061920 × expression level of LINC02257) + (0.0471324736 × expression level of AC020891.2) + (-0.0002247442 × expression level of LINC01485) + (0.0033990833 × expression level of AC083967.1) + (0.0018798374 × expression level of RBAKDN). Among these six lncRNAs (Table 2), AL356270.1 and LINC01485 showed negative coefficients, which were derived from LASSO model, and seemed to be protective factors, as their high expressions predicted low risks. The other four lncRNAs with positive coefficients, including LINC02257, AC020891.2, AC083967.1 and RBAKDN, seemed to be risk factors, as their high expressions predicted high risks. The heat map shows the changes in the expression profiles of the six lncRNAs in the training set (Figure 1D).
Figure 1.
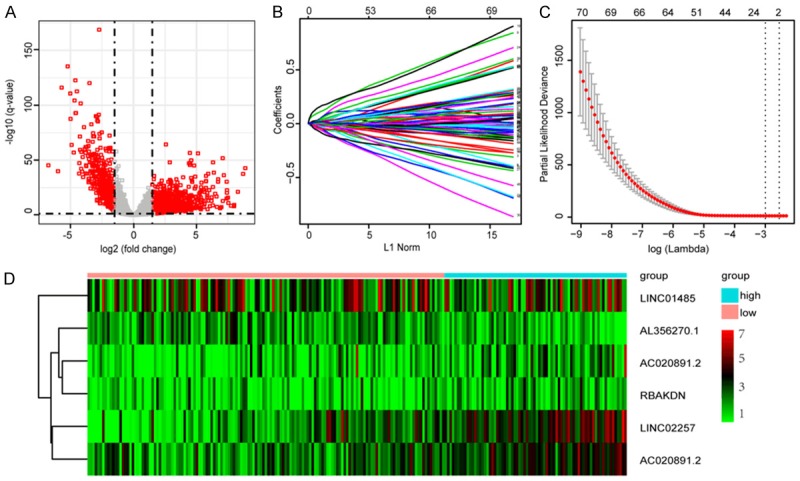
Identification of prognostic lncRNAs. (A) Volcano plots showing expression profiles of lncRNAs. The vertical lines correspond to 2.0-fold up- and down-regulation between CRC tissues and adjacent nontumorous tissues, and the horizontal line represents a q-value. The red point in the plot represents the differentially expressed miRNAs or mRNA with statistical significance; (B) Cross-validation for tuning parameter selection in the LASSO model; (C) LASSO coefficient profiles of 70 lncRNAs; and (D) Heat map of six lncRNAs in training set.
Table 1.
Clinical and pathologic information of CRC patients
| Variables | Training set (n = 219) | Testing set (n = 219) | Entire set (n = 438) | |
|---|---|---|---|---|
| Age | < 60 | 59 | 65 | 124 |
| ≥ 60 | 160 | 154 | 314 | |
| Gender | Male | 120 | 114 | 234 |
| Female | 99 | 105 | 204 | |
| pathologic-T | T1-T2 | 44 | 42 | 86 |
| T3-T4 | 175 | 177 | 352 | |
| pathologic-M | M0 | 159 | 164 | 323 |
| M1 | 54 | 54 | 108 | |
| NA | 6 | 1 | 7 | |
| pathologic-N | N0 | 131 | 125 | 256 |
| N1-N2 | 88 | 94 | 182 | |
| pathologic stage | I-II | 122 | 118 | 240 |
| III-IV | 91 | 96 | 187 | |
| NA | 5 | 4 | 9 | |
| Vital statue | Alive | 177 | 171 | 348 |
| Death | 42 | 48 | 90 |
Table 2.
The six lncRNAs significantly associated with overall survival of CRC patients
| Gene symbol | Ensembl number | Coefficient | Hazard ratio | P value |
|---|---|---|---|---|
| AL356270.1 | ENSG00000236915 | -0.008151524 | 0.810464882 | 0.0295246 |
| LINC02257 | ENSG00000238042 | 0.039606192 | 1.230672711 | 0.0008732 |
| AC020891.2 | ENSG00000259306 | 0.047132474 | 1.325255998 | 0.0003554 |
| LINC01485 | ENSG00000254211 | -0.000224744 | 0.883150351 | 0.0157486 |
| AC083967.1 | ENSG00000254337 | 0.003399083 | 1.207908284 | 0.0088715 |
| RBAKDN | ENSG00000273313 | 0.001879837 | 1.22050803 | 0.0099595 |
Cutoff estimation and validation of prognostic signature in training set
The RS for each sample in the training set was calculated according to the expression values of these six lncRNAs and the corresponding LASSO coefficients. The cutoff point of RS for dividing the high-risk and low-risk patients was calculated using Youden’s index, which is obtained according to favorable sensitivity and specificity (68.7% and 76.0%, respectively) based on ROC curve of predicting 5-year survival. Samples with a RS lower to 0.1828 were assigned to the low-risk group and the remaining samples to the high-risk group (Figure 2A, 2B).
Figure 2.
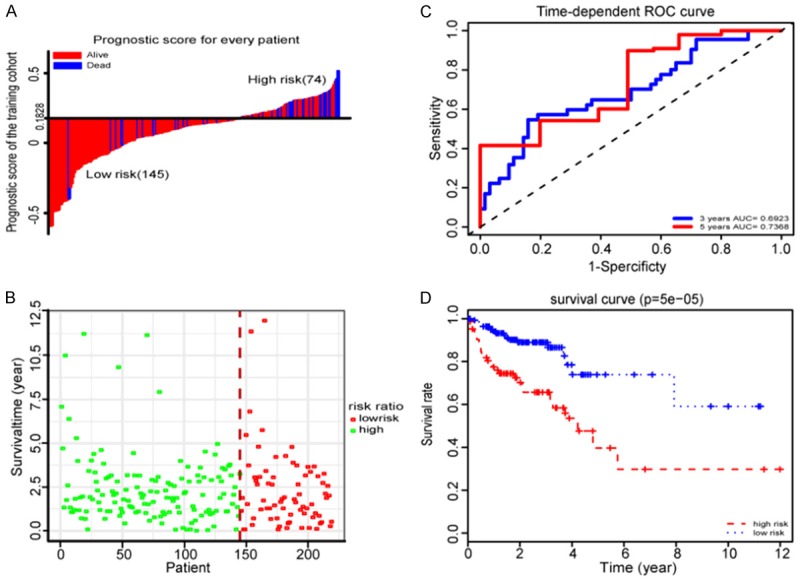
Properties of the training set prognostic classifier. A. The distribution of risk score of the training set. B. Training set survival time and status. C. Time-dependent ROC curves analysis in the training set. D. Kaplan-Meier survival analysis in the training set.
To evaluate the performance of the six lncRNAs model in predicting the prognosis of CRC patients, we conducted time-dependent ROC analysis for three and five years, respectively, based on OS of the training set. The area under the ROC curve (AUC) signed by six lncRNAs was 0.6923 and 0.7328, respectively, showing good performance (Figure 2C). To explore the relationship between RS and OS, K-M analysis was conducted on the training sets. As shown in Figure 2D, we found the prognosis of the low risk group was significantly better than that of the high risk group (P-value = 5.0e-05).
Validation of prognostic value of the six-lncRNA signature for the testing set
To validate the robustness of our prognostic LASSO regression model for survival prediction in CRC patients, the six lncRNA signatures were tested for their predictive ability in the testi set. Using the same regression model and cut-off points (cut-off = 0.1828) from the training set, 219 patients in the testing set were divided into a low-risk group (n = 130) and a high-risk group (n = 89) (Figure 3A, 3B). As in the training set, the expression levels of the six lncNRAs in the testing set also showed a similar clustering pattern (Figure 3C). Based on the OS of the testing set, we also conducted time-dependent ROC analysis for three and five years, respectively. The AUC assigned by six lncRNAs was 0.6803 and 0.7035, respectively (Figure 3D). As shown in Figure 3E, we also found the prognosis of the low risk group was significantly better than that of the high risk group (P-value = 0.00052). These data showed that our regression model had the same predictive power in different populations.
Figure 3.
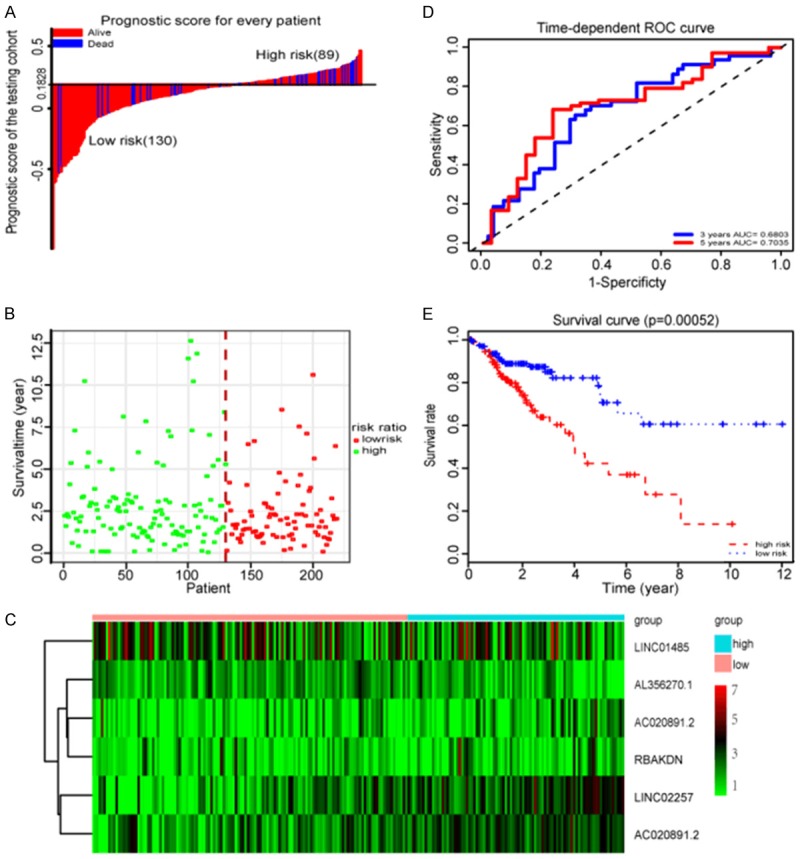
Properties of the testing set prognostic classifier. A. The distribution of risk score of testing cohort. B. Testing cohort survival time and status. C. Heat map of six lncRNAs in testing set. D. Time-dependent ROC curves analysis in the testing set. E. Kaplan-Meier survival analysis in the testing set.
Establishment of a nomogram to predict the OS in CRC
To assess whether the six lncRNA markers represent independent predictors of CRC patients, univariate Cox regression analysis was performed on the training set and testing set, respectively. According to the results from the univariate Cox regression analysis (Table 3), the six lncRNAs signatures based on risk score, pathologic stage (I + II/III + IX), pathologic T (T1-T2/T3-T4), pathologic M (M0/M1) and pathologic N (N0/N1 + N2) were able to effectively predict the prognosis of the CRC patients. Then, using the above factors to perform multivariate Cox regression analysis in the training set, the risk score remained a powerful and independent prognostic factor (P-value < 0.001). Subsequent multivariate Cox regression analysis of the test set also confirmed the above conclusions (P-value = 0.007) (Table 3). We further stratified all the 438 patients (the entire dataset) according to their clinicopathologic risk factors, such as pathologic M, pathologic N and pathologic stage. As shown in Figure 4, K-M survival analysis showed the survival rate of the low-risk group was significantly improved compared with the high-risk group. All these results show that the prognostic value of risk score based on six lncRNAs is not only statistically significant, but also independent of clinicopathologic factors.
Table 3.
Univariate and multivariate Cox regression analysis of entire cohort
| Variable | Univariate analysis | Multivariate analysis | ||
|---|---|---|---|---|
|
|
|
|||
| HR (95% CI) | P value | HR (95% CI) | P value | |
| Training set, n = 219 | ||||
| Age: ≥ 60/< 60 | 0.88 (0.45-1.73) | 0.719 | ||
| Gender: Male/Female | 1.10 (0.59-2.03) | 0.098 | ||
| Stage: I-II/III-IV | 2.79 (1.43-5.44) | 0.002 | 4.10 (1.75-9.97) | 0.018 |
| Tumor: T3-T4/T1-T2 | 3.14 (0.97-8.21) | 0.047 | 1.34 (0.38-4.82) | 0.063 |
| Metastasis: M0/M1 | 3.58 (1.87-6.86) | < 0.001 | 2.23 (1.06-4.73) | 0.035 |
| Node: N0/N1-N2 | 2.49 (1.34-4.66) | 0.004 | 0.43 (0.09-2.06) | 0.055 |
| Risk score: High/Low | 3.42 (1.84-6.40) | < 0.001 | 3.22 (1.62-6.39) | < 0.001 |
| Testing set, n = 219 | ||||
| Age: ≥ 60/< 60 | 1.60 (0.77-3.33) | 0.204 | ||
| Gender: Male/Female | 1.30 (0.73-2.32) | 0.369 | ||
| Stage: I-II/III-IV | 3.75 (2.01-6.99) | < 0.001 | 3.35 (1.94-9.43) | 0.006 |
| Tumor: T3-T4/T1-T2 | 3.02 (0.94-9.77) | 0.044 | 6.80 (0.89-22.13) | 0.065 |
| Metastasis: M0/M1 | 3.38 (1.91-6.00) | < 0.001 | 2.23 (1.14-4.34) | 0.018 |
| Node: N0/N1-N2 | 3.37 (1.86-6.12) | < 0.001 | 0.22 (0.05-0.99) | 0.048 |
| Risk score: High/Low | 2.33 (1.31-4.15) | 0.003 | 2.34 (1.26-4.34) | 0.007 |
HR, hazard ratio; CI, confidential interval.
Figure 4.
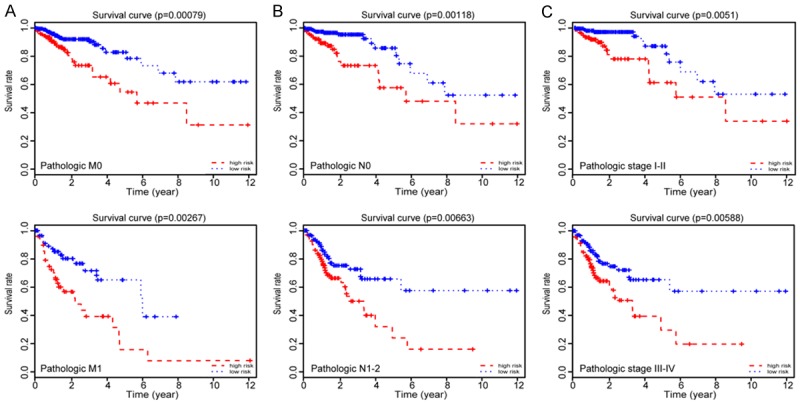
Prognostic values of the six lncRNAs signature in the CRC patients. (A) Kaplan-Meier survival analysis in pathologic M; (B) Kaplan-Meier survival analysis in pathologic N; and (C) Kaplan-Meier survival analysis in pathologic stage according to the six lncRNAs signatures. All analyses are based on six lncRNA signatures.
To further illustrate the effect of the combination of six lncRNAs on forecasting the prognostic outcomes, we constructed a nomogram integrating independent prognostic factors (risk score, pathologic stage, pathologic T, pathologic M, and pathologic N), which were derived from the results of multivariate Cox analysis (Figure 5A). The calibration curve demonstrated consistency between predicted values and observed values in the probabilities of three year OS in the entire dataset (Figure 5B).
Figure 5.
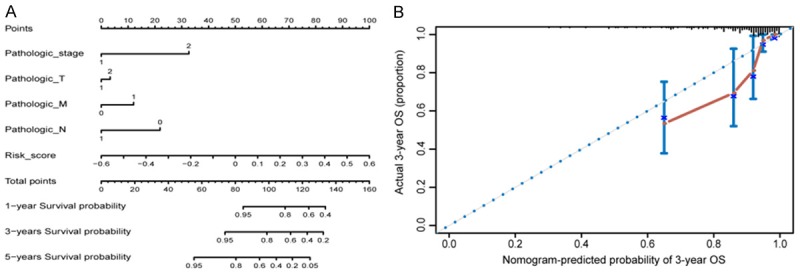
Nomogram to predict the overall survival probability in CRC patients. A. Nomogram for predicting the one, three and five year overall survival probability in CRC. B. Calibration plots of 3-year outcomes in nomogram are close to the real outcome in the entire dataset.
Functional enrichment analysis of the six lncRNAs
To explore the functional significance of the lncRNAs model, we first obtained mRNA expression data from the same patient group of TCGA. According to the threshold criteria of |log2FC| > 1.5 and Q-value < 0.01, 2,083 mRNAs (DEmRNAs) abnormalities were identified and expressed in the CRC tissues compared with the paracancer tissues. A number of mRNAs were upregulated or downregulated > 100-fold (Figure 6A). We performed Pearson correlation analysis on six lncRNAs and DEmRNAs. With absolute correlation coefficient threshold |R| > 0.8 and P < 0.05, 214 related lncRNA-mRNA couplings were found in five lncRNAs and 193 mRNAs, but any mRNA co-expressed with RBAKDN in the LASSO regression model was not found (Figure S1). Finally, we performed GO enrichment analysis and KEGG pathway analysis on these mRNAs. Enrichment analysis demonstrated that they were chiefly enriched in 23 GO terms (Benjamin P-value < 0.01, Figure 6B).
Figure 6.

Bioinformatics analyses of the six lncRNAs. A. Volcano plots showing expression profiles of mRNAs; B. The GO enrichment and KEGG pathway analysis of DE mRNA belonging to the interaction network.
Discussion
Global cancer morbidity and mortality are rapidly increasing [1]. CRC is one of the most common malignancies with varying prognoses and a high mortality. Some studies based on small sample size for high-throughput sequencing or microarray data suggest that dysregulated expression of lncRNAs, such as LINC00460 [18] and H19 [19], contributes to tumorigenesis and progression of CRC. Prognosis predictions are critical to select the appropriate treatment [20] and the relationship between lncRNA, and CRC has received much attention. Some lncRNAs are considered useful prognostic biomarkers for predicting the prognosis of CRC patients. NR_029373 and NR_034119 were identified to be significantly dysregulated in CRC tissues and can be biomarkers for CRC prognosis [21]. LncRNA AK098783 participates in distant metastasis and is significantly associated with poor prognosis in CRC patients [22]. However, the sample size of many previous studies were very small.
In the present study, based on large sample RNA-seq data in the TCGA database, we identified aberrantly expressed 1,176 lncRNAs and 2,083 mRNAs in the CRC tissues compared with the paracancer tissues. We then constructed a new CRC prognostic analysis model consisting of six lncRNAs based on LASSO regression analysis.
To validate the performance of the model, we performed time-dependent ROC analysis for three years and five years in the training set and testing set, respectively. According to the optimal cutoff point of RS, it can successfully divide the CRC patients into high-risk and low-risk groups. The results of K-M survival analysis showed that low-risk groups showed significant advantages in overall survival in the training set. This advantage was further validated in the testing set. The results of these analyses indicated that the risk models based on the six lncRNAs were robust and reliable in predicting the survival of CRC patients.
TMN staging, which can reflect the invasion and metastasis capacity and degree of tumor, has been used to determine the progression and prognosis of colorectal cancer [23]. However, CRC is a highly heterogeneous malignant tumor with a unique genetic and epigenetic background, which also determines the complex clinical biologic behavior and prognosis of CRC [24]. The regression models based on six lncRNAs not only had similar prognostic ability with TNM staging, but also were independent of each other. In addition, K-M survival analysis also showed that CRC patients with the same TNM staging could also be divided into a longer survival group and a shorter survival group by the six lncRNAs regression model (Figure 4). These analyses demonstrate that our model can be used to refine current TNM staging and to improve the accuracy of predicting CRC patients’ prognosis, as well as to bring more personalized treatments to CRC patients. To develop a more sensitive and convenient predictive tool, we combined the six lncRNAs signals with some clinicopathologic data, including TNM staging, to establish the nomogram, which can act as a prognostic factor for CRC patients.
To the best of our knowledge, the biologic functions of these six lncRNAs have not been reported. We performed Pearson correlation analysis between the six lncRNAs and the differently expressed mRNAs which were from the same TCGA patient group. GO enrichment analysis revealed that the mRNAs co-expressed with the six lncRNAs are enriched in 23 GO terms, such as extracellular matrix organization, flavonoid metabolic process, cartilage development, and metabolic processes. We found that the flavonoid metabolic process and metabolic process also were involved in the development of hepatocellular carcinoma [25]. Among KEGG pathways, some were directly linked to cancer pathogenesis, such as retinol metabolism [26], steroid hormone biosynthesis [27] and cytochrome p450 [26]. These results suggest that the six lncRNAs may be involved in CRC initiation and progression through these pathways.
In conclusion, we conducted a comprehensive analysis of lncRNA expression profile and clinical data based on LASSO regression, and established a new six lncRNA model as a prognostic indicator for CRC patients. The predictive model has good repeatability and robustness, and is independent of other clinicopathologic variables. Predictive models of six key lncRNAs can improve survival prediction accuracy in patients with CRC and provide personalized treatment.
Acknowledgements
This work was partly supported by the Shanghai Natural Science Foundation (15ZR1420800 to Sihua Peng) and the Quality Engineering Project of Colleges and Universities in Anhui Province (No. 2015zytz070 and No. 2019rcsfjd088 to Xiao Huang).
Disclosure of conflict of interest
None.
Supporting Information
References
- 1.Bray F, Ferlay J, Soerjomataram I, Siegel RL, Torre LA, Jemal A. Global cancer statistics 2018: GLOBOCAN estimates of incidence and mortality worldwide for 36 cancers in 185 countries. CA Cancer J Clin. 2018;68:394–424. doi: 10.3322/caac.21492. [DOI] [PubMed] [Google Scholar]
- 2.Siegel RL, Miller KD, Fedewa SA, Ahnen DJ, Meester RG, Barzi A, Jemal A. Colorectal cancer statistics, 2017. CA Cancer J Clin. 2017;67:177–193. doi: 10.3322/caac.21395. [DOI] [PubMed] [Google Scholar]
- 3.Marks KM, West NP, Morris E, Quirke P. Clinicopathological, genomic and immunological factors in colorectal cancer prognosis. Br J Surg. 2018;105:e99–e109. doi: 10.1002/bjs.10756. [DOI] [PMC free article] [PubMed] [Google Scholar]
- 4.Hou X, He X, Wang K, Hou N, Fu J, Jia G, Zuo X, Xiong H, Pang M. Genome-wide network-based analysis of colorectal cancer identifies novel prognostic factors and an integrative prognostic index. Cell Physiol Biochem. 2018;49:1703–1716. doi: 10.1159/000493614. [DOI] [PubMed] [Google Scholar]
- 5.Nitsche U, Maak M, Schuster T, Künzli B, Langer R, Slotta-Huspenina J, Janssen KP, Friess H, Rosenberg R. Prediction of prognosis is not improved by the seventh and latest edition of the TNM classification for colorectal cancer in a single-center collective. Ann Surg. 2011;254:793–800. doi: 10.1097/SLA.0b013e3182369101. [DOI] [PubMed] [Google Scholar]
- 6.Li X, Wu Z, Fu X, Han W. Long noncoding RNAs: insights from biological features and functions to diseases. Med Res Rev. 2013;33:517–53. doi: 10.1002/med.21254. [DOI] [PubMed] [Google Scholar]
- 7.Yuan W, Li X, Liu L, Wei C, Sun D, Peng S, Jiang L. Comprehensive analysis of lncRNA-associated ceRNA network in colorectal cancer. Biochem Biophys Res Commun. 2019;508:374–379. doi: 10.1016/j.bbrc.2018.11.151. [DOI] [PubMed] [Google Scholar]
- 8.Yu J, Han Z, Sun Z, Wang Y, Zheng M, Song C. LncRNA SLCO4A1-AS1 facilitates growth and metastasis of colorectal cancer through β-catenin-dependent Wnt pathway. J Exp Clin Cancer Res. 2018;37:222. doi: 10.1186/s13046-018-0896-y. [DOI] [PMC free article] [PubMed] [Google Scholar]
- 9.Li G, Wang C, Wang Y, Xu B, Zhang W. LINC 00312 represses proliferation and metastasis of colorectal cancer cells by regulation of miR-21. J Cell Mol Med. 2018;22:5565–5572. doi: 10.1111/jcmm.13830. [DOI] [PMC free article] [PubMed] [Google Scholar]
- 10.Gu L, Lu L, Zhou D, Liu Z. Long noncoding RNA BCYRN1 promotes the proliferation of colorectal cancer cells via up-regulating NPR3 expression. Cell Physiol Biochem. 2018;48:2337–2349. doi: 10.1159/000492649. [DOI] [PubMed] [Google Scholar]
- 11.Wang X, Zhou J, Xu M, Yan Y, Huang L, Kuang Y, Liu Y, Li P, Zheng W, Liu H, Jia B. A 15-lncRNA signature predicts survival and functions as a ceRNA in patients with colorectal cancer. Cancer Manag Res. 2018;10:5799–5806. doi: 10.2147/CMAR.S178732. [DOI] [PMC free article] [PubMed] [Google Scholar]
- 12.Robinson MD, McCarthy DJ, Smyth GK. edgeR: a Bioconductor package for differential expression analysis of digital gene expression data. Bioinformatics. 2010;26:139–140. doi: 10.1093/bioinformatics/btp616. [DOI] [PMC free article] [PubMed] [Google Scholar]
- 13.Tibshirani R. The lasso method for variable selection in the Cox model. Stat Med. 1997;16:385–395. doi: 10.1002/(sici)1097-0258(19970228)16:4<385::aid-sim380>3.0.co;2-3. [DOI] [PubMed] [Google Scholar]
- 14.Friedman J, Hastie T, Tibshirani R. Regularization paths for generalized linear models via coordinate descent. J Stat Softw. 2010;33:1–22. [PMC free article] [PubMed] [Google Scholar]
- 15.Blanche P, Dartigues JF, Jacqmin-Gadda H. Estimating and comparing time-dependent areas under receiver operating characteristic curves for censored event times with competing risks. Stat Med. 2013;32:5381–97. doi: 10.1002/sim.5958. [DOI] [PubMed] [Google Scholar]
- 16.Helmreich JE. Regression modeling strategies with applications to linear models, logistic and ordinal regression and survival analysis (2nd Edition) J Stat Softw. 2016:70. [Google Scholar]
- 17.Smoot ME, Ono K, Ruscheinski J, Wang PL, Ideker T. Cytoscape 2.8: new features for data integration and network visualization. Bioinformatics. 2010;27:431–432. doi: 10.1093/bioinformatics/btq675. [DOI] [PMC free article] [PubMed] [Google Scholar]
- 18.Lian Y, Yan C, Xu H, Yang J, Yu Y, Zhou J, Shi Y, Ren J, Ji G, Wang K. A novel lncRNA, LINC00460, affects cell proliferation and apoptosis by regulating KLF2 and CUL4A expression in colorectal cancer, molecular therapy. Mol Ther Nucleic Acids. 2018;12:684–697. doi: 10.1016/j.omtn.2018.06.012. [DOI] [PMC free article] [PubMed] [Google Scholar]
- 19.Li S, Hua Y, Jin J, Wang H, Du M, Zhu L, Chu H, Zhang Z, Wang M. Association of genetic variants in lncRNA H19 with risk of colorectal cancer in a Chinese population. Oncotarget. 2016;7:25470. doi: 10.18632/oncotarget.8330. [DOI] [PMC free article] [PubMed] [Google Scholar]
- 20.Cheng P. A prognostic 3-long noncoding RNA signature for patients with gastric cancer. J Cell Biochem. 2018;119:9261–9269. doi: 10.1002/jcb.27195. [DOI] [PubMed] [Google Scholar]
- 21.Wang R, Du L, Yang X, Jiang X, Duan W, Yan S, Xie Y, Zhu Y, Wang Q, Wang L, Yang Y, Wang C. Identification of long noncoding RNAs as potential novel diagnosis and prognosis biomarkers in colorectal cancer. J Cancer Res Clin Oncol. 2016;142:2291–301. doi: 10.1007/s00432-016-2238-9. [DOI] [PubMed] [Google Scholar]
- 22.Wang X, Liu F, Liu X, Wang F, Liao X, Chen Y, Mao Y, Hua D, Ge X. Long non-coding RNA expression profiles reveals AK098783 is a biomarker to predict poor prognosis in patients with colorectal cancer. Jpn J Clin Oncol. 2018;48:480–484. doi: 10.1093/jjco/hyy037. [DOI] [PubMed] [Google Scholar]
- 23.Hyslop T, Weinberg DS, Schulz S, Barkun A, Waldman SA. Analytic lymph node number establishes staging accuracy by occult tumor burden in colorectal cancer. J Surg Oncol. 2012;106:24–30. doi: 10.1002/jso.23051. [DOI] [PMC free article] [PubMed] [Google Scholar]
- 24.Fleming M, Ravula S, Tatishchev SF, Wang HL. Colorectal carcinoma: pathologic aspects. J Gastrointest Oncol. 2012;3:153–173. doi: 10.3978/j.issn.2078-6891.2012.030. [DOI] [PMC free article] [PubMed] [Google Scholar]
- 25.Zhao QJ, Zhang J, Xu L, Liu FF. Identification of a five-long non-coding RNA signature to improve the prognosis prediction for patients with hepatocellular carcinoma. World J Gastroenterol. 2018;24:3426–3439. doi: 10.3748/wjg.v24.i30.3426. [DOI] [PMC free article] [PubMed] [Google Scholar]
- 26.Liang B, Li C, Zhao J. Identification of key pathways and genes in colorectal cancer using bioinformatics analysis. Med Oncol. 2016;33:111. doi: 10.1007/s12032-016-0829-6. [DOI] [PubMed] [Google Scholar]
- 27.Cross HS, Nittke T, Kallay E. Colonic vitamin D metabolism: implications for the pathogenesis of inflammatory bowel disease and colorectal cancer. Mol Cell Endocrinol. 2011;347:70–9. doi: 10.1016/j.mce.2011.07.022. [DOI] [PubMed] [Google Scholar]
Associated Data
This section collects any data citations, data availability statements, or supplementary materials included in this article.


