Abstract
Hepatocellular carcinoma (HCC) is one of the most common internal malignancies worldwide and is associated with a poor prognosis. There is an urgent need to identify diagnostic and prognostic biomarkers of HCC pathogenesis and progression. Accordingly, in this study, we analyzed differentially expressed immune-related genes (IRGs) from 329 patients with HCC from The Cancer Genome Atlas datasets. Functional analysis revealed that the IRGs had potential effects on tumor immune processes, such as inflammatory responses and growth factor activity. In the training group, we constructed a nine-IRG formula to predict prognosis in patients with HCC. To validate the protein and mRNA levels of these IRGs, we used the Human Protein Atlas database and quantitative PCR analysis and found that most protein expression levels matched the corresponding mRNA expression levels. Furthermore, we also validated the prognostic value of the new risk model in another independent cohort (n = 277) from a Gene Expression Omnibus dataset (GSE14520). Our data suggested that there was a significant association between our risk model and patient prognosis. Stratification analysis showed that the nine-IRG signature was significantly associated with overall survival in men. Finally, the signature was found to be correlated with various clinicopathological features. Intriguingly, the prognostic index based on the IRGs reflected infiltration by several types of immune cells. In summary, our data provided evidence that the nine-IRG signature could serve as an independent biomarker to predict prognosis in patients with HCC.
Keywords: Hepatocellular carcinoma, immune-related genes, prognostic signature, risk score, the cancer genome atlas, gene expression omnibus
Introduction
Liver cancer is one of the most common malignancies and is the second leading cause of tumor-related deaths worldwide [1,2]. Hepatocellular carcinoma (HCC) arises from hepatocytes and is the most common type of primary liver cancer. Although historic risk factors for HCC, including chronic hepatitis B virus (HBV), hepatitis C virus, and alcohol consumption, can be addressed through a variety of prevention methods, new etiological factors, such as obesity and type 2 diabetes, have increased the incidence of this disease [3]. Despite improvements in liver transplantation, surgical resection, and molecular-targeted therapy, the prognosis of patients with HCC has remained poor in recent decades [4,5]. Therefore, there is an urgent need to identify diagnostic and prognostic biomarkers in order to improve our understanding of the pathogenesis and progression in HCC.
Tumor cells in the tumor microenvironment can cause downregulation of tumor antigens, induce the expression of other proteins on the cell surface, and promote the release of cytokines that suppress immune responses [6-8]. Tumor-infiltrating immune cells are essential components of the tumor microenvironment and can promote tumor growth, invasion, and metastasis by altering the immune status of tumor cells [9,10]. Studies have shown that intratumoral immune cell infiltrates have prognostic roles in patients with HCC; however, the results are conflicting [11]. In addition, recent breakthroughs in cancer immunotherapy have revolutionized cancer treatment strategies, including treatments used for HCC [12]. Among such therapies, immune checkpoint inhibitors have shown encouraging results as promising treatments for several types of cancer, include melanoma, non-small cell lung cancer, and renal cell carcinoma [13-15]. However, HCC immunotherapy requires long treatment durations, and the efficacy of these therapies is unsatisfactory [16]. Therefore, the development of novel immune checkpoints based on immunogenomic profiles is crucial for the treatment of HCC. With the production of public, large-scale gene expression datasets, researchers are able to identify potential biomarkers for tumor monitoring quickly and accurately [17,18]. Previous studies have explored the prognostic value of immune-related genes (IRGs) to develop individualized immune signatures and thus improve prognostic estimations in patients with nonsquamous non-small cell lung cancer [19]. However, the clinical relevance and prognostic significance of IRGs in HCC have not yet been explored.
Accordingly, in the current study, we aimed to develop a potential immunogenomic prognostic signature for patients with HCC. Our findings are expected to provide insights into the development of potential individualized immunotherapies for HCC.
Materials and methods
Sample data
Transcriptomic and clinical data were downloaded from The Cancer Genome Atlas (TCGA; https://portal.gdc.cancer.gov/) and Gene Expression Omnibus (GEO; https://www.ncbi.nlm.nih.gov/geo/) databases. The RNA-seq data, including 374 HCC samples and 50 control samples, were obtained from TCGA and served as training set for construction of an immunogenomic prognostic signature. GSE14520, including 247 HCC samples, was collected from the GEO and used as a testing set for validation of the signature.
Differentially expressed IRGs
IRGs were obtained from the ImmPort database (https://immport.niaid.nih.gov). Differentially expressed genes (DEGs) from datasets were analyzed using the Limma package (http://bioconductor.org/packages/limma/). Differentially expressed IRGs were intersected from IRGs and DEGs. Genes with an absolute value of log fold change greater than 1.5 and false discovery rate (FDR) value less than 0.05 were considered differentially expressed IRGs. Functional enrichment analysis was performed using DAVID (https://david.ncifcrf.gov) to explore the molecular mechanisms of the identified IRGs. IRG protein levels were analyzed using the Human Protein Atlas (HPA) database (https://www.proteinatlas.org/) to confirm whether mRNA and protein levels matched.
Validation of mRNA levels in vitro
Human normal liver LO2 cell lines were purchased from Bogoo Biotechnology (Shanghai, China). Human hepatoma HepG2 cell lines were obtained from the Shanghai Institutes for Biological Sciences (Shanghai, China). The cells were grown in Dulbecco’s modified Eagle’s medium containing 10% fetal bovine serum and incubated at 37°C in an atmosphere of 5% carbon dioxide in a humidified incubator. The medium was changed every two days.
Total RNA was extracted from the cell lines using TRIzol (Invitrogen, Carlsbad, CA, USA) according to manufacturer’s protocol. cDNA was synthesized based on standard protocols of EasyScript® First-Strand cDNA Synthesis SuperMix (TransGen Biotech, Beijing, China). Quantitative PCR analysis was performed using the Step OneTM Real-Time PCR System (Thermo Fisher Scientific, Rockford, IL, USA). The program was performed as follows: denaturation at 95°C for 15 min, followed by 40 cycles of 10 s at 95°C for annealing, and 32 s at 60°C for extension. The melting curve started at 95°C for 15 s, followed by 60°C for 1 min and ended with 15 s at 95°C. There primers were shown in Table S1. The 2-ΔΔCt method was used for the relative quantification of gene expression levels following the qRT-PCR experiments.
Survival-associated IRGs
Univariate Cox analysis was used to assess the relationships between the identified IRGs and overall survival using the R survival package, and data were visualized using forest plots. Samples with full-time less than 90 days or unavailable data were removed, and 329 samples were finally included in the next analysis. Differentially expressed IRGs with P values of less than 0.001 were screened for subsequent analyses. In addition, genetic alterations in survival-associated IRGs were performed using the cBioPortal for Cancer Genomics (http://www.cbioportal.org) database.
Regulatory features of survival-associated IRGs
Transcription factors (TFs) are important molecules that directly regulate gene expression. TF-related genes were obtained from the Cistrome Cancer database (http://cistrome.org), which is a comprehensive resource for predicted TF targets and enhancer profiles in cancers. Next, differentially expressed regulatory-related genes were intersected from DEGs and visualized as a heatmap. The criteria were set as log fold change greater than 1 and FDR value less than 0.05. Furthermore, correlation analysis between differentially expressed regulatory-related genes and survival-associated IRGs was performed using R software, and a correlation coefficient of more than 0.4 was considered significant. Finally, the regulatory network of survival-associated IRGs and targeted TFs was constructed using Cytoscape (version 3.7.1).
Construction and validation of the immune-based risk signature
IRGs with statistical significance in univariate Cox regression were then selected into the multivariate Cox regression model to obtain Cox coefficients. Risk scores were calculated based on a linear combination of Cox coefficients and gene expression values. Patients were split into high- and low-risk groups based on the median risk score, and survival curves were obtained using R survival and survminer packages. To validate the diagnostic capability of the immune-related risk model, we analyzed the area under the curve (AUC) with R software survival ROC package to evaluate survival differences between high- and low-risk groups. The univariate and multivariate analyses were performed to assess the prognostic efficiency of the immune-related risk model. Moreover, the clinical significance of these identified genes was evaluated.
Clinical utility of the immune-based risk signature
Correlation analyses between identified IRGs or risk scores and clinicopathological features, including age, sex, pathological stage, and TNM status, were performed and visualized as bee swarm plots. Immune infiltration data for patients were downloaded from the Tumor Immune Estimation Resource database (https://cistrome.shinyapps.io/timer/), which analyzes and visualizes the levels of tumor-infiltrating immune cells, including B cells, CD4+ T cells, CD8+ T cells, macrophages, neutrophils, and dendritic cells. Additionally, the relationships between immune cell infiltration and risk score were evaluated in tumor samples.
Results
Identification of differentially expressed IRGs
First, 3689 DEGs, including 3521 upregulated and 168 downregulated genes, were identified, as shown in Figure 1A and 1C. From the identified gene set, 188 differentially expressed IRGs, including 154 upregulated and 34 downregulated genes, were screened (Figure 1B and 1D). Functional analysis showed that these differentially expressed IRGs were mostly enriched in inflammatory response, extracellular region, growth factor activity, and cytokine-cytokine receptor interactions in terms of gene ontology (Figure 1E-G) and Kyoto Encyclopedia of Genes and Genomes (KEGG) pathways (Figure 1H).
Figure 1.
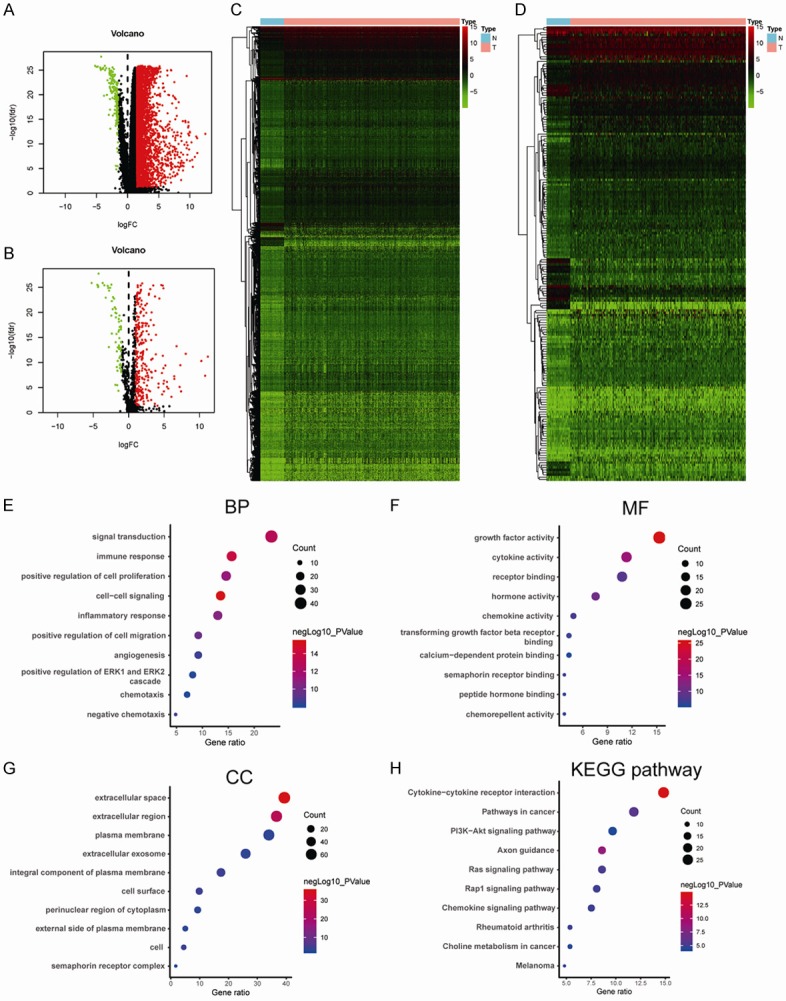
Differentially expressed genes between tumor and normal tissues and functional enrichment analysis of differentially expressed IRGs. A. Volcano plot of differentially expressed genes in HCC samples. B. Volcano plot of differentially expressed IRGs in HCC samples. C. Heatmap of differentially expressed genes between HCC and nontumor tissues. D. Heatmap of differentially expressed IRGs between HCC and nontumor tissues. E. Significantly enriched gene ontology (GO) terms of differentially expressed IRGs based on biological processes. F. Significantly enriched GO terms of differentially expressed IRGs based on cellular components. G. Significantly enriched GO terms of differentially expressed IRGs based on molecular functions. H. Significantly enriched KEGG pathways of differentially expressed IRGs. IRGs, immune-related genes, GO, gene ontology; KEGG, Kyoto Encyclopedia of Genes and Genomes.
Identification of survival-associated IRGs
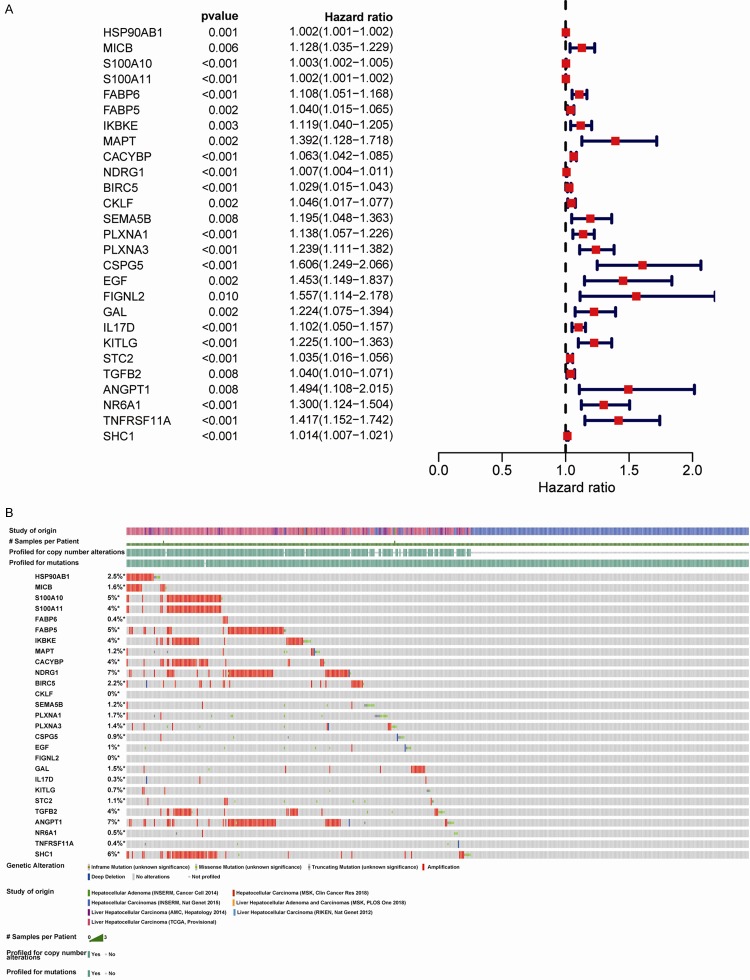
To establish prognostic biomarkers at the molecular level, we explored the IRGs associated with survival in HCC samples. Forest plot analysis showed that 27 IRGs were significantly correlated with overall survival and that most of these genes were risk factors (Figure 2A). Additionally, the percentages of genetic alterations ranged from 0-7% in HCC, mostly including amplification, missense mutations, and deep deletions (Figure 2B).
Figure 2.
Identification of survival-related differentially expressed IRGs by univariate Cox regression analysis. A. Forest plot of hazard ratios showing survival-related IRGs. B. Genetic alterations in survival-related IRGs. IRGs, immune-related genes.
Construction of a regulatory network
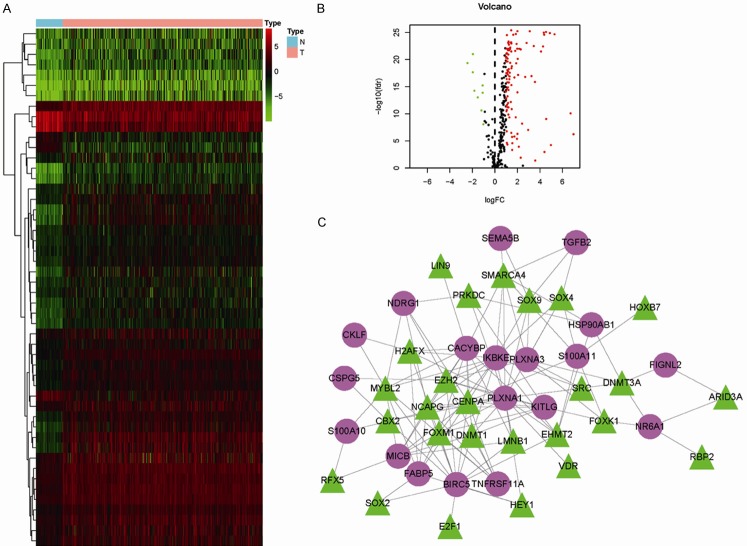
To explore the regulatory mechanisms of the identified survival-associated IRGs at the transcriptional level, 50 differentially expressed regulatory-related genes were identified between HCC and control samples from the Cistrome database (Figure 3A and 3B). Among these genes, 26 potential TFs were related to the 19 survival-associated IRGs in patients with HCC. Moreover, the identified TFs positively regulated the 19 IRGs in the regulatory network (Figure 3C).
Figure 3.
Transcription factor (TF)-mediated regulatory network. A. Heatmap of differentially expressed TFs in HCC samples. B. Volcano plot of differentially expressed TFs. C. Regulatory network constructed based on clinically relevant TFs (green) and IRGs (purple). IRGs, immune-related genes; TFs, transcription factors.
Development and validation of the immune-based risk signature
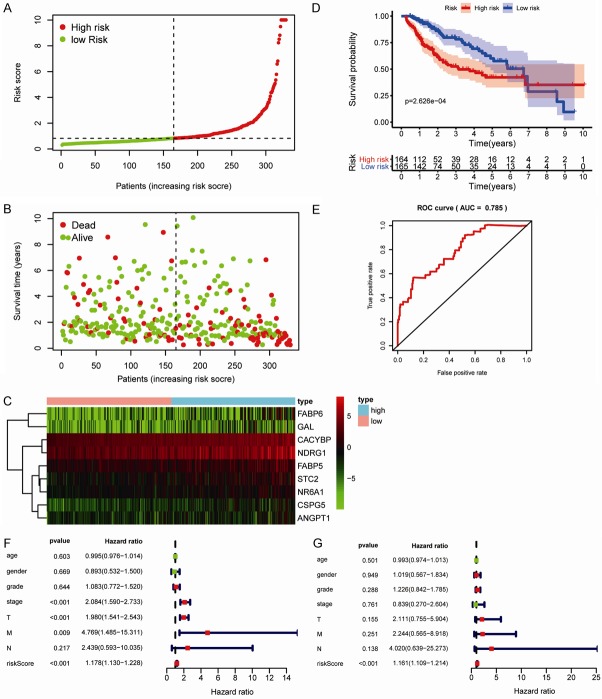
To evaluate survival rates in patients with HCC, we constructed an immune-based risk signature according to the multivariate Cox regression results. Risk scores were calculated as follows: ([FABP6] × 0.11) + ([-FABP5] × 0.04) + ([CACYBP] × 0.07) + ([NDRG1] × 0.01) + ([CSPG5] × 0.27) + ([GAL] × 0.20) + ([STC2] × 0.03) + ([ANGPT1] × 0.36) + ([NR6A1] × 0.15). The general characteristics of the IRGs included in the risk model are presented in Table 1. This immune-based prognostic signature could be a predictive tool for patients with HCC based on discrete clinical parameters. Figure 4A-C shows the risk score distribution, vital status of patients in the high- and low-risk groups, and heatmap of the 10 IRG expression profiles. The associations between the nine-IRG signature and OS in the discovery group are presented in Figure 4D. The AUC of the ROC curve was 0.785 (Figure 4E), suggesting the good capability of this signature for HCC-specific survival. Univariate and multivariate Cox regression analyses suggested that the signature could serve as an independent predictor after adjustment of other clinicopathological features, such as age, sex, grade, and TNM stage (Figure 4F and 4G).
Table 1.
General characteristics of the IRGs in the survival-predictor model
| Gene | Differential expression | Multivariate analysis | |||||
|---|---|---|---|---|---|---|---|
|
|
|
||||||
| logFC | p-Value | FDR | Coefficient | HR | 95% CI | p-Value | |
| ANGPT1 | 1.55 | 3.95e-08 | 6.91e-08 | 0.36 | 1.44 | 1.05-1.98 | 2.48e-02 |
| CACYBP | 1.75 | 6.00e-27 | 3.02e-25 | 0.07 | 1.07 | 1.04-1.09 | 1.18e-07 |
| CSPG5 | 3.25 | 1.30e-21 | 1.01e-20 | 0.27 | 1.31 | 0.99-1.73 | 5.51e-02 |
| FABP5 | 2.39 | 2.91e-19 | 1.50e-18 | -0.04 | 0.96 | 0.92-1.00 | 3.06e-02 |
| FABP6 | 5.42 | 4.64e-06 | 6.99e-06 | 0.11 | 1.11 | 1.04-1.19 | 1.47e-03 |
| GAL | 3.71 | 1.52e-02 | 1.76e-02 | 0.20 | 1.22 | 1.07-1.39 | 3.29e-03 |
| NDRG1 | 1.90 | 7.08e-12 | 1.66e-11 | 0.01 | 1.01 | 1.00-1.01 | 7.66e-04 |
| NR6A1 | 1.98 | 1.80e-22 | 1.66e-21 | 0.15 | 1.16 | 0.99-1.37 | 6.64e-02 |
| STC2 | 2.83 | 1.14e-18 | 5.37e-18 | 0.03 | 1.03 | 1.00-1.05 | 2.07e-02 |
Figure 4.
Construction of the immune-based prognostic risk signature in the training group. A. The nine IRG-based risk score distribution. B. The nine IRG-based risk score distribution for patient survival status. C. Heatmap of the nine-IRG expression profiles in the high- and low-risk subgroups for the training set. D. Kaplan-Meier analysis of overall survival in the high-risk (n = 164) and low-risk (n = 165) subgroups in the training set. E. Time-independent receiver operating characteristic (ROC) analysis of risk scores for prediction the overall survival in the training set. F. Univariate Cox regression analysis of discrete clinical factors. G. Multivariate Cox regression analysis of discrete clinical factors.
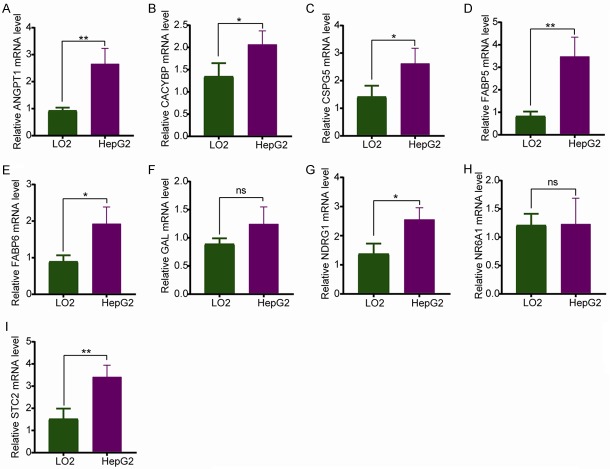
To validate the IRGs in this model, the protein expression levels were analyzed using the HPA database. The results showed that FABP6, FABP5, CACYBP, NDRG1, CSPG5, GAL, STC2, and ANGPT1 protein levels matched their mRNA expression levels. However, representative images of the NR6A1 protein levels were not available in the HPA database (Figure 5). We also performed real-time quantitative PCR to validate the mRNA level in vitro (Figure 6). The mRNA levels of most of the nine IRGs in tumor cells were consistent with the data in TCGA.
Figure 5.
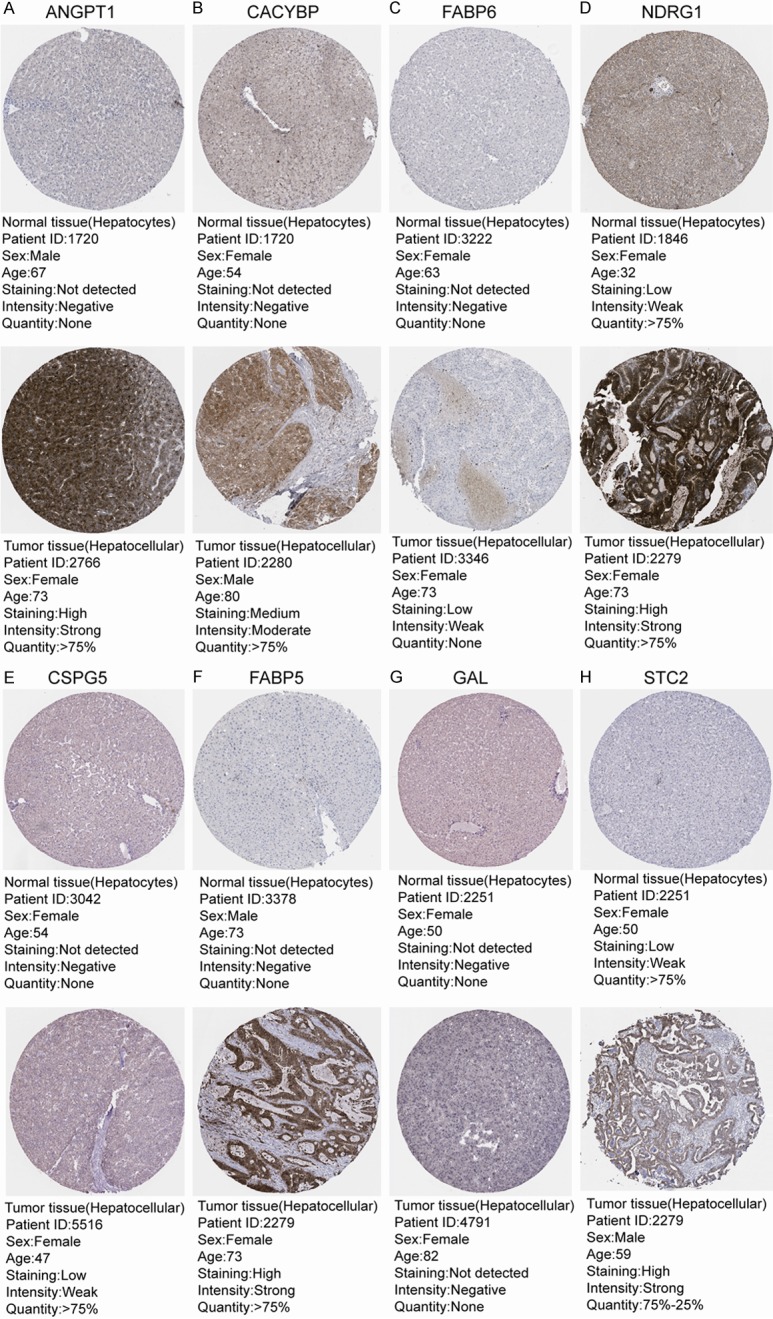
Validation of IRGs at the protein level using the Human Protein Atlas database (NR6A1 data were not available). Representative images of (A) ANGPT1, (B) CACYBP, (C) FABP6, (D) NDRG1, (E) CSPG5, (F) FABP5, (G) GAL, and (H) STC2.
Figure 6.
Validation of IRGs at the mRNA level in vitro using Real-Time qPCR Analysis. (A) ANGPT1, (B) CACYBP, (C) CSPG5, (D) FABP5, (E) FABP6, (F) GAL, (G) NDRG1, (H) NR6A1, and (I) STC2. The data are expressed as the mean ± SD of three independent experiments (*P<0.05 vs. LO2 group, **P<0.05 vs. LO2 group, and ns: no significance).
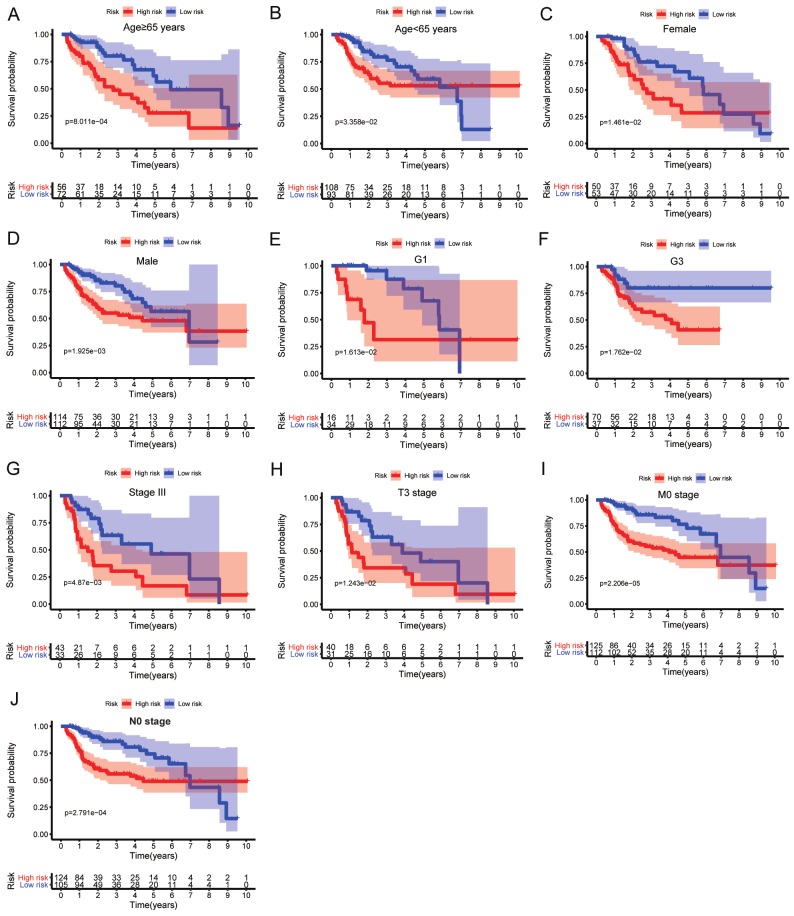
Stratification analysis based on clinical characteristics was performed, and the associations between the nine-IRG profile and OS in patients with HCC in the training cohort were analyzed (Table 2 and Figure 7).
Table 2.
The association between nine-IRGs signature and overall survival of HCC patients in training group (n = 329)
| Characteristics | Number (high/low) | Percentage (%) | P-value (OS) |
|---|---|---|---|
| Age (years) | |||
| ≥65 | 56/72 | 38.9% | 8.011e-04 |
| <65 | 108/93 | 61.1% | 3.358e-02 |
| Gender | |||
| Female | 50/53 | 31.3% | 1.461e-02 |
| Male | 114/112 | 68.7% | 1.925e-03 |
| Histologic grade | |||
| G1 | 16/34 | 15.2% | 1.613e-02 |
| G2 | 68/87 | 47.1% | 8.381e-02 |
| G3 | 70/37 | 32.5% | 1.762e-02 |
| G4 | 9/3 | 3.6% | 7.629e-01 |
| NA | 1/4 | 1.5% | - |
| Stage | |||
| I | 66/89 | 47.1% | 1.734e-01 |
| II | 42/32 | 22.5% | 2.074e-01 |
| III | 43/33 | 23.1% | 4.87e-03 |
| IV | 2/1 | 0.9% | - |
| NA | 11/10 | 6.4% | - |
| T stage | |||
| T1 | 69/93 | 48.9% | 1.431e-01 |
| T2 | 47/34 | 24.6% | 8.991e-02 |
| T3 | 40/31 | 21.6% | 1.243e-02 |
| T4 | 8/4 | 3.6% | 6.76e-01 |
| NA | 0/3 | 0.9% | - |
| M stage | |||
| M0 | 125/112 | 72.0% | 2.206e-05 |
| M1 | 2/1 | 0.9% | - |
| NA | 37/52 | 27.1% | - |
| N stage | |||
| N0 | 124/105 | 69.6% | 2.791e-04 |
| N1 | 2/1 | 2.7% | - |
| NA | 38/59 | 29.5% | - |
| Vital status | |||
| Living | 97/124 | 67.2% | - |
| Deceased | 67/41 | 32.8% | - |
Figure 7.
Stratification analysis of the associations between the nine-IRG signature and overall survival in patients with HCC in the training group. (A) Age ≥ 65 years, (B) age < 65 years, (C) female sex, (D) male sex, (E) G1, (F) G3, (G) stage III, (H) T3 stage, (I) M0 stage, and (J) N0 stage.
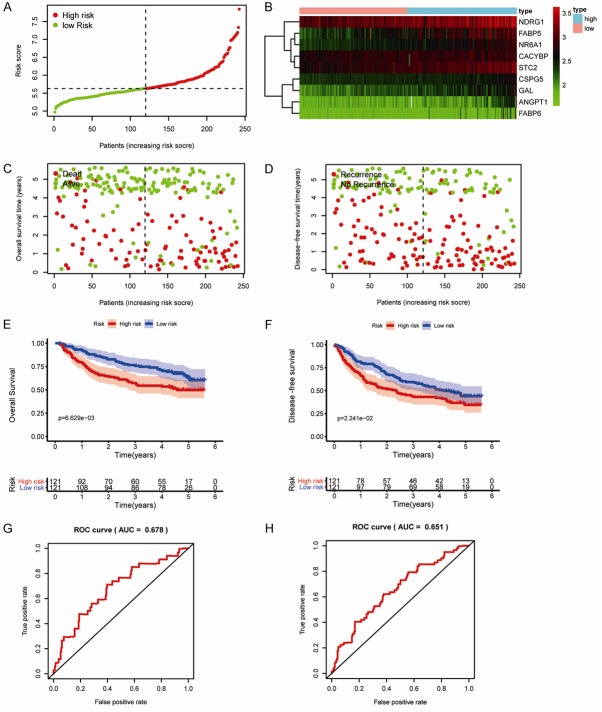
We employed a validation group containing 247 HCC samples to validate this signature using OS and disease-free survival. As expected, this signature significantly distinguished patients into low- and high-risk groups in the testing cohort, as demonstrated by the ROC curve value of 0.678 for OS and 0.651 for disease-free survival. Moreover, patients in the high-risk group had poorer OS and disease-free survival than those in the low-risk group (Figure 8). These results suggested that the immune-based risk signature was a reliable predictive model. To validate the immune-based risk signature in patients with various clinical features, we performed subgroup analyses for OS and disease-free survival according to sex, age, HBV viral status, alanine aminotransferase (ALT) levels, primary tumor size, multinodular status, cirrhosis, TNM stage, and alpha-fetoprotein levels in the testing cohort. Table 3 showed the association between the nine-IRG signature and prognosis in patients with HCC.
Figure 8.
Prognostic value of the nine-IRG signature in an independent validation group from GEO datasets. A. The nine IRG-based risk score distribution. B. Heatmap of the nine-IRG expression profiles in the high- and low-risk subgroups for the testing set. C. Survival status of patients in the low- and high-risk groups. D. Recurrence status of patients in the low- and high-risk groups. E. Kaplan-Meier analysis of overall survival in the high-risk (n = 121) and low-risk (n = 121) subgroups in the testing set. F. Kaplan-Meier analysis of disease-free survival in the high-risk (n = 121) and low-risk (n = 121) subgroups of the testing set. G. Time-independent receiver operating characteristic (ROC) analysis of the risk score for prediction of overall survival in the testing set. H. Time-independent ROC analysis of the risk score for prediction of disease-free survival in the testing set.
Table 3.
The association between nine-IRGs signature and survival (OS and DFS) of HCC patients in testing group (n = 247)
| Characteristics | Number (high/low) | Percentage (%) | P-value (OS) | P-value (DFS) |
|---|---|---|---|---|
| Age (years) | ||||
| ≥65 | 15/15 | 12.1% | 2.165e-02 | 3.33e-03 |
| <65 | 106/106 | 85.8% | 3.009e-02 | 2.067e-01 |
| Gender | ||||
| Female | 14/17 | 12.6% | 1.513e-01 | 1.257e-01 |
| Male | 107/104 | 85.4% | 1.395e-02 | 7.198e-02 |
| HBV viral status | ||||
| CC | 76/84 | 64.8% | 1.17e-01 | 1.769e-01 |
| AVR-CC | 28/30 | 23.5% | 7.059e-02 | 3.044e-01 |
| ALT | ||||
| ≤50 U/L | 69/73 | 57.5% | 7.015e-04 | 3.548e-02 |
| >50 U/L | 51/48 | 40.1% | 6.808e-01 | 3.445e-01 |
| AFP | ||||
| ≤300 (ng/ml) | 48/80 | 51.8% | 3.664e-02 | 6.445e-02 |
| >300 (ng/ml) | 72/38 | 44.5% | 3.743e-01 | 6.263e-01 |
| Main Tumor Size | ||||
| ≤5 cm | 71/82 | 61.9% | 3.247e-02 | 8.613e-02 |
| >5 cm | 50/38 | 35.6% | 1.858e-01 | 2.633e-01 |
| Multinodular | ||||
| Yes | 26/26 | 21.1% | 8.189e-02 | 1.813e-01 |
| No | 95/95 | 76.9% | 1.155e-02 | 5.028e-02 |
| Cirrhosis | ||||
| Yes | 111/112 | 90.3% | 2.391e-03 | 2.297e-02 |
| No | 10/9 | 7.7% | 9.668e-01 | 5.306e-01 |
| TNM staging | ||||
| I | 42/54 | 38.9% | 5.259e-01 | 2.938e-01 |
| II | 36/42 | 31.6% | 3.382e-02 | 1.39e-01 |
| III | 30/21 | 20.6% | 4.476e-01 | 7.931e-01 |
| BCLC staging | ||||
| 0 | 10/10 | 8.1% | 1.537e-1 | 7.562e-01 |
| A | 67/85 | 61.5% | 8.677e-02 | 8.095e-02 |
| B | 12/12 | 9.7% | 5.505e-01 | 7.972e-01 |
| C | 19/10 | 11.7% | 2.859e-01 | 4.611e-01 |
| CLIP staging | ||||
| 0 | 37/61 | 39.7% | 1.81e-01 | 1.601e-01 |
| 1 | 42/37 | 32.0% | 2.152e-01 | 6.585e-01 |
| 2 | 20/15 | 14.2% | 6.224e-01 | 5.468e-01 |
| 3-5 | 9/4 | 5.3% | 5.629e-01 | 4.577e-01 |
Clinical value of the immune-based risk signature
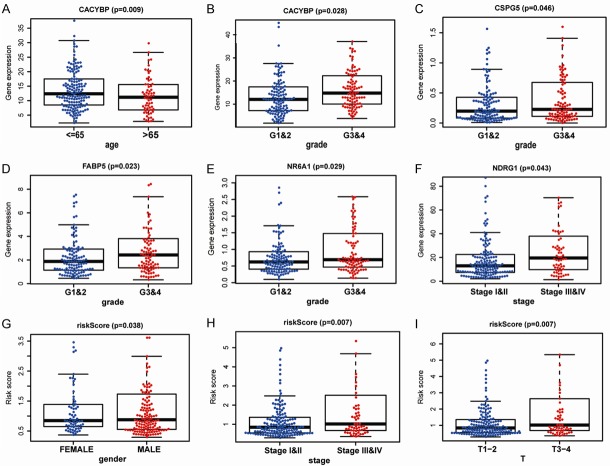
The clinical significance of the identified genes was evaluated, and the results demonstrated that CACYBP, CSPG5, FABP5, NR6A1, and NDRG1 were differentially expressed in patients with various clinical features (Figure 9A-F). To validate the clinical value of the immune-based risk signature, we assessed the association between the risk score and clinicopathological features. The results showed that high risk scores were positively correlated with male sex, advanced tumor stage, and later T stage in patients with HCC (Figure 9G-I).
Figure 9.
Relationships between the expression of immune-related genes and clinicopathological factors in patients with hepatocellular carcinoma. (A) CACYBP expression and age; (B) CACYBP expression and grade; (C) CSPG5 expression and grade; (D) FABP5 expression and grade; (E) NR6A1 expression and grade; (F) NDRG1 expression and tumor stage; (G) Risk scores and sex; (H) Risk scores and tumor stage; and (I) Risk scores and T stage.
In addition, to explore the tumor immune microenvironment, correlations between risk score and immune cell infiltration, including B cells, CD4+ T cells, CD8+ T cells, neutrophils, macrophages, and dendritic cells, were analyzed. The results indicated that the risk score was significantly positively correlated with infiltration of macrophages (P = 0.020) and neutrophils (P = 0.001; Figure 10).
Figure 10.
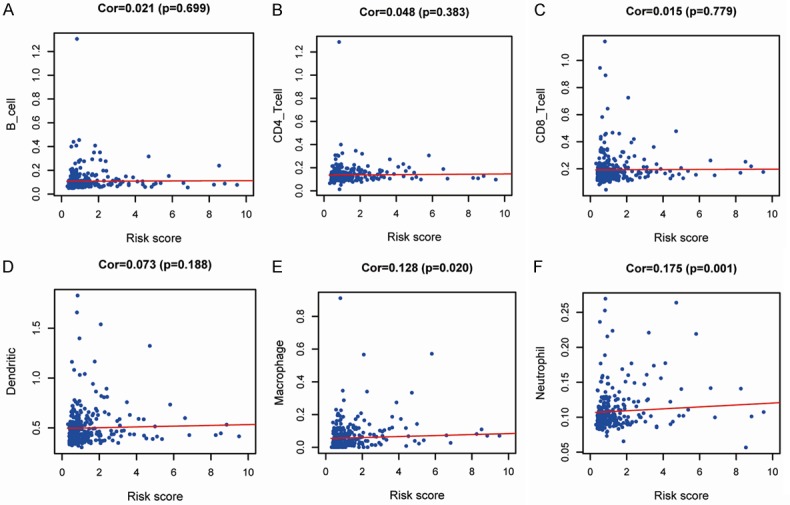
Relationships between immune-related prognostic indices and infiltration abundances of six types of immune cells. The correlations were performed using Pearson correlation analysis. (A) B cells, (B) CD4+ T cells, (C) CD8+ T cells, (D) dendritic cells, (E) macrophages, and (F) neutrophils.
Discussion
Accumulating evidence has demonstrated that immune cell infiltration and immune-related genes play crucial roles in carcinogenesis and tumor progression [20,21]. Owing to the limitations of the TNM staging system and other scoring systems, novel molecular biomarkers to predict survival in patients with HCC are urgently needed [22]. Previous studies have assessed the prognostic value of various tumor-infiltrating immune cells in HCC [23]. In the current study, we constructed and validated an IRG-based risk signature in HCC. To the best of our knowledge, this is the first study utilizing an analysis of the immunogenomic landscape to explore prognostic biomarkers for patients with HCC.
Acquisition of invasive traits in cancer cells depends upon a succession of alterations to the genome. We focused our investigation on alterations to immunogenomic profiles to uncover relationships between these profiles and the immune microenvironment. Different levels of alterations were observed in survival-associated IRGs in HCC, and these changes may directly affect HCC prognosis. To further investigate the potential molecular mechanisms of the differentially expressed IRGs in HCC, functional enrichment analysis was performed. The results showed that these genes were mainly enriched in tumor-related functions and pathways, such as cell-cell signaling, extracellular space, growth factor activity, and cytokine-cytokine receptor interactions.
To determine the regulatory mechanisms of the identified survival-associated IRGs at the transcriptional level, we constructed a regulatory network based on chromatin immunoprecipitation-sequencing. Finally, 19 IRGs, including FIGNL2, NR6A1, BIRC5, PLXNA1, CSPG5, MICB, S100A10, S100A11, FABP5, IKBKE, CACYBP, NDRG1, KITLG, TNFRSF11A, HSP90AB1, PLXNA3, CKLF, SEMA5B, and TGFB2, were featured prominently in this network. These results would be helpful to elucidate the precise mechanisms of IRGs in HCC. However, further studies are needed to elucidate the detailed molecular mechanisms.
By integrating transcriptional profile analyses, we established a total of nine IRGs that were related to survival in HCC, including FABP6, FABP5, CACYBP, NDRG1, CSPG5, GAL, STC2, ANGPT1, and NR6A1. Several of these identified IRGs, i.e., FABP6, CACYBP, CSPG5, and NR6A1, were reported for the first time in liver cancer. We also validated the protein and mRNA levels of the IRGs using the HPA database and real-time quantitative PCR, and confirmed that the expression levels most of the IRGs matched at the mRNA and protein levels. However, the expression of GAL protein was not completely consistent with the expression of GAL mRNA. This may be due to the weak protein expression in HCC, leading to its poor detection by immunohistochemical staining. In addition, we did not find any significant difference between the GAL and NR6A1 mRNA levels in normal and tumor cells. This could be because of the differences observed in vivo and in vitro. Thus, more sensitive detection methods should be performed in the future.
Previous studies have demonstrated that FABP6 mRNA (encoding fatty acid binding protein 6) showed higher expression in malignant cell lines than in benign cells and that FABP6 expression was significantly related to survival in prostate cancer [24]. Cal cyclin-binding protein (CACYBP) plays crucial roles in cell proliferation, cytoskeletal rearrangement, and transcriptional regulation [25,26] and has been shown to be involved in various cancers, although its effects vary [27]. Indeed, CACYBP functions as a tumor suppressor in gastric cancer, renal cancer, and astrocytoma, but as an oncogene in pancreatic cancer, colorectal cancer, and glioma. Our results indicated that CACYBP may be a tumor-promoting gene in HCC. Chondroitin sulfate proteoglycan 5 (CSPG5) is a neural chondroitin sulfate-containing and epidermal growth factor domain-containing transmembrane protein implicated in synaptic maturation [28]; however, its molecular mechanisms in cancers have not been explored. NR6A1 (encoding nuclear receptor sub-family 6, group A, member 1) may play an oncogenic role in cancer initiation and progression. Indeed, Zheng et al. reported that NR6A1 could have applications as a novel prognostic biomarker for prostatic cancer treatment [29]. Based on limited correlational studies, the exact roles and mechanisms of these four identified IRGs in HCC should be evaluated in further studies. Among these nine IRGs, ANGPT1 (encoding angiopoietin-1) showed the maximum positive risk coefficient (0.36). ANGPT1, a growth factor, is involved in tumor angiogenesis, functioning to activate angiogenesis and promote tumor growth and metastasis by regulating the proliferation and migration of endothelial cells in tumor tissues [30,31]. Lin et al. reported that the expression of ANGPT1 in HCC tissues was significantly higher compared with that in tumor-adjacent and normal liver tissues [32]. Tripura et al. reported that increased ANGPT1 expression may play a critical role in vascular development in HCC [33]. These results suggested that ANGPT1 is important for microvessel formation in HCC, consistent with our results.
Stratification analysis based on clinical characteristics was performed in both the training and testing groups. After analyzing the prognostic values of different clinicopathological features, we found that the nine-IRG signature was significantly associated with OS in men. However, some important variables (such as HBV viral status, ALT, and tumor size) were not available in TCGA database, and we were unable to compare the impact of these factors. Another important finding in this study was that the risk score was positively correlated with the infiltration of macrophages and neutrophils. Recent evidence suggested that inflammation is closely related to carcinogenesis. Macrophages, as pivotal mediators of the inflammatory response, are involved in both innate host defense and the adaptive immune response and have attracted considerable attention in cancer research [34]. Macrophages are the predominant cell type infiltrating the tumor mass [35]. However, the relationships between macrophages and HCC are still unclear. Additionally, neutrophils have recently been shown to have applications in predicting the prognosis of HCC with combined with lymphocytes, e.g., the neutrophil-to-lymphocyte ratio [36]. Moreover, our analysis also indicated that the risk score was positively correlated with female sex, advanced tumor stage, and later T stage. These results could provide useful information for the clinical application of this signature.
The signature was significantly superior to the traditional TNM stage method for predicting OS and disease-free survival in patients with HCC. The AUC value of the 10 IRG-based prognostic model was 0.785 in the training group, indicating favorable discrimination performance. Application of this prognostic signature in clinical practice could facilitate the identification of patients at high risk of cancer-related death before treatment and could necessitate the recommendation of more aggressive therapeutic strategies with dynamic surveillance. However, there are some limitations to our study. First, TCGA database lacks some important postoperative variables; thus, we could not carry out a comprehensive analysis. Second, experimental studies should be conducted in order to explore the molecular mechanisms of the nine IRGs in HCC. Third, whether the prognostic signature can be applied to patients must be confirmed in larger groups of patients with HCC.
Conclusion
In summary, we constructed a risk-score model derived from nine IRGs to predict the survival of patients with HCC. This immunogenomic signature could be a reliable prognostic tool for patients with HCC and provided insights into potential individualized immunotherapies. Large-scale, well-controlled cohorts are required to evaluate the therapeutic strategies of the immunogenomic signature.
Acknowledgements
This work was supported by the National Natural Science Foundation of China (grant nos. 81860409 and 81660382), and Graduate Students Innovation Fund Project in Jiangxi Province (No. YC2019-B036).
Disclosure of conflict of interest
None.
Supporting Information
References
- 1.Akinyemiju T, Abera S, Ahmed M, Alam N, Alemayohu MA, Allen C, Al-Raddadi R, Alvis-Guzman N, Amoako Y, Artaman A, Ayele TA, Barac A, Bensenor I, Berhane A, Bhutta Z, Castillo-Rivas J, Chitheer A, Choi JY, Cowie B, Dandona L, Dandona R, Dey S, Dicker D, Phuc H, Ekwueme DU, Zaki MS, Fischer F, Furst T, Hancock J, Hay SI, Hotez P, Jee SH, Kasaeian A, Khader Y, Khang YH, Kumar A, Kutz M, Larson H, Lopez A, Lunevicius R, Malekzadeh R, McAlinden C, Meier T, Mendoza W, Mokdad A, Moradi-Lakeh M, Nagel G, Nguyen Q, Nguyen G, Ogbo F, Patton G, Pereira DM, Pourmalek F, Qorbani M, Radfar A, Roshandel G, Salomon JA, Sanabria J, Sartorius B, Satpathy M, Sawhney M, Sepanlou S, Shackelford K, Shore H, Sun J, Mengistu DT, Topor-Madry R, Tran B, Ukwaja KN, Vlassov V, Vollset SE, Vos T, Wakayo T, Weiderpass E, Werdecker A, Yonemoto N, Younis M, Yu C, Zaidi Z, Zhu L, Murray CJL, Naghavi M, Fitzmaurice C. The burden of primary liver cancer and underlying etiologies from 1990 to 2015 at the global, regional, and national level: results from the global burden of disease study 2015. JAMA Oncol. 2017;3:1683–1691. doi: 10.1001/jamaoncol.2017.3055. [DOI] [PMC free article] [PubMed] [Google Scholar]
- 2.EASL clinical practice guidelines: management of hepatocellular carcinoma. J Hepatol. 2018;69:182–236. doi: 10.1016/j.jhep.2018.03.019. [DOI] [PubMed] [Google Scholar]
- 3.El-Serag HB, Kanwal F. Epidemiology of hepatocellular carcinoma in the United States: where are we? Where do we go? Hepatology. 2014;60:1767–1775. doi: 10.1002/hep.27222. [DOI] [PMC free article] [PubMed] [Google Scholar]
- 4.Waghray A, Murali AR, Menon KN. Hepatocellular carcinoma: from diagnosis to treatment. World J Hepatol. 2015;7:1020–1029. doi: 10.4254/wjh.v7.i8.1020. [DOI] [PMC free article] [PubMed] [Google Scholar]
- 5.Bodzin AS, Busuttil RW. Hepatocellular carcinoma: advances in diagnosis, management, and long term outcome. World J Hepatol. 2015;7:1157–1167. doi: 10.4254/wjh.v7.i9.1157. [DOI] [PMC free article] [PubMed] [Google Scholar]
- 6.Garcia-Lora A, Algarra I, Garrido F. MHC class I antigens, immune surveillance, and tumor immune escape. J Cell Physiol. 2003;195:346–355. doi: 10.1002/jcp.10290. [DOI] [PubMed] [Google Scholar]
- 7.Sheu J, Shih Ie M. HLA-G and immune evasion in cancer cells. J Formos Med Assoc. 2010;109:248–257. doi: 10.1016/S0929-6646(10)60050-2. [DOI] [PubMed] [Google Scholar]
- 8.Teicher BA. Transforming growth factor-beta and the immune response to malignant disease. Clin Cancer Res. 2007;13:6247–6251. doi: 10.1158/1078-0432.CCR-07-1654. [DOI] [PubMed] [Google Scholar]
- 9.Pages F, Galon J, Dieu-Nosjean MC, Tartour E, Sautes-Fridman C, Fridman WH. Immune infiltration in human tumors: a prognostic factor that should not be ignored. Oncogene. 2010;29:1093–1102. doi: 10.1038/onc.2009.416. [DOI] [PubMed] [Google Scholar]
- 10.Domingues P, Gonzalez-Tablas M, Otero A, Pascual D, Miranda D, Ruiz L, Sousa P, Ciudad J, Goncalves JM, Lopes MC, Orfao A, Tabernero MD. Tumor infiltrating immune cells in gliomas and meningiomas. Brain Behav Immun. 2016;53:1–15. doi: 10.1016/j.bbi.2015.07.019. [DOI] [PubMed] [Google Scholar]
- 11.Cariani E, Missale G. Immune landscape of hepatocellular carcinoma microenvironment: Implications for prognosis and therapeutic applications. Liver Int. 2019;39:1608–1621. doi: 10.1111/liv.14192. [DOI] [PubMed] [Google Scholar]
- 12.Chen J, Jiang CC, Jin L, Zhang XD. Regulation of PD-L1: a novel role of pro-survival signalling in cancer. Ann Oncol. 2016;27:409–416. doi: 10.1093/annonc/mdv615. [DOI] [PubMed] [Google Scholar]
- 13.Hodi FS, O’Day SJ, McDermott DF, Weber RW, Sosman JA, Haanen JB, Gonzalez R, Robert C, Schadendorf D, Hassel JC, Akerley W, van den Eertwegh AJ, Lutzky J, Lorigan P, Vaubel JM, Linette GP, Hogg D, Ottensmeier CH, Lebbe C, Peschel C, Quirt I, Clark JI, Wolchok JD, Weber JS, Tian J, Yellin MJ, Nichol GM, Hoos A, Urba WJ. Improved survival with ipilimumab in patients with metastatic melanoma. N Engl J Med. 2010;363:711–723. doi: 10.1056/NEJMoa1003466. [DOI] [PMC free article] [PubMed] [Google Scholar]
- 14.Brahmer J, Reckamp KL, Baas P, Crino L, Eberhardt WE, Poddubskaya E, Antonia S, Pluzanski A, Vokes EE, Holgado E, Waterhouse D, Ready N, Gainor J, Aren Frontera O, Havel L, Steins M, Garassino MC, Aerts JG, Domine M, Paz-Ares L, Reck M, Baudelet C, Harbison CT, Lestini B, Spigel DR. Nivolumab versus docetaxel in advanced squamous-cell non-small-cell lung cancer. N Engl J Med. 2015;373:123–135. doi: 10.1056/NEJMoa1504627. [DOI] [PMC free article] [PubMed] [Google Scholar]
- 15.McDermott DF, Drake CG, Sznol M, Choueiri TK, Powderly JD, Smith DC, Brahmer JR, Carvajal RD, Hammers HJ, Puzanov I, Hodi FS, Kluger HM, Topalian SL, Pardoll DM, Wigginton JM, Kollia GD, Gupta A, McDonald D, Sankar V, Sosman JA, Atkins MB. Survival, durable response, and long-term safety in patients with previously treated advanced renal cell carcinoma receiving nivolumab. J. Clin. Oncol. 2015;33:2013–2020. doi: 10.1200/JCO.2014.58.1041. [DOI] [PMC free article] [PubMed] [Google Scholar]
- 16.Xu F, Jin T, Zhu Y, Dai C. Immune checkpoint therapy in liver cancer. J Exp Clin Cancer Res. 2018;37:110. doi: 10.1186/s13046-018-0777-4. [DOI] [PMC free article] [PubMed] [Google Scholar]
- 17.Han J, Chen M, Wang Y, Gong B, Zhuang T, Liang L, Qiao H. Identification of biomarkers based on differentially expressed genes in papillary thyroid carcinoma. Sci Rep. 2018;8:9912. doi: 10.1038/s41598-018-28299-9. [DOI] [PMC free article] [PubMed] [Google Scholar]
- 18.Yang H, Zhang X, Cai XY, Wen DY, Ye ZH, Liang L, Zhang L, Wang HL, Chen G, Feng ZB. From big data to diagnosis and prognosis: gene expression signatures in liver hepatocellular carcinoma. PeerJ. 2017;5:e3089. doi: 10.7717/peerj.3089. [DOI] [PMC free article] [PubMed] [Google Scholar]
- 19.Li B, Cui Y, Diehn M, Li R. Development and validation of an individualized immune prognostic signature in early-stage nonsquamous non-small cell lung cancer. JAMA Oncol. 2017;3:1529–1537. doi: 10.1001/jamaoncol.2017.1609. [DOI] [PMC free article] [PubMed] [Google Scholar]
- 20.Bogolyubova AV, Belousov PV. Inflammatory immune infiltration in human tumors: role in pathogenesis and prognostic and diagnostic value. Biochemistry (Mosc) 2016;81:1261–1273. doi: 10.1134/S0006297916110043. [DOI] [PubMed] [Google Scholar]
- 21.Bedognetti D, Hendrickx W, Marincola FM, Miller LD. Prognostic and predictive immune gene signatures in breast cancer. Curr Opin Oncol. 2015;27:433–444. doi: 10.1097/CCO.0000000000000234. [DOI] [PubMed] [Google Scholar]
- 22.Tellapuri S, Sutphin PD, Beg MS, Singal AG, Kalva SP. Staging systems of hepatocellular carcinoma: a review. Indian J Gastroenterol. 2018;37:481–491. doi: 10.1007/s12664-018-0915-0. [DOI] [PubMed] [Google Scholar]
- 23.Hsiao YW, Chiu LT, Chen CH, Shih WL, Lu TP. Tumor-infiltrating leukocyte composition and prognostic power in hepatitis B- and hepatitis C-related hepatocellular carcinomas. Genes (Basel) 2019;10 doi: 10.3390/genes10080630. [DOI] [PMC free article] [PubMed] [Google Scholar]
- 24.Al Fayi MS, Gou X, Forootan SS, Al-Jameel W, Bao Z, Rudland PR, Cornford PA, Hussain SA, Ke Y. The increased expression of fatty acid-binding protein 9 in prostate cancer and its prognostic significance. Oncotarget. 2016;7:82783–82797. doi: 10.18632/oncotarget.12635. [DOI] [PMC free article] [PubMed] [Google Scholar]
- 25.Breen EC, Tang K. Calcyclin (S100A6) regulates pulmonary fibroblast proliferation, morphology, and cytoskeletal organization in vitro. J Cell Biochem. 2003;88:848–854. doi: 10.1002/jcb.10398. [DOI] [PubMed] [Google Scholar]
- 26.Schneider G, Filipek A. S100A6 binding protein and Siah-1 interacting protein (CacyBP/SIP): spotlight on properties and cellular function. Amino Acids. 2011;41:773–780. doi: 10.1007/s00726-010-0498-2. [DOI] [PubMed] [Google Scholar]
- 27.Ning X, Chen Y, Wang X, Li Q, Sun S. The potential role of CacyBP/SIP in tumorigenesis. Tumour Biol. 2016;37:10785–10791. doi: 10.1007/s13277-016-4871-y. [DOI] [PubMed] [Google Scholar]
- 28.Juttner R, Montag D, Craveiro RB, Babich A, Vetter P, Rathjen FG. Impaired presynaptic function and elimination of synapses at premature stages during postnatal development of the cerebellum in the absence of CALEB (CSPG5/neuroglycan C) Eur J Neurosci. 2013;38:3270–3280. doi: 10.1111/ejn.12313. [DOI] [PubMed] [Google Scholar]
- 29.Zheng Y, Gao Y, Li X, Si S, Xu H, Qi F, Wang J, Cheng G, Hua L, Yang H. Long non-coding RNA NAP1L6 promotes tumor progression and predicts poor prognosis in prostate cancer by targeting Inhibin-beta A. Onco Targets Ther. 2018;11:4965–4977. doi: 10.2147/OTT.S163680. [DOI] [PMC free article] [PubMed] [Google Scholar]
- 30.Ding S, Li C, Lin S, Yang Y, Liu D, Han Y, Zhang Y, Li L, Zhou L, Kumar S. Comparative evaluation of microvessel density determined by CD34 or CD105 in benign and malignant gastric lesions. Hum Pathol. 2006;37:861–866. doi: 10.1016/j.humpath.2006.02.006. [DOI] [PubMed] [Google Scholar]
- 31.Sluimer JC, Daemen MJ. Novel concepts in atherogenesis: angiogenesis and hypoxia in atherosclerosis. J Pathol. 2009;218:7–29. doi: 10.1002/path.2518. [DOI] [PubMed] [Google Scholar]
- 32.Lin JZ, Meng LL, Li YZ, Chen SX, Xu JL, Tang YJ, Lin N. Importance of activated hepatic stellate cells and angiopoietin-1 in the pathogenesis of hepatocellular carcinoma. Mol Med Rep. 2016;14:1721–1725. doi: 10.3892/mmr.2016.5418. [DOI] [PubMed] [Google Scholar]
- 33.Torimura T, Ueno T, Kin M, Harada R, Taniguchi E, Nakamura T, Sakata R, Hashimoto O, Sakamoto M, Kumashiro R, Sata M, Nakashima O, Yano H, Kojiro M. Overexpression of angiopoietin-1 and angiopoietin-2 in hepatocellular carcinoma. J Hepatol. 2004;40:799–807. doi: 10.1016/j.jhep.2004.01.027. [DOI] [PubMed] [Google Scholar]
- 34.Gong Y, Sun X, Huo L, Wiley EL, Rao MS. Expression of cell adhesion molecules, CD44s and E-cadherin, and microvessel density in invasive micropapillary carcinoma of the breast. Histopathology. 2005;46:24–30. doi: 10.1111/j.1365-2559.2004.01981.x. [DOI] [PubMed] [Google Scholar]
- 35.Lahmar Q, Keirsse J, Laoui D, Movahedi K, Van Overmeire E, Van Ginderachter JA. Tissue-resident versus monocyte-derived macrophages in the tumor microenvironment. Biochim Biophys Acta. 2016;1865:23–34. doi: 10.1016/j.bbcan.2015.06.009. [DOI] [PubMed] [Google Scholar]
- 36.Chon YE, Park H, Hyun HK, Ha Y, Kim MN, Kim BK, Lee JH, Kim SU, Kim DY, Ahn SH, Hwang SG, Han KH, Rim KS, Park JY. Development of a new nomogram including neutrophil-to-lymphocyte ratio to predict survival in patients with hepatocellular carcinoma undergoing transarterial chemoembolization. Cancers (Basel) 2019:11. doi: 10.3390/cancers11040509. [DOI] [PMC free article] [PubMed] [Google Scholar]
Associated Data
This section collects any data citations, data availability statements, or supplementary materials included in this article.


