Abstract
This study aimed to explore the effects of long non-coding RNA (lncRNA) expression on rheumatoid arthritis (RA). LncRNA expression profiles were obtained from the synovial tissues of five RA patients and five age-/gender-matched controls by RNA-Seq. Six candidate lncRNAs were then chosen and their levels in synovial fluid further examined in 25 RA patients and 25 health controls using RT-qPCR. The effects of lncRNA RP11-83J16.1 overexpression and knockdown on RA fibroblast-like synoviocytes (RA-FLS) function, inflammation state, and URI1, FRAT1, and β-catenin levels were assessed. After RNA-Seq, lncRNA expression profiles clearly distinguished RA patients from controls, and 190 upregulated lncRNAs and 131 downregulated lncRNAs were identified, which were mainly enriched in proliferative/immune/inflammatory pathways. Results of RT-qPCR showed that the levels of lncRNAs MTCO2P12, KCNQ5-IT1 and RP11-83J16.1 were increased, whereas lncRNAs LINC00570, RP11-342M1.6, and REXO1L4P were decreased in RA patients compared to controls. Notably, lncRNA RP11-83J16.1 correlated with increased inflammation and disease activity in RA patients. Additionally, lncRNA RP11-83J16.1 promoted cell proliferation, migration, invasion and inflammation, reduced apoptosis, and positively regulates cellular URI1, FRAT1 and β-catenin expression in RA-FLS. Rescue experiments revealed that URI1 overexpression compensated for the regulatory effects of lncRNA RP11-83J16.1 knockdown in RA-FLS. In conclusion, lncRNA RP11-83J16.1, a novel lncRNA identified by RNA-Seq, correlates with increased risk and disease activity of RA, and promotes RA-FLS proliferation, migration, invasion and inflammation by regulating URI1 and downstream β-catenin pathway components.
Keywords: Long non-coding RNA, expression profile, RP11-83J16.1, rheumatoid arthritis, fibroblast-like synoviocytes
Introduction
Rheumatoid arthritis (RA) is a common autoimmune joint disease that primarily affects women worldwide [1]. It manifests as synovial hyperproliferation and inflammatory/immune cells infiltration, which can be clinically characterized by tender/swollen joints, bone erosion, and disability [2]. To effectively control disease symptoms (including tender/swollen joints and inflammation), postpone or attenuate its radiographic progression, and improve patient mobility, a number of novel drugs have been recently developed, including inhibitors of tumor necrosis factor (TNF), interleukin (IL) - 6 and Janus Kinase (JAK); Additionally, several treatment strategies have been proposed, such as treat-to-target therapy and individual treatment [3]. However, a proportion of patients still suffer from poor treatment response, uncontrolled disease status, and easily recurrence [4]. Therefore, it’s essential to further investigate the mechanism underlying RA to explore novel biomarkers as well as potential treatment targets.
As a newly discovered non-coding RNA subtype, long non-coding RNA (lncRNA) has been found to participate in the pathogenesis of RA [5]. For instance, lncRNA HIX003209, which was found to be overexpressed in peripheral blood mononuclear cells (PBMCs) from RA patients, was shown to promote macrophage proliferation and stimulation via the regulation of the IκBα/nuclear factor-kappa B (NF-κB) signaling pathway [6]. Moreover, our collaborate institution observed that the insufficient expression of lncRNA ITSN1-2 was not only correlated with decreased disease activity but also attenuated the proliferation of RA fibroblast-like synoviocytes (FLS) and reduced inflammation by blocking the oligomerization domain 2 (NOD2) signaling pathway [7]. However, these studies focused on the role of specific lncRNAs during the etiology of RA instead of on the complete lncRNA expression profile, and thus are only able to provide limited information about the general impact of lncRNAs on RA.
Therefore, the present study used RNA sequencing (RNA-Seq) to examine lncRNA expression profiles in RA and control synovial tissues, revealing the involvement of lncRNA expression in RA by bioinformatics. Subsequently, six candidate lncRNAs were chosen and validated using reverse transcription-quantitative polymerase chain reaction (RT-qPCR) in a larger number of RA and control synovial tissues. Lastly and, most importantly, a lncRNA (RP11-83J16.1) having a close correlation with disease risk and activity of RA was selected, and in vitro experiments were performed to explore its potential effects on the regulation of the cellular functions of RA-FLS.
Methods
Patients and samples
Twenty-five RA patients who had knee involvement and 25 knee trauma patients were recruited in this study. Eligible RA patients were: (1) diagnosed as RA according to 2010 American College of Rheumatology (ACR)/European League Against Rheumatism (EULAR) RA classification criteria [8], (2) presenting with severe knee symptoms and about to receive arthroscopic surgery, (3) age more than 18 years, (4) had no history of knee surgery. The knee trauma patients who served as controls in the present study were required to meet the following criteria: (1) about to receive knee surgery due to knee trauma, (2) had no history of knee degeneration disease or inflammatory diseases, (3) age more than 18 years. Pregnant and lactating women were excluded from the study. This study was approved by the Ethics Committee of Yueyang Hospital of Integrated Traditional Chinese & Western Medicine, Shanghai University of Traditional Chinese Medicine. After all participants provided signed informed consents, keen synovial tissues were collected during surgery. For RA patients, clinical features [age, gender, body mass index (BMI)], disease duration, rheumatoid factor (RF) status, anticitrullinated protein antibodies (ACPA) status, tender joint count (TJC), swollen joint count (SJC), erythrocyte sedimentation rate (ESR), C-reactive protein (CRP), disease activity score based on ESR in 28 joints (DAS28_ESR), and disease activity score based on CRP in 28 joints (DAS28_CRP) were documented. Additionally, the age, gender and BMI of controls were recorded.
RNA-seq
For RNA-Seq analysis, five pairs of synovial tissue samples were selected from five RA patients and five health controls, and the age and gender of the controls were matched to the RA patients. In brief, total RNA was isolated from synovial tissues using RNeasy Protect Mini Kit (Qiagen, German), and the integrity and quantity of the RNA were then assessed using an Agilent 2100 Bioanalyzer (Agilent Technologies, USA). The rRNA was removed using Ribo-Zero Gold rRNA Removal Kit (Illumina, Inc., USA). The construction and preparation of RNA-Seq library were performed by Genergy Bio (Shanghai, China) using an Illumina Xten High-throughput Sequencing Platform, as previously described [9]. Quality trimming and adapter trimming were conducted using Trim Galore software (Babraham Bioinformatics, UK). The trimmed reads were then aligned to the human reference genome (hg38) using Tophat [10] with default parameters and Ensemble genome annotation (Homo_sapiens.GRCh38.83.chr.gtf). The lncRNAs and mRNAs discovered in at least 50% of the samples were then analyzed. Finally, the raw count of each gene was calculated using featurecount, the expression levels were normalized, and the differential expression analysis was performed using DESeq2 in the R software package [11].
Bioinformatic analysis
The R software packages were used for RNA-Seq data analysis and visualization. The principal component analysis (PCA) plot and the heatmap of the lncRNA and mRNA expression profiles were plotted using the Factoextra and pheatmap packages, respectively. The differentially expressed genes (DEGs) were defined as the lncRNAs or mRNAs with a fold change (FC) ≥2.0 and an adjusted P value (BH multiple test correction) <0.05, which were displayed as Volcano Plots. Gene Ontology (GO) and Kyoko Encyclopedia of Genes and Genomes (KEGG) enrichment analyses of DEGs were performed using DAVID web servers [12], and the graphics were constructed using the ggplot2 package. The top 20 differentially expressed lncRNAs (10 upregulated and 10 downregulated) were selected by the rank of absolute log2FC values. The mRNAs regulated by the top 20 differentially expressed lncRNAs were analyzed based on the trans-regulation of the lncRNAs according to Pearson correlation coefficient, which were illustrated by the lncRNA-mRNA co-expression network.
Candidate lncRNAs by RT-qPCR validation
A total of six candidate lncRNAs, including the top three upregulated lncRNAs and the top three downregulated lncRNAs, were selected from RNA-Seq analysis results by the rank of the absolute log2FC values. The expression levels of the six candidate lncRNAs were further examined in the synovial tissues from 25 RA patients and 25 controls using RT-qPCR.
Cell culture
RA-FLS were isolated from the synovium tissues of RA patients, as described previously [13,14]. DMEM medium (Gibco, USA) containing fetal bovine serum (FBS) (Gibco, USA) was used to culture RA-FLS at 37°C in an atmosphere of 5% CO2 and 95% air.
Plasmid transfection and post-transfection detection
The lncRNA RP11-83J16.1 overexpression plasmid, the control overexpression plasmid, the lncRNA RP11-83J16.1 knock-down plasmid, and the control knock-down plasmid were respectively constructed in the PEX-2 vector and pGPH1 vector by Guangzhou RiboBio Co., LTD (Guangzhou, China). These plasmids were respectively transfected into RA-FLS using Lipofectamine® 2000 (Life Technologies, USA), and the transfected cells were then respectively named as OE-Lnc group, OE-NC group, KD-Lnc group, and KD-NC group. For the post-transfection analyses of the four cell groups, RT-qPCR was performed at 24 hours (h) to measure lncRNA RP11-83J16.1 expression; the Cell Counting Kit-8 (CCK-8) assay (Sigma-Aldrich, USA) was used to measure cell proliferation at 0 h, 24 h, 48 h, and 72 h, which was completed in terms of the kit specification; and cell proliferation was assessed by calculating the optical density (OD) using a microplate reader (Bio-Rad, USA); Annexin V/Propidium Iodide (AV/PI) assay using Annexin V-FITC Apoptosis Detection Kit (R&D, USA) and flow cytometry were conducted to evaluate cell apoptosis at 48 h, according to the manufacturer’s instructions; Scratch assay was used to evaluate cell migration at 48 h; Transwell assay was used to assess cell invasive at 48 h; Additionally, cell supernatants were collected from the four cell groups 48 h after transfection, and enzyme-linked immunosorbent assay (ELISA) kits (R&D, USA) were used to measure the levels of tumor necrosis factor α (TNF-α), interleukin 1β (IL-1β), IL-6, matrix metalloproteinase 3 (MMP-3) and MMP-9 according to the manufacturer’s instructions.
Pathway assessment of the mRNA regulated by lncRNA RP11-83J16.1
Among the 10 mRNAs (OSBPL9, CLK4, TMEM41B, WDR36, HEATR1, EPRS, URI1, MMADHC, ZNF184, and RBM48) regulated by lncRNA RP11-83J16.1, URI1 was found to inhibit apoptosis [15], promot invasion [16], and initiate inflammation [17]. URI1 was also found to be related to the activation of the Wnt/β-catenin pathway [18]. Therefore, we hypothesized that lncRNA RP11-83J16.1 might activate the β-catenin pathway by regulating the URI1 to stimulate the cellular functions of RA-FLS. Hence, the mRNA and protein expression levels of URI1, FRAT1 and β-catenin (FRAT1 and β-catenin were 2 genes implicated in Wnt/β-catenin pathway) were measured 48 h after transfection of the four cell groups using RT-qPCR and western blotting analyses, respectively, as previously described [19] (Antibodies applied in the western blot were shown in the Supplementary Table 1).
Rescue experiment and related determination
URI1 overexpression plasmid was constructed by Guangzhou RiboBio Co., LTD (Guangzhou, China). The lncRNA RP11-83J16.1 knock-down plasmid and the URI1 overexpression plasmid were co-transfected into RA-FLS using Lipofectamine® 2000 (Life Technologies, USA); the lncRNA RP11-83J16.1 knock-down plasmid and the control overexpression plasmid were co-transfected into RA-FLS, which served as the control. Transfected RA-FLS were divided into the KD-Lnc&OE-URI1 group and KD-Lnc&OE-NC group, respectively. After transfection, the lncRNA RP11-83J16.1 expression were assessed by RT-qPCR at 24 h; the cell proliferation, cell apoptosis, cell migration, cell invasive ability as well as the levels of IL-1β, IL-6, TNF-α, MMP-3 and MMP-9 were assessed at 48 h by the methods and kits described above. Additionally, mRNA and protein expression levels of URI1, FRAT1, and β-catenin were determined at 48 h using RT-qPCR and western blot analyses, respectively.
RT-qPCR procedure
Total RNA was isolated from synovium tissue and RA-FLS using the RNeasy Protect Mini Kit (Qiagen, German), and the integrity and quantity of the RNA were assessed using an Agilent 2100 Bioanalyzer (Agilent Technologies, USA). Next, cDNAs synthesis was performed using an iScript™ cDNA Synthesis Kit (Bio-Rad, USA). The cDNA products were subjected to qPCR using the KOD SYBR® qPCR Mix (Toyobo, Japan). PCR amplification was carried out as follows: 95°C for 5 min followed by 40 cycles of 95°C for 10 s and 60°C for 60 s. The relative expression levels of lncRNAs or mRNAs were calculated using the 2-ΔΔCt methods with phosphoglyceraldehyde dehydrogenase (GAPDH) as the internal reference. Primers used for qPCR are shown in Supplementary Table 2.
Statistical analysis
Continuous data are expressed as mean and standard deviation (SD) or median and interquartile range (IQR), and the categorical data are displayed as the count and percentage. Comparison of continuous data was made using the unpaired Student’s t test or Wilcoxon rank sum test, and comparison of categorical data was made using the Chi-square test. Correlations between two continuous variables were determined using the spearman’s rank correlation test. Matched cohorts were screened using propensity score matching (PSM) [20]. The propensity score was estimated using a multivariable logistic regression model based on age and gender of RA patients and controls, and the matching was performed using a 1:1 nearest-neighbor matching protocol without replacement (Fuzzy-matching algorithm), with caliper width 0.1 (maximum allowable difference in propensity scores). Statistical analysis was carried out using SPSS 24.0 (IBM, USA) and GraphPad Prism 7.01 (GraphPad Software, USA). P value <0.05 indicated statistically significant. In the cellular experiments, P value <0.05, <0.01, and <0.001 were respectively displayed as “*”, “**”, and “***”, whereas P value >0.05 (not significant) was displayed as “NS” in the figures.
Results
Characteristics of participants in RNA-Seq stage
In RNA-Seq stage, five RA patients and five age-/gender-matched controls were included. The age was 52.4±3.0 years in RA patients and 49.4±5.5 years in controls (P=0.318), and the percentage of females was 60% in both RA patients and control groups (P=1.000). The BMI was 23.3±2.9 Kg/m2 in RA patients and 22.7±2.1 Kg/m2 in controls (P=0.759). Detailed information of patient disease status is presented in Table 1.
Table 1.
Characteristics of RA patients and controls
| Items | RNA-Seq | RT-qPCR Validation | ||||
|---|---|---|---|---|---|---|
|
|
|
|||||
| RA patients (N=5) | Controls (N=5) | P value | RA patients (N=25) | Controls (N=25) | P value | |
| Age (years, mean ± SD) | 52.4±3.0 | 49.4±5.5 | 0.318 | 56.1±9.2 | 35.9±10.3 | <0.001 |
| Female, No. (%) | 3 (60.0) | 3 (60.0) | 1.000 | 18 (72.0) | 10 (40.0) | 0.023 |
| BMI (Kg/m2, mean ± SD) | 23.3±2.9 | 22.7±2.1 | 0.759 | 22.9±2.6 | 22.3±2.2 | 0.368 |
| Disease duration (years, mean ± SD) | 9.0±3.0 | - | - | 9.0±2.6 | - | - |
| RF Positive, No. (%) | 5 (100.0) | - | - | 22 (88.0) | - | - |
| ACPA Positive, No. (%) | 4 (80.0) | - | - | 19 (76.0) | - | - |
| TJC, median (IQR) | 8.0 (5.0-10.5) | - | - | 6.0 (5.0-8.0) | - | - |
| SJC, median (IQR) | 7.0 (4.5-8.5) | - | - | 6.0 (5.0-7.5) | - | - |
| ESR (mm/h, mean ± SD) | 39.4±23.3 | - | - | 39.6±19.6 | - | - |
| CRP (mg/L, mean ± SD) | 85.3±51.2 | - | - | 79.5±52.1 | - | - |
| DAS28_ESR score, mean ± SD | 5.2±0.7 | - | - | 5.1±0.5 | - | - |
| DAS28_CRP score, mean ± SD | 5.3±0.7 | - | - | 5.1±0.4 | - | - |
RA: rheumatoid arthritis; RNA-Seq: RNA Sequencing; RT-qPCR: reverse transcriptional quantitative polymerase chain reaction; SD: standard deviation; BMI: body mass index; RF: rheumatoid factor; ACPA: anti-citrulline protein antibody; TJC: tender joint count; IQR: interquartile range; SJC: swollen joint count; ESR: erythrocyte sedimentation rate; CRP: C-reactive protein; DAS28: disease activity score in 28 joints.
Overview of lncRNA/mRNA expression profile by PCA and Heatmap analyses
PCA plots of the lncRNA expression profiles were used to clearly distinguish RA patients from controls (Figure 1A), and Heatmap analysis revealed that the lncRNA expression profiles had good internal aggregation in both groups (Figure 1B). The mRNA expression profiles were also used to distinguish RA patients from controls as well by PCA plot and Heatmap analyses (Figure 1C, 1D).
Figure 1.
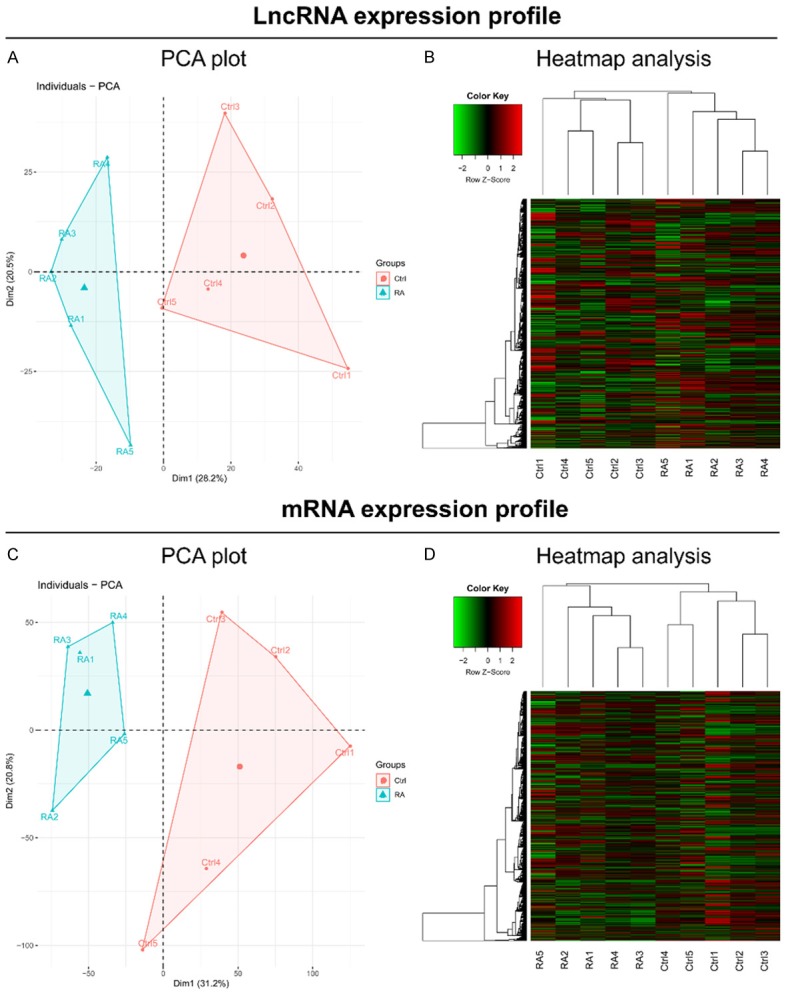
PCA plot and heatmap analyses. PCA plot analysis (A) and Heatmap analysis (B) based on lncRNA expression profiles. PCA plot analysis (C) and Heatmap analysis (D) based on mRNA expression profiles.
Differentially expressed lncRNAs/mRNAs and corresponding enrichment analyses
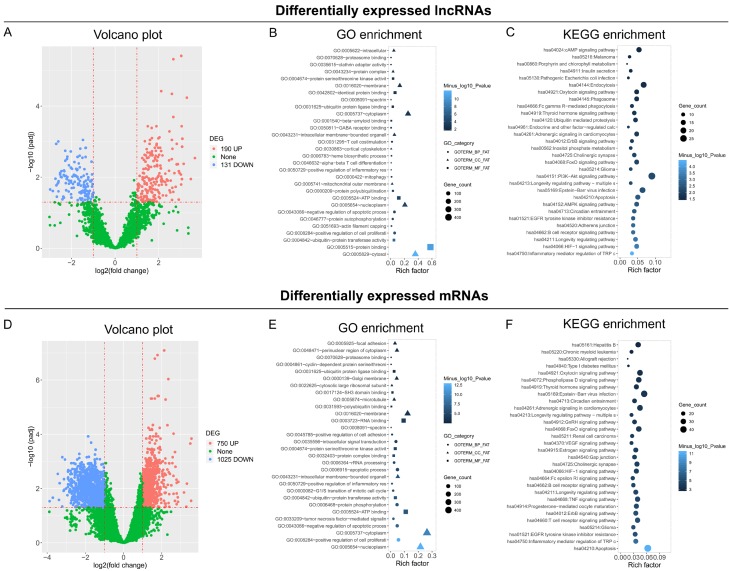
A total of 190 upregulated lncRNAs and 131 downregulated lncRNAs were shown in RA patients compared to controls by Volcano plot analysis (Figure 2A). GO enrichment analysis showed that these differentially expressed lncRNAs were enriched in molecular functions, such as protein binding, ubiquitin-protein transferase activity, ubiquitin-protein transferase activity, etc.; and enriched in cellular components, such as cytosol, nucleoplasm, mitochondrial outer membrane, etc.; also enriched in biological process, such as enhanced cell proliferation, inhibited apoptotic process, enhanced inflammatory response, etc. (Figure 2B). KEGG enrichment analysis revealed that these differentially expressed lncRNAs were enriched in proliferative/immune/inflammatory pathways, such as Inflammatory mediator regulation of TRP channels, HIF-1 signaling pathway, B cell receptor signaling pathway, AMPK signaling pathway, etc. (Figure 2C). A total of 750 upregulated mRNAs and 1025 downregulated mRNAs were discovered using Volcano plot analysis (Figure 2D). The detailed results of the GO and KEGG enrichment analyses are shown in Figure 2E, 2F.
Figure 2.
Volcano and enrichment analysis. Volcano plot analysis (A), GO enrichment analysis (B), and KEGG enrichment analysis (C) based on differentially expressed lncRNAs. Volcano plot analysis (D), GO enrichment analysis (E), and KEGG enrichment analysis (F) based on differentially expressed mRNAs.
Regulatory network of the top 20 differentially expressed lncRNAs
Since so many differentially expressed lncRNAs were discovered, only the details of the top 20 differentially expressed lncRNAs (10 upregulated and 10 downregulated) are presented (Table 2). In detail, the top 10 upregulated lncRNAs in RA patients compared to controls were as follows: lncRNA MTCO2P12, lncRNA KCNQ5-IT1, lncRNA RP11-83J16.1, lncRNA RP4-800G7.1, lncRNA AC016712.2, lncRNA RP11-25I15.1, lncRNA RP11-416A14.1, lncRNA RP11-552M11.8, lncRNA FAM204BP, and lncRNA RPS15AP10; while the top 10 downregulated lncRNAs in RA patients compared to controls were as follows: LINC00570, lncRNA RP11-342M1.6, lncRNA REXO1L4P, lncRNA OSER1-AS1, lncRNA RP11-104L21.3, lncRNA CTD-2561J22.5, lncRNA RP11-67C2.2, lncRNA FOXO3B, lncRNA CYP4A22-AS1, and lncRNA MKRN9P. Furthermore, the regulatory network of the top 20 differentially expressed lncRNAs was analyzed based on the lncRNA/mRNA expression profiles obtained by RNA-Seq (Figure 3), which showed that most of these differentially expressed lncRNAs had multiple regulated mRNAs.
Table 2.
Top 20 differentially expressed lncRNAs (10 upregulated and 10 downregulated) by RNA-Seq
| Gene-ID | Symbol | Log2FC | P value | P adj value | Trend |
|---|---|---|---|---|---|
| ENSG00000229344 | LncRNA MTCO2P12 | 3.646004475 | 7.65E-05 | 0.002913406 | UP |
| ENSG00000233844 | LncRNA KCNQ5-IT1 | 3.460266482 | 0.000789351 | 0.011282588 | UP |
| ENSG00000231409 | LncRNA RP11-83J16.1 | 3.278440983 | 7.10E-08 | 5.81E-05 | UP |
| ENSG00000239719 | LncRNA RP4-800G7.1 | 3.132293271 | 0.000148659 | 0.004225799 | UP |
| ENSG00000235225 | LncRNA AC016712.2 | 3.072413106 | 5.04E-06 | 0.000831346 | UP |
| ENSG00000240759 | LncRNA RP11-25I15.1 | 3.061163872 | 1.67E-05 | 0.001392588 | UP |
| ENSG00000270040 | LncRNA RP11-416A14.1 | 3.053001302 | 0.000792662 | 0.01131312 | UP |
| ENSG00000260948 | LncRNA RP11-552M11.8 | 3.038398262 | 1.28E-06 | 0.00037042 | UP |
| ENSG00000233040 | LncRNA FAM204BP | 3.019042378 | 1.68E-09 | 3.89E-06 | UP |
| ENSG00000225447 | LncRNA RPS15AP10 | 3.014635305 | 0.001448183 | 0.01614485 | UP |
| ENSG00000224177 | LINC00570 | -2.987875317 | 0.002424475 | 0.022292939 | DOWN |
| ENSG00000237090 | LncRNA RP11-342M1.6 | -2.867935528 | 0.002838059 | 0.02459816 | DOWN |
| ENSG00000270416 | LncRNA REXO1L4P | -2.745740977 | 0.000750914 | 0.011071907 | DOWN |
| ENSG00000223891 | LncRNA OSER1-AS1 | -2.71140094 | 1.14782E-05 | 0.001160521 | DOWN |
| ENSG00000273160 | LncRNA RP11-104L21.3 | -2.703516412 | 0.001599269 | 0.017006167 | DOWN |
| ENSG00000268119 | LncRNA CTD-2561J22.5 | -2.681488086 | 0.005047673 | 0.035598002 | DOWN |
| ENSG00000231964 | LncRNA RP11-67C2.2 | -2.646038328 | 0.001299937 | 0.015166849 | DOWN |
| ENSG00000240445 | LncRNA FOXO3B | -2.616382945 | 7.27608E-06 | 0.00099015 | DOWN |
| ENSG00000225506 | LncRNA CYP4A22-AS1 | -2.616362506 | 0.001165543 | 0.014225331 | DOWN |
| ENSG00000258128 | LncRNA MKRN9P | -2.60982294 | 0.002947411 | 0.025091281 | DOWN |
Top 10 upregulated and 10 downregulated lncRNAs were selected by the rank of absolute value of Log2FC. lncRNA: long non-coding RNA; RNA-Seq: RNA Sequencing; FC: fold change.
Figure 3.
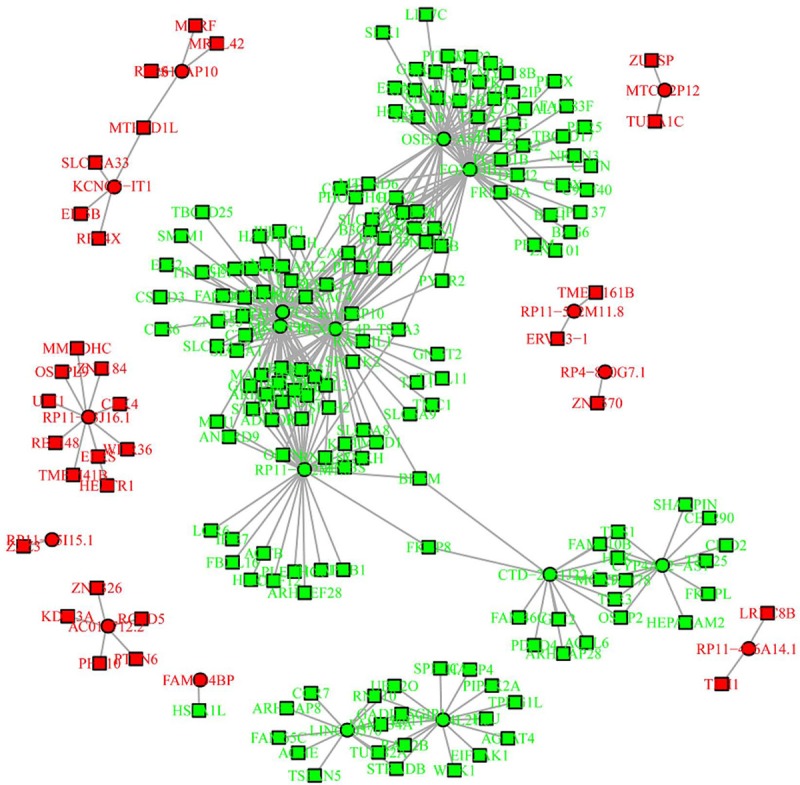
Regulatory network of the top 20 differentially expressed lncRNAs.
Comparison of 6 candidate lncRNAs in RT-qPCR stage
Six candidate lncRNAs (three upregulated and three downregulated in RA patients compared to controls) were selected based on the rank of FC level in RNA-Seq, and were further detected using RT-qPCR in synovial tissues from 25 RA patients and 25 controls. In this period, the age was 56.1±9.2 years in RA patients and 35.9±10.3 years in controls (P<0.001), the percentage of females was 72% in RA patients and 40% in controls (P=0.023), and the BMI was 22.9±2.6 Kg/m2 in RA patients and 22.3±2.2 Kg/m2 in controls (P=0.368). Detailed information of disease status of the 25 RA patients is presented in Table 1. Since age and gender were different between RA patients and controls in this period, PSM was performed to adjust the results about the comparison of 6 candidate lncRNAs between RA patients and controls. Before adjustment, lncRNA MTCO2P12 (P<0.001, Figure 4A), lncRNA KCNQ5-IT1 (P<0.001, Figure 4B) and lncRNA RP11-83J16.1 (P<0.001, Figure 4C) were greatly increased, while LINC00570 (P<0.001, Figure 4D), lncRNA RP11-342M1.6 (P<0.001, Figure 4E) and lncRNA REXO1L4P (P<0.001, Figure 4F) were greatly decreased in RA patients compared to controls. After adjustment, lncRNA MTCO2P12 (P=0.021, Figure 4G), lncRNA KCNQ5-IT1 (P=0.049, Figure 4H) and lncRNA RP11-83J16.1 (P<0.001, Figure 4I) were also higher, while LINC00570 (P=0.007, Figure 4J), lncRNA RP11-342M1.6 (P<0.001, Figure 4K) and lncRNA REXO1L4P (P<0.001, Figure 4L) were greatly decreased in RA patients compared to controls.
Figure 4.
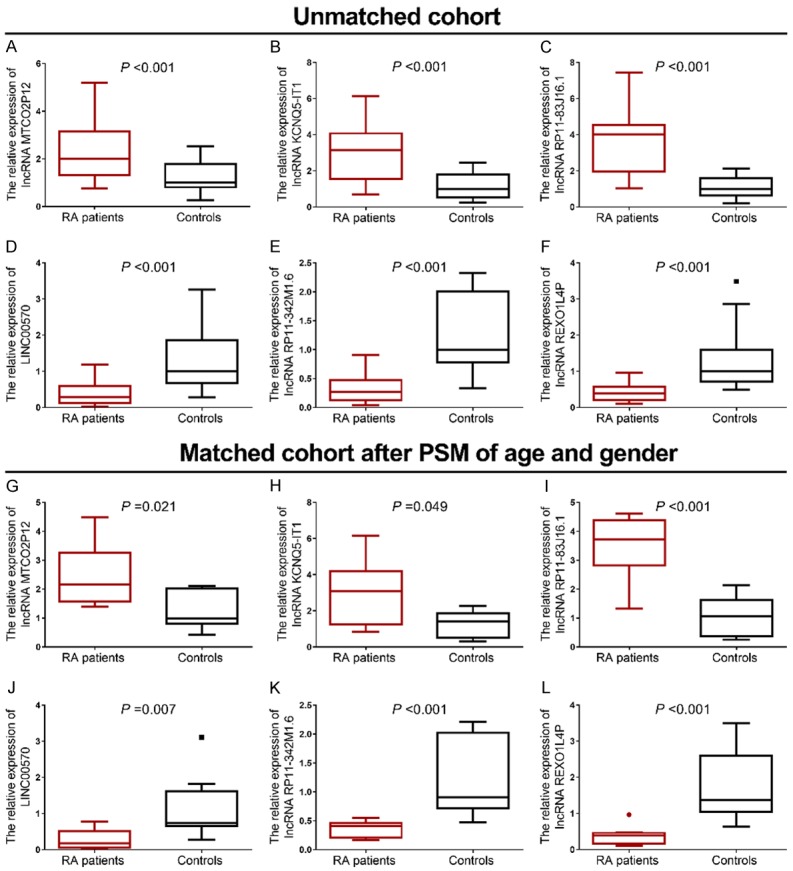
Candidate lncRNAs in RT-qPCR stage. Before PSM adjustment, comparison of lncRNA MTCO2P12 (A), lncRNA KCNQ5-IT1 (B), lncRNA RP11-83J16.1 (C), LINC00570 (D), lncRNA RP11-342M1.6 (E) and lncRNA REXO1L4P (F). After PSM adjustment, comparison of lncRNA MTCO2P12 (G), lncRNA KCNQ5-IT1 (H), lncRNA RP11-83J16.1 (I), LINC00570 (J), lncRNA RP11-342M1.6 (K) and lncRNA REXO1L4P (L).
Correlation of six candidate lncRNAs with disease activity in RA patients
In RT-qPCR stage, lncRNA RP11-83J16.1 was observed to positively correlate with SJC (P=0.031), CRP (P=0.026) and DAS28_CRP (P=0.013), indicating its close implication with RA progression (Table 3). Furthermore, LINC00570 negatively correlated with DAS28_CRP (P=0.021). No other correlations between the six candidate lncRNAs and disease activity indexes were observed (Table 3).
Table 3.
Correlation of lncRNAs with RA disease activity
| Items | LncRNA | ||||||
|---|---|---|---|---|---|---|---|
|
| |||||||
| MTCO2P12 | KCNQ5-IT1 | RP11-83J16.1 | LINC00570 | RP11-342M1.6 | REXO1L4P | ||
| Disease duration | r | 0.026 | 0.044 | 0.176 | 0.027 | -0.068 | 0.137 |
| P value | 0.900 | 0.834 | 0.400 | 0.899 | 0.746 | 0.514 | |
| TJC | r | 0.141 | -0.009 | 0.213 | -0.358 | 0.001 | 0.029 |
| P value | 0.500 | 0.966 | 0.306 | 0.079 | 0.996 | 0.891 | |
| SJC | r | 0.312 | 0.384 | 0.431 | -0.193 | -0.279 | -0.046 |
| P value | 0.129 | 0.058 | 0.031 | 0.356 | 0.178 | 0.829 | |
| ESR | r | 0.071 | 0.137 | 0.160 | -0.035 | -0.294 | 0.032 |
| P value | 0.737 | 0.514 | 0.445 | 0.867 | 0.154 | 0.878 | |
| CRP | r | 0.126 | 0.272 | 0.444 | -0.319 | -0.238 | -0.299 |
| P value | 0.548 | 0.188 | 0.026 | 0.120 | 0.253 | 0.146 | |
| DAS28_ESR score | r | 0.281 | 0.178 | 0.308 | -0.265 | -0.218 | 0.005 |
| P value | 0.174 | 0.395 | 0.135 | 0.200 | 0.294 | 0.980 | |
| DAS28_CRP score | r | 0.215 | 0.320 | 0.492 | -0.460 | -0.284 | -0.248 |
| P value | 0.301 | 0.119 | 0.013 | 0.021 | 0.169 | 0.231 | |
lncRNA: long non-coding RNA; TJC: tender joint count; SJC: swollen joint count; ESR: erythrocyte sedimentation rate; CRP: C-reactive protein; DAS28: disease activity score in 28 joints.
Effect of lncRNA RP11-83J16.1 on RA-FLS proliferation, apoptosis, migration and invasion
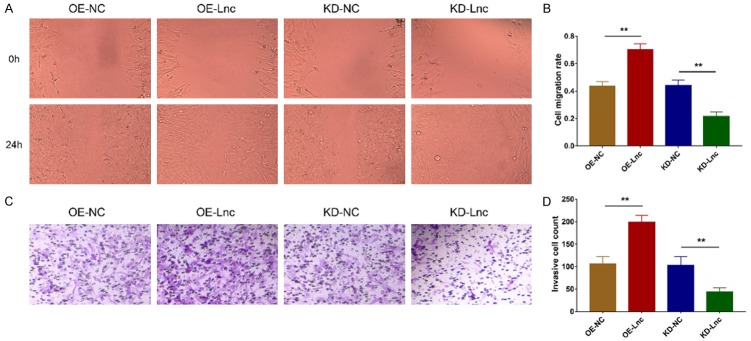
After transfection, lncRNA RP11-83J16.1 was greatly upregulated in OE-Lnc group compared to OE-NC group (P<0.001) but was greatly downregulated in KD-Lnc group compared to KD-NC group (P<0.001), indicating that the transfection outcomes were acceptable (Figure 5A). Notably, cell proliferation was increased in OE-Lnc group compared to OE-NC group (P<0.05) but was decreased in KD-Lnc group compared to KD-NC group (P<0.01) (Figure 5B); cell apoptosis was reduced in OE-Lnc group compared to OE-NC group (P<0.01) but was higher in KD-Lnc group compared to KD-NC group (P<0.001) (Figure 5C, 5D); cell migration ability and invasion ability were enhanced in OE-Lnc group compared to OE-NC group (both P<0.01) but attenuated in KD-Lnc group compared to KD-NC group (both P<0.01) (Figure 6A-D).
Figure 5.
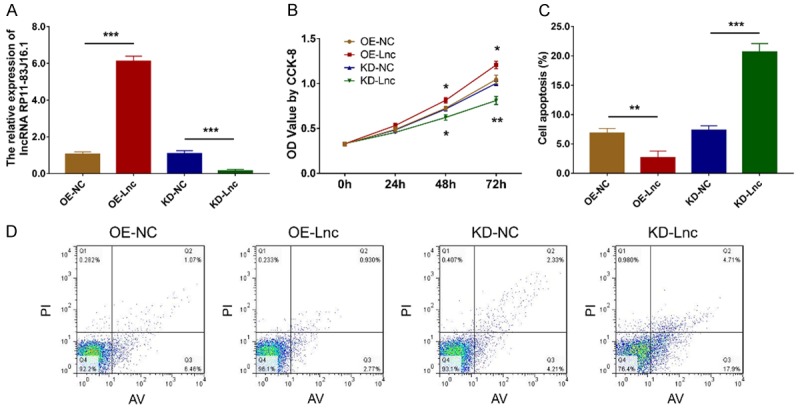
LncRNA RP11-83J16.1 regulated RA-FLS proliferation and apoptosis. LncRNA RP11-83J16.1 expression (A), cell proliferation (B) and cell apoptosis rate (C, D) in OE-Lnc, OE-NC, KD-Lnc and KD-NC groups.
Figure 6.
LncRNA RP11-83J16.1 regulated RA-FLS migration and invasion. Cell migration ability (A, B) and cell invasion ability (C, D) in OE-Lnc, OE-NC, KD-Lnc and KD-NC groups.
Effect of lncRNA RP11-83J16.1 on RA-FLS inflammation and invasion related markers
Inflammation related markers (TNF-α, IL-1β and IL-6) were increased in OE-Lnc group compared to OE-NC group (all P<0.05) but decreased in KD-Lnc group compared to KD-NC group (all P<0.01) (Figure 7A-C). In terms of invasion related markers, MMP-3 and MMP-9 were increased in OE-Lnc group compared to OE-NC group (all P<0.01) but decreased in KD-Lnc group compared to KD-NC group (all P<0.05) (Figure 7D, 7E).
Figure 7.
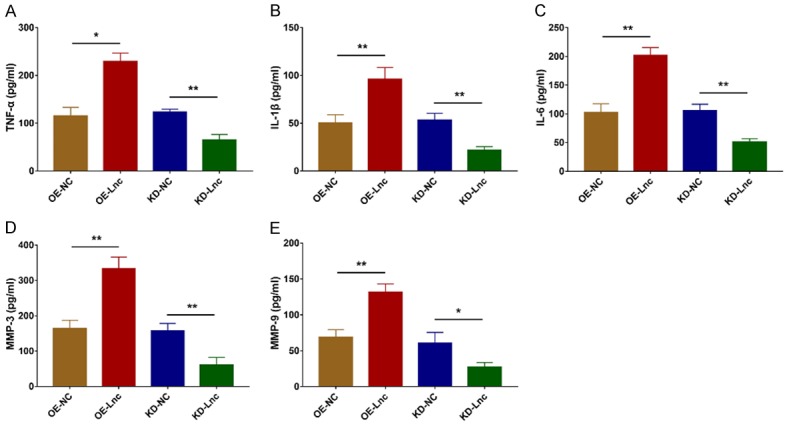
LncRNA RP11-83J16.1 regulated TNF-α, IL-1β, IL-6, MMP-3 and MMP-9 in RA-FLS. Inflammatory cytokines (including TNF-α (A), IL-1β (B), IL-6 (C)) and invasion markers (including MMP-3 (D) and MMP-9 (E)) in OE-Lnc, OE-NC, KD-Lnc and KD-NC groups.
Effect of lncRNA RP11-83J16.1 on URI1 and its downstream β-catenin pathway in RA-FLS
URI1, FRAT1 and β-catenin mRNA expression levels were increased in OE-Lnc group compared to OE-NC group (all P<0.05) but decreased in KD-Lnc group compared to KD-NC group (all P<0.05) (Figure 8A-C). Their protein expression levels showed a similar trend as their mRNA expressions did (Figure 8D).
Figure 8.
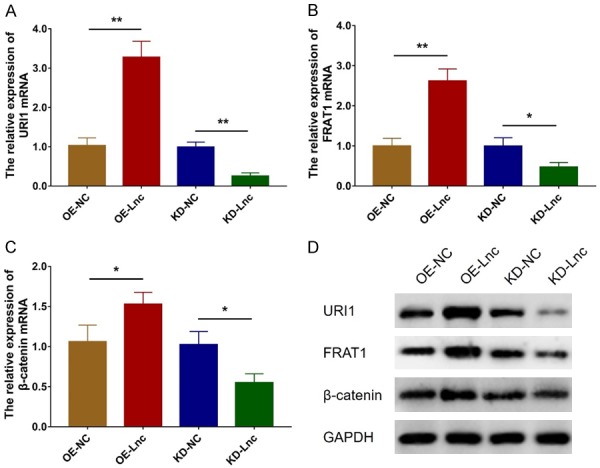
LncRNA RP11-83J16.1 regulated URI1 and downstream β-catenin pathway. URI1 mRNA (A), FRAT1 mRNA (B) and β-catenin mRNA (C) expressions in OE-Lnc, OE-NC, KD-Lnc and KD-NC groups. URI1, FRAT1 and β-catenin protein expressions (D) in OE-Lnc, OE-NC, KD-Lnc and KD-NC groups.
Effect of URI1 overexpression on lncRNA RP11-83J16.1 knockdown treated RA-FLS
So as to further explore whether lncRNA RP11-83J16.1 regulates RA-FLS functions via URI1 and its downstream β-catenin pathway, rescue experiments were conducted. LncRNA RP11-83J16.1 (P>0.05, Figure 9A) was of no difference while URI1 (P<0.001, Figure 9B, 9C) was greatly increased in KD-Lnc&OE-URI1 group compared to KD-Lnc&OE-NC group. Cell proliferation (P<0.05, Figure 9D), migration ability (P<0.05, Figure 9G, 9H) and invasion ability (P<0.05, Figure 9I, 9J) were all enhanced, whereas cell apoptosis (P<0.01, Figure 9E, 9F) was reduced in KD-Lnc&OE-URI1 group compared to KD-Lnc&OE-NC group. Inflammation- and invasion-related markers TNF-α (P<0.05, Figure 10A), IL-1β (P<0.05, Figure 10B), IL-6 (P<0.01, Figure 10C), MMP-3 (P<0.05, Figure 10D), and MMP-9 (P<0.05, Figure 10E) were all increased in KD-Lnc&OE-URI1 group compared to KD-Lnc&OE-NC group. Furthermore, downstream genes of URI1 (FRAT1 and β-catenin) were both higher in KD-Lnc&OE-URI1 group than KD-Lnc&OE-NC group (Both P<0.05, Figure 11A-C).
Figure 9.
URI1 overexpression regulated cell functions in lncRNA RP11-83J16.1 knockdown treated RA-FLS. lncRNA RP11-83J16.1 expression (A), URI1 mRNA expression (B), URI1 protein expression (C), cell proliferation (D), cell apoptosis rate (E, F), cell migration ability (G, H) and cell invasion ability (I, J) in KD-Lnc&OE-URI1 group and KD-Lnc&OE-NC group.
Figure 10.
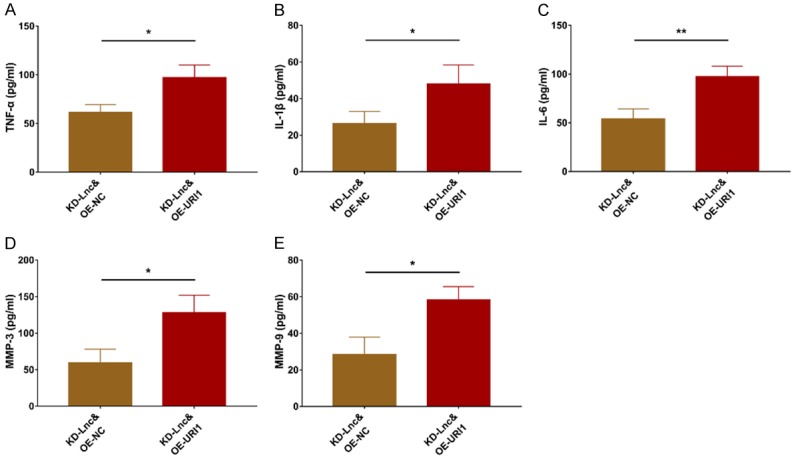
URI1 overexpression regulated TNF-α, IL-1β, IL-6, MMP-3 and MMP-9 in lncRNA RP11-83J16.1 knockdown treated RA-FLS. Inflammatory cytokines (including TNF-α (A), IL-1β (B), IL-6 (C)) and invasion markers (including MMP-3 (D) and MMP-9 (E)) in KD-Lnc&OE-URI1 group and KD-Lnc&OE-NC group.
Figure 11.

URI1 overexpression regulated FRAT1 and β-catenin in lncRNA RP11-83J16.1 knockdown treated RA-FLS. FRAT1 mRNA (A) and β-catenin mRNA (B) expressions in KD-Lnc&OE-URI1 group and KD-Lnc&OE-NC group; FRAT1 and β-catenin protein (C) expressions in KD-Lnc&OE-URI1 group and KD-Lnc&OE-NC group.
Discussion
RA is an extremely complex auto-immune disease whose etiology is still unclear [21]. While it’s widely accepted that synovial hypertrophy, dysregulated immune cell infiltration (such as B cells, Th1 cells, Th2 cells and Th17 cells), and abnormal autoantibody levels account for its development and progression [22], genetic factors, such as lncRNAs, are also increasingly recognized to play a key role in RA pathogenesis [23,24]. However, due to the short period since the identification of lncRNA involvement, only a limited number of researches of lncRNA profile in RA have been conducted. Briefly, a previous case-control study investigated lncRNA expression profile in serum from three RA patients and three health controls using microarray, finding 127 upregulated and 37 downregulated lncRNAs in RA patients, and these differentially expressed lncRNAs are enriched in toll like receptors (TLRs) and nuclear factor-kappa B (NF-κB) pathways [25]. Another previous study explored lncRNA expression profiles in PBMCs from three RA patients and three health controls using microarray, identifying a total of 2099 differentially expressed lncRNAs in RA patients, but without adjustment [26]. These limited previous studies suggest the involvement of lncRNA expression profiles in RA pathogenesis, while (1) they mainly focus on the blood sample instead of disease lesion (synovium), (2) they lack necessary adjustment to reduce the false positive rate, (3) they apply microarray but not RNA-Seq to detect the profile that would decreased the detective number of lncRNAs, and they could not discover new lncRNAs based on microarray. To resolve these issues, we assessed lncRNA expression profiles in five pairs of RA and control synovial tissues by RNA-Seq in the present study; we observed that lncRNA expression profile could clearly distinguish RA patients from controls using PCA plots and heatmap analyses, revealing a close association of lncRNAs in RA. Furthermore, we found 190 upregulated lncRNAs and 131 downregulated lncRNAs in RA patients compared to controls, and they were enriched in proliferative/immune/inflammatory pathways, such as the inflammatory mediator regulation of TRP channels, HIF-1 signaling pathway, B cell receptor signaling pathway, and AMPK signaling pathway. Our results suggest that these lncRNAs might be involved in the RA development via the regulation of these pathways.
To assess the clinical value of specific lncRNAs in RA disease management, some meaningful researches have been published recently. For instance, lncRNA Cox2 and lncRNA HOTAIR were shown to be upregulated in serum from RA patients compared to health controls [27]; lncRNA DILC was found to be overexpressed in plasma from RA patients compared to health controls, and it positively correlated with inflammation, as indicated by plasma IL-6 levels in RA patients [28]. Furthermore, our collaborate institution found that levels of lncRNA ITSN1-2 were increased in synovial tissues from RA patients compared to controls, which also correlated with increased inflammation and disease activity in RA patients [7]. These previous studies show the clinical significance of several specific lncRNAs in RA risk or monitoring. In our present study, we further selected the six most differentially expressed lncRNAs as candidates based on the FC between RA patients and controls using RNA-Seq, and then validated their expression levels via RT-qPCR in a larger number of patients and controls. Interestingly, via RT-qPCR assay, we not only observed that these six candidate lncRNAs were greatly dysregulated in RA patients compared to controls before data adjustment, but were also dramatically dysregulated in RA patients compared to controls after adjustment, indicating a potential role for these lncRNAs as biomarkers of RA risk prediction. More excitingly, among these six candidates, lncRNA RP11-83J16.1 was not only greatly increased in RA patients compared to controls, but also positively correlated with SJC, CRP and DAS28_CRP score, indicating its close association with RA progression. Therefore, we also performed in vitro experiments to explore its potential effects on the regulation of RA-FLS functions.
In the aspect of regulating cellular functions of some specific lncRNAs in RA, increasing attentions have been initiated. A previous study showed that the inhibition of lncRNA PVT1 reduced RA-FLS proliferation and inflammation, while induced apoptosis by the demethylation of sirtuin 6 [28]. Another study found that lncRNA MEG3, a commonly investigated inflammation- and immune-related non-coding RNA, attenuated RA progression though sponging miR-141/AKT/mTOR signaling pathway [29]. Meanwhile, lncRNA GAPLINC was shown to stimulate RA-FLS proliferation, migration, invasion and inflammation by blocking miR-382-5p and miR-575 [30]. Moreover, lncRNA UCA1 was shown to promote RA-FLS proliferation while reducing its apoptosis via regulating Wnt6 [31]. However, as for lncRNA RP11-83J16.1 discovered in our study, no related reports have been shown. In the present study, based on the clinical findings, we further explored the effects of lncRNA RP11-83J16.1 on the regulation of RA-FLS cellular functions. We found that lncRNA RP11-83J16.1 promoted cell proliferation, migration, invasion and inflammation, while reduced cell apoptosis in RA-FLS. These results might be explained by (1) its interaction with URI1 and downstream β-catenin pathway in RA-FLS, which was validated in the rescue experiment as well; (2) RNA-Seq analysis showed lncRNA RP11-83J16.1 positively correlated with several genes such as WD repeat domain 36 (WDR36) and glutamyl-prolyl-tRNA synthetase (EPRS), meanwhile these genes were implicated in regulation of cell proliferation and inflammation, therefore lncRNA RP11-83J16.1 might regulate RA-FLS functions via the interaction with these genes, but this speculation needed further experiments to validate. Furthermore, we also subsequently performed rescue experiments via co-transfecting lncRNA RP11-83J16.1 knockdown and URI1 overexpression plasmids into RA-FLS, and observed that URI1 overexpression compensated the regulatory effect of lncRNA RP11-83J16.1 knockdown in RA-FLS, which implied that lncRNA RP11-83J16.1 took effect via regulating URI1 and its downstream β-catenin pathway in RA-FLS.
In conclusion, this current study uncovered the involvement of lncRNA expression profiles in RA development, and showed that the novel lncRNA RP11-83J16.1 not only correlates with increased RA risk, inflammation and disease activity, but also promotes RA-FLS proliferation, migration, invasion, and inflammation by regulating URI1 and downstream β-catenin pathway components.
Acknowledgements
This study was supported by the investigation of molecular mechanism in treatment effect of Yiqi Qingluo method in rheumatoid arthritis based on the regulatory function of long non-coding RNA Hotair (No. 81804012).
Disclosure of conflict of interest
None.
Supporting Information
References
- 1.Smolen JS, Aletaha D, McInnes IB. Rheumatoid arthritis. Lancet. 2016;388:2023–2038. doi: 10.1016/S0140-6736(16)30173-8. [DOI] [PubMed] [Google Scholar]
- 2.Guo Q, Wang Y, Xu D, Nossent J, Pavlos NJ, Xu J. Rheumatoid arthritis: pathological mechanisms and modern pharmacologic therapies. Bone Res. 2018;6:15. doi: 10.1038/s41413-018-0016-9. [DOI] [PMC free article] [PubMed] [Google Scholar]
- 3.Silvagni E, Di Battista M, Bonifacio AF, Zucchi D, Governato G, Scire CA. One year in review 2019: novelties in the treatment of rheumatoid arthritis. Clin Exp Rheumatol. 2019;37:519–534. [PubMed] [Google Scholar]
- 4.Conigliaro P, Triggianese P, De Martino E, Fonti GL, Chimenti MS, Sunzini F, Viola A, Canofari C, Perricone R. Challenges in the treatment of Rheumatoid Arthritis. Autoimmun Rev. 2019;18:706–713. doi: 10.1016/j.autrev.2019.05.007. [DOI] [PubMed] [Google Scholar]
- 5.Mousavi MJ, Jamshidi A, Chopra A, Aslani S, Akhlaghi M, Mahmoudi M. Implications of the noncoding RNAs in rheumatoid arthritis pathogenesis. J Cell Physiol. 2018;234:335–347. doi: 10.1002/jcp.26911. [DOI] [PubMed] [Google Scholar]
- 6.Yan S, Wang P, Wang J, Yang J, Lu H, Jin C, Cheng M, Xu D. Long non-coding RNA HIX003209 promotes inflammation by sponging miR-6089 via TLR4/NF-kappaB signaling pathway in rheumatoid arthritis. Front Immunol. 2019;10:2218. doi: 10.3389/fimmu.2019.02218. [DOI] [PMC free article] [PubMed] [Google Scholar]
- 7.Yue T, Fan X, Zhang Z, Liu Z, Guo M, Bai F, Gong X, Gao C, Xiao L. Downregulation of lncRNA ITSN1-2 correlates with decreased disease risk and activity of rheumatoid arthritis (RA), and reduces RA fibroblast-like synoviocytes proliferation and inflammation via inhibiting NOD2/RIP2 signaling pathway. Am J Transl Res. 2019;11:4650–4666. [PMC free article] [PubMed] [Google Scholar]
- 8.Aletaha D, Neogi T, Silman AJ, Funovits J, Felson DT, Bingham CO 3rd, Birnbaum NS, Burmester GR, Bykerk VP, Cohen MD, Combe B, Costenbader KH, Dougados M, Emery P, Ferraccioli G, Hazes JM, Hobbs K, Huizinga TW, Kavanaugh A, Kay J, Kvien TK, Laing T, Mease P, Menard HA, Moreland LW, Naden RL, Pincus T, Smolen JS, Stanislawska-Biernat E, Symmons D, Tak PP, Upchurch KS, Vencovsky J, Wolfe F, Hawker G. 2010 rheumatoid arthritis classification criteria: an American College of Rheumatology/European League Against Rheumatism collaborative initiative. Ann Rheum Dis. 2010;69:1580–1588. doi: 10.1136/ard.2010.138461. [DOI] [PubMed] [Google Scholar]
- 9.Head SR, Komori HK, LaMere SA, Whisenant T, Van Nieuwerburgh F, Salomon DR, Ordoukhanian P. Library construction for next-generation sequencing: overviews and challenges. Biotechniques. 2014;56:61–64. 66, 68. doi: 10.2144/000114133. passim. [DOI] [PMC free article] [PubMed] [Google Scholar]
- 10.Trapnell C, Pachter L, Salzberg SL. TopHat: discovering splice junctions with RNA-Seq. Bioinformatics. 2009;25:1105–1111. doi: 10.1093/bioinformatics/btp120. [DOI] [PMC free article] [PubMed] [Google Scholar]
- 11.Love MI, Huber W, Anders S. Moderated estimation of fold change and dispersion for RNA-seq data with DESeq2. Genome Biol. 2014;15:550. doi: 10.1186/s13059-014-0550-8. [DOI] [PMC free article] [PubMed] [Google Scholar]
- 12.Huang DW, Sherman BT, Tan Q, Kir J, Liu D, Bryant D, Guo Y, Stephens R, Baseler MW, Lane HC, Lempicki RA. DAVID bioinformatics resources: expanded annotation database and novel algorithms to better extract biology from large gene lists. Nucleic Acids Res. 2007;35:W169–175. doi: 10.1093/nar/gkm415. [DOI] [PMC free article] [PubMed] [Google Scholar]
- 13.Ospelt C, Kurowska-Stolarska M, Neidhart M, Michel BA, Gay RE, Laufer S, Gay S. The dual inhibitor of lipoxygenase and cyclooxygenase ML3000 decreases the expression of CXCR3 ligands. Ann Rheum Dis. 2008;67:524–529. doi: 10.1136/ard.2007.071589. [DOI] [PubMed] [Google Scholar]
- 14.Suzuki T, Iwamoto N, Yamasaki S, Nishino A, Nakashima Y, Horai Y, Kawashiri SY, Ichinose K, Arima K, Tamai M, Nakamura H, Origuchi T, Miyamoto C, Osaki M, Ohyama K, Kuroda N, Kawakami A. Upregulation of thrombospondin 1 expression in synovial tissues and plasma of rheumatoid arthritis: role of transforming growth factor-beta1 toward fibroblast-like synovial cells. J Rheumatol. 2015;42:943–947. doi: 10.3899/jrheum.141292. [DOI] [PubMed] [Google Scholar]
- 15.Lipinski KA, Britschgi C, Schrader K, Christinat Y, Frischknecht L, Krek W. Colorectal cancer cells display chaperone dependency for the unconventional prefoldin URI1. Oncotarget. 2016;7:29635–29647. doi: 10.18632/oncotarget.8816. [DOI] [PMC free article] [PubMed] [Google Scholar]
- 16.Gu J, Liang Y, Qiao L, Lu Y, Hu X, Luo D, Li N, Zhang L, Chen Y, Du J, Zheng Q. URI expression in cervical cancer cells is associated with higher invasion capacity and resistance to cisplatin. Am J Cancer Res. 2015;5:1353–1367. [PMC free article] [PubMed] [Google Scholar]
- 17.Gomes AL, Teijeiro A, Buren S, Tummala KS, Yilmaz M, Waisman A, Theurillat JP, Perna C, Djouder N. Metabolic inflammation-associated IL-17A causes non-alcoholic steatohepatitis and hepatocellular carcinoma. Cancer Cell. 2016;30:161–175. doi: 10.1016/j.ccell.2016.05.020. [DOI] [PubMed] [Google Scholar]
- 18.Pan SC, Cui HH, Qiu CG. HOTAIR promotes myocardial fibrosis through regulating URI1 expression via Wnt pathway. Eur Rev Med Pharmacol Sci. 2018;22:6983–6990. doi: 10.26355/eurrev_201810_16169. [DOI] [PubMed] [Google Scholar]
- 19.Lahoti TS, John K, Hughes JM, Kusnadi A, Murray IA, Krishnegowda G, Amin S, Perdew GH. Aryl hydrocarbon receptor antagonism mitigates cytokine-mediated inflammatory signalling in primary human fibroblast-like synoviocytes. Ann Rheum Dis. 2013;72:1708–1716. doi: 10.1136/annrheumdis-2012-202639. [DOI] [PMC free article] [PubMed] [Google Scholar]
- 20.Rosenbaum PR, Rubin DB. The central role of the propensity score in observational studies for causal effects. Biometrika. 1983;70:41–55. [Google Scholar]
- 21.Sparks JA. Rheumatoid arthritis. Ann Intern Med. 2019;170:ITC1–ITC16. doi: 10.7326/AITC201901010. [DOI] [PubMed] [Google Scholar]
- 22.Alam J, Jantan I, Bukhari SNA. Rheumatoid arthritis: recent advances on its etiology, role of cytokines and pharmacotherapy. Biomed Pharmacother. 2017;92:615–633. doi: 10.1016/j.biopha.2017.05.055. [DOI] [PubMed] [Google Scholar]
- 23.Grygielska J, Raciborski F, Klak A, Owoc J. The impact of nutrition and generally available products such as nicotine and alcohol on rheumatoid arthritis - review of the literature. Reumatologia. 2018;56:121–127. doi: 10.5114/reum.2018.75524. [DOI] [PMC free article] [PubMed] [Google Scholar]
- 24.Korczowska I. Rheumatoid arthritis susceptibility genes: an overview. World J Orthop. 2014;5:544–549. doi: 10.5312/wjo.v5.i4.544. [DOI] [PMC free article] [PubMed] [Google Scholar]
- 25.Xu D, Jiang Y, Yang L, Hou X, Wang J, Gu W, Wang X, Liu L, Zhang J, Lu H. Long noncoding RNAs expression profile and functional networks in rheumatoid arthritis. Oncotarget. 2017;8:95280–95292. doi: 10.18632/oncotarget.20036. [DOI] [PMC free article] [PubMed] [Google Scholar]
- 26.Yuan M, Wang S, Yu L, Qu B, Xu L, Liu L, Sun H, Li C, Shi Y, Liu H. Long noncoding RNA profiling revealed differentially expressed lncRNAs associated with disease activity in PBMCs from patients with rheumatoid arthritis. PLoS One. 2017;12:e0186795. doi: 10.1371/journal.pone.0186795. [DOI] [PMC free article] [PubMed] [Google Scholar]
- 27.Shaker OG, Mahmoud RH, Abdelaleem OO, Ahmed TI, Fouad NA, Hussein HA, Nassr MH, Zaki OM, Abdelghaffar NK, Hefzy EM. Expression profile of long noncoding RNAs, lnc-Cox2, and HOTAIR in rheumatoid arthritis patients. J Interferon Cytokine Res. 2019;39:174–180. doi: 10.1089/jir.2018.0117. [DOI] [PubMed] [Google Scholar]
- 28.Zhang CW, Wu X, Liu D, Zhou W, Tan W, Fang YX, Zhang Y, Liu YQ, Li GQ. Long non-coding RNA PVT1 knockdown suppresses fibroblast-like synoviocyte inflammation and induces apoptosis in rheumatoid arthritis through demethylation of sirt6. J Biol Eng. 2019;13:60. doi: 10.1186/s13036-019-0184-1. [DOI] [PMC free article] [PubMed] [Google Scholar]
- 29.Li G, Liu Y, Meng F, Xia Z, Wu X, Fang Y, Zhang C, Zhang Y, Liu D. LncRNA MEG3 inhibits rheumatoid arthritis through miR-141 and inactivation of AKT/mTOR signalling pathway. J Cell Mol Med. 2019;23:7116–7120. doi: 10.1111/jcmm.14591. [DOI] [PMC free article] [PubMed] [Google Scholar]
- 30.Mo BY, Guo XH, Yang MR, Liu F, Bi X, Liu Y, Fang LK, Luo XQ, Wang J, Bellanti JA, Pan YF, Zheng SG. Long non-coding RNA GAPLINC promotes tumor-like biologic behaviors of fibroblast-like synoviocytes as microRNA sponging in rheumatoid arthritis patients. Front Immunol. 2018;9:702. doi: 10.3389/fimmu.2018.00702. [DOI] [PMC free article] [PubMed] [Google Scholar]
- 31.Yan ZF, Zhao XY, Liu W, Liu XP. UCA1 impacts progress of rheumatoid arthritis by inducing the apoptosis of fibroblast-like synoviocyte. Eur Rev Med Pharmacol Sci. 2018;22:914–920. doi: 10.26355/eurrev_201802_14370. [DOI] [PubMed] [Google Scholar]
Associated Data
This section collects any data citations, data availability statements, or supplementary materials included in this article.


