Abstract
Hepatocellular carcinoma (HCC) is the most common type of primary liver cancer. Ample data have been reported to unravel the carcinogenesis over the past decades. Although pinpointing the cause of the HCC is challenging, this in and of itself may not be an insuperable problem. Indeed, the emergence of novel molecular targets has given rise to targeted therapy for HCC. Compared to traditional treatments, drugs with molecularly targeted agents are considered an optimal way to treat HCC. However, targeted approaches are currently limited among HCC patients. In our work, we explored more potential genes for targeted treatment of HCC. Initially, differentially expressed genes (DEGs) were identified in gene expression profiling interactive analysis (GEPIA) and NetworkAnalyst. Subsequently, 10 key genes were selected through enrichment analysis and PPI network construction. Based on the GEPIA and Oncomine databases, six upregulated genes were selected. High protein expression of these six genes were confirmed through the Human Protein Atlas database. In addition, these six genes were associated with unfavorable overall survival and progression-free survival based on Kaplan-Meier plotter bioinformatics. Moreover, gene expression was closely related to the tumor stages and pathological grades, as determined with UALCAN. More importantly, PTTG1, UBE2C, and ZWINT were identified as potential targets of anti-cancer drugs using cBioPortal. qPCR and western blot assays were used to show the high expression levels of the latter three genes in HCC cell lines. Collectively, these findings are expected to provide a theoretical basis for and give novel insights into clinical research of HCC.
Keywords: Hepatocellular carcinoma, DEGs, GEPIA, UALCAN, targeted treatment
Introduction
Globally, hepatocellular carcinoma (HCC) is a malignant tumor with poor survival statistics that commonly occurs in patients with cirrhosis [1]. A failure to understand the molecular mechanism of HCC largely contributes to the HCC incidence worldwide [2]. Currently, many strategies are available to extend the survival time of HCC patients, such as transplantation [3], surgical resection [4], as well as target drugs including sorafenib, lenvatinib, or regorafenib [5]. Although precision medicine, which uses molecularly targeted therapy against malignant tumors, speeds progress toward the discovery of novel molecular targets with the diagnostic and prognostic value [6], the management of patients with HCC remains problematic [7,8]. For example, patients with advanced HCC have limited options for treatment, leading to a relatively low reported 5-year survival rate [9]. In a nutshell, suggesting that these treatment options preclude an unfavorable prognosis is far-fetched. Given that the angiogenesis and molecular mechanisms underlying HCC have not been unraveled clearly, revealing more potential biomarkers that might be used in HCC targeted treatment strategies is a pressing need.
Notably, a host of cancer studies were underpinned by ample network data, including The Cancer Genome Atlas (TCGA) [10], Gene Expression Omnibus (GEO) [11], Kyoto Encyclopedia of Genes and Genomes (KEGG) [12], protein-protein interactions (PPIs) [13], and other network analyses. Tools that used to be out of reach are now easily accessible, enabling biologists and scientists to identify more universally predictive markers than those previously identified [14]. Most of the suggested genomic biomarkers are reported to play potential prognostic roles in tumors. For example, the role of miR-452-5p in the tumorigenesis of prostate cancer has been determined based on the TCGA and GEO databases [15]; HOXC10 has been established as an important GEO mediator of invasion in cervical cancer by means of gene expression analysis [16]; and breast cancer-related transcription factors have been identified using gene co-expression network analysis [17]. Bioinformatics methods also allow classification of large gene lists systematically. This enables researchers to assemble a summary of the most enriched genes in an effort to address the challenge of functionally analyzing large gene lists. Currently, combining biological research with a variety of bioinformatics methods is giving rise to the emergence of a series of key genes that are differently expressed in tumors. For instance, for the treatment of colorectal cancer, the top 10 hub genes have been identified from the PPI network and sub-networks revealed that these genes are involved in significant pathways and can serve as molecular targets and diagnostic biomarkers [18]; a group of key genes has been determined to be critical to bladder cancer using GEO, KEGG, and the PPI network [19]; co-expression network analysis has been used to identify six hub genes associated with progression and prognosis of human clear cell renal cell carcinoma [20]; and a 12-gene set has been shown to allow for prediction of survival in non-small cell lung cancer patients [21]. Meanwhile, some researchers have shown that relevant genes play a paramount role in HCC initiation, progression, and prognostics based on multiple genetic analysis platforms. In particular, the silencing of NONHSAT122051 or NONHSAT003826 has been shown to significantly attenuate the mobility of HCC cells based on genome-wide transcriptional evaluation [22]. More importantly, PVT1 and polo-like kinase 1 have been found to influence the clinical characteristics and prognostic significance of HCC through a series of network databases [23,24]. Based on a wide range of network analysis platforms, a substantial number of genes can be identified dependent on a large sample size; for example, one research study found a total of 273 differentially expressed genes (DEGs) and 16 hub genes that are considered as candidate biomarkers for HCC based on microarray technology and bioinformatics analysis [6]. Intriguingly, two molecular targets, EGFR and VEGFR, have been shown to influence drug effectiveness [25]. However, more potential genes that are associated with targeted therapy need to be found to provide more effective treatment in HCC.
In the current study, a series of bioinformatics approaches were applied to identify potential marker genes in HCC. Initially, DEGs analysis was identified in GEPIA based on TCGA samples and further confirmed in NetworkAnalyst. Afterwards, enrichment analysis and PPI network construction were performed to select key genes. Further, six upregulated genes in HCC were identified using GEPIA and Oncomine, and genes with high protein expression were further confirmed via the Human Protein Atlas database. In addition, the prognostic values of the six genes were analyzed using Kaplan-Meier plotter bioinformatics. Moreover, the correlation between gene expression and clinical relevance were explored using UALCAN. Lastly, PTTG1, UBE2C, and ZWINT were identified as potential targets of anti-cancer drugs using cBioPortal, and high expression levels of these genes were found through qPCR and western blot assays.
Materials and methods
Cell culture
Human HCC cell lines (MHCC97H, Hep3B, and HuH7) and a normal cell line (LO2) were obtained from the American Type Culture Collection (ATCC, Manassas, VA, USA), and all cells were maintained in Dulbecco’s Modified Eagle’s Medium (DMEM) (Gibco, Carlsbad, CA, USA) supplemented with 10% fetal bovine serum (FBS) (Thermo Fisher Scientific, Waltham, MA, USA) in a humidified atmosphere of 5% (v/v) CO2 and 95% air at 37°C.
Identification of DEGs
Gene Expression Profiling Interactive Analysis (GEPIA: http://gepia.cancer-pku.cn/index.html) [26] based on TCGA was used to identify DEGs with a criteria of P < 0.05 and |log2FC| > 2. Genes were further explored using NetworkAnalyst (http://www.networkanalyst.ca) [27] and visualized using the Cytoscape software.
Expression correlation analyses
ONCOMINE, a genome-wide expression analyses platform, offers users multiple analysis functions that compute gene expression signatures, clusters, and gene-set modules [28]. In our study, ONCOMINE was applied for further confirmation of DEGs.
Enrichment analyses
Metascape is a free gene annotation and analysis resource that helps biologists make sense of one or multiple gene lists [29]. To understand the function of these DEGs, Gene ontology (GO) enrichment and Kyoto Encyclopedia of Genes and Genomes (KEGG) pathway enrichment analyses were performed using Metascape. P < 0.01 was considered to indicate a significantly enriched DEG.
PPI network construction and module analysis
The protein-protein interaction network of these DEGs was analyzed using the Search Tool for the Retrieval of Interacting Genes (STRING, http://string.embl.de/) and visualized using Cytoscape [30]. In addition, the Molecular Complex Detection (MCODE) app plugin of Cytoscape was applied to verify important modules.
Protein expression analysis
The Human Protein Atlas (http://www.proteinatlas.org/) is a publicly available database with millions of high-resolution images showing the spatial distribution of proteins in normal human tissues and different cancers [31]. In our study, this database was used to validate the expression of the real hub genes on transcriptional and translational level.
Clinical analyses of hub genes
Survival analysis was achieved using Kaplan-Meier plotter (KM plotter: http://kmplot.com/analysis/). The correlation between gene expression and clinical relevance was analyzed using the UALCAN (https://ualcan.path.uab.edu/index.html) online dataset. The cBioPortal for Cancer Genomics (http://cbioportal.org) offers several different ways of visualizing discrete genetic (CNAs or mutations) and continuous events, such as data regarding mRNA or protein abundance as well as DNA methylation for generating OncoPrint, a way to visualize various genomic alterations in a set of genes over multiple patients by heatmap [37]. In our study, gene-centric drug-target information was analyzed to investigate the drug-target interaction of genes.
RNA extraction and qPCR
Total RNA was extracted from the HCC cells using TRIzol reagent (Thermo Fisher Scientific) according to the manufacturer’s protocol. Relative expression levels of candidate genes and GAPDH were identified by qPCR using an Applied Biosystems 7500 Fluorescent Quantitative PCR System (Applied Biosystems, Foster City, CA, USA). The sequences for qPCR were as follow: PTTG1, forward: 5’-TGAATGCGGCTGTTAAGACCT-3’, reverse: 5’-TTTGATTGAAGGTCCAGACCCC-3’; UBE2C, forward: 5’-GATGACCCTCATGGCAGTGG-3’, reverse: 5’-CCACACAAGGGGCTTGCTA-3’; ZWINT, forward: 5’-CTTCTGTCGGCTCGTGT-3’, reverse: 5’-CCTGGTTGAGTTTGTGG-3’. All reactions were run at least three times.
Protein extraction and western blot analysis
Cells were cleaned twice with ice-cold PBS and then lysed for 20 min in cold lysis buffer (Beyotime Institute of Biotechnology). Cell debris was removed by centrifugation (12,000 rpm/min) for 30 min at 4°C. Total protein lysates (20 μg) were subjected to an electric field (electrophoresis) in denaturing 10% sodium dodecyl sulfate-polyacrylamide and transferred to a membrane for subsequent incubation with antibodies against PTTG1 (A8307), UBE2C (A5499), ZWINT (A10914), and GAPDH (AC033) from ABclonal Biotechnology (Wuhan, P. R. China) for western blot analysis.
Statistical analyses
The data were expressed as the mean ± standard error of the mean. Statistical significance between groups was analyzed by a one-way ANOVA using GraphPad Prism 5.0 software (GraphPad Software, Inc. CA, USA). A value of P < 0.05 was accepted as statistically significant. All experiments were performed as triplicates.
Results
DEGs identification
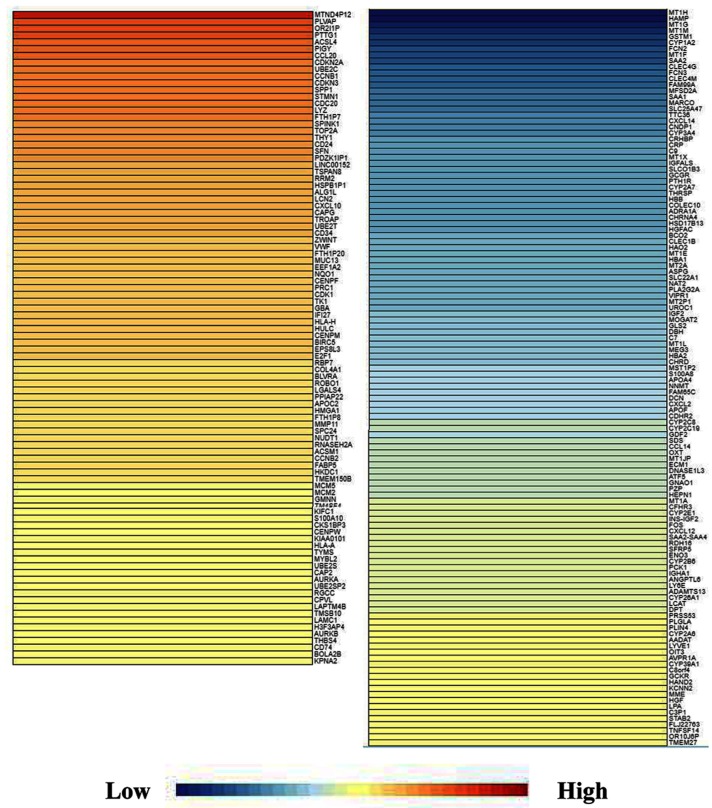
For the identification of DEGs, GEPIA, a new and powerful web-based tool, was applied because it is a visualization website based on the TCGA database. The DEGs analysis in HCC was conducted with a criteria of P < 0.05 and |log2FC| > 2 and GEPIA was searched to retrieve data on the DEGs. A map of the 262 overlapping DEGs was obtained (Figure 1). DEGs were further validated using NetworkAnalyst and visualized using Cytoscape software. The collected genes included 117 upregulated DEGs and 145 downregulated DEGs (Table 1).
Figure 1.
DEGs identification. GEPIA, as a new and powerful web-based tool, was applied because it is a visualization website based on the TCGA database. The DEGs analysis in HCC was conducted with a criteria of P < 0.05 and |log2FC| > 2 and then GEPIA was searched to retrieve data on the DEGs. A map of the 262 overlapping DEGs was obtained. DEGs were further validated using NetworkAnalyst and visualized using Cytoscape software. As shown in Table 1, the collected genes included 117 upregulated DEGs and 145 downregulated DEG. DEGs, differentially expressed genes. HCC, hepatocellular carcinoma; FC, fold change; GEPIA, Gene Expression Profiling Interactive Analysis; TCGA, The Cancer Genome Atlas.
Table 1.
The collected genes included 117 upregulated DEGs and 145 downregulated DEGs
| Regulation | DEGs (|log2FC| > 2) |
|---|---|
| Upregulated (n = 117) | PDZK1IP1, LINC00152, TSPAN8, RRM2, HSPB1P1, MIR4435-2HG, ALG1L, LCN2, CXCL10, CAPG, TROAP, UBE2T, CD34, ZWINT, VWF, FTH1P20, MUC13, EEF1A2, NQO1, RP11-452N17.1, CENPF, PRC1, CDK1, TK1, GBA, RP11-334E6.12, RP5-890E16.4, IFI27, HLA-H, HULC, CENPM, BIRC5, EPS8L3, E2F1, RBP7, COL4A1, BLVRA, ROBO1, ST8SIA6-AS1, AC104534.3, LGALS4, PPIAP22, APOC2, HNRNPCP2, HMGA1, FTH1P8, RP11-1143G9.4, MMP11, SPC24, NUDT1, RNASEH2A, ACSM1, CTB-63M22.1, CCNB2, FABP5, HKDC1, TMEM150B, ERICH5, MCM5, MCM2, GMNN, TM4SF4, KIFC1, AC005255.3, RP11-667K14.4, S100A10, CKS1BP3, CENPW, KIAA0101, HLA-A, TYMS, EIF5AP4, MYBL2, UBE2S, CAP2, AURKA, UBE2SP2, RGCC, CPVL, LAPTM4B, TMSB10, LAMC1, H3F3AP4, AURKB, THBS4, CD74, AC239868.2, AC239868.3, BOLA2B, KPNA2 |
| Downregulated (n = 145) | UROC1, IGF2, MOGAT2, GLS2, DBH, C7, MT1L, MEG3, HBA2, KDM8, CHRD, MST1P2, S100A8, APOA4, NNMT, FAM65C, DCN, CXCL2, APOF, CDHR2, CYP2C8, LINC00844, CYP2C19, GDF2, SDS, CCL14, MST1L, RP11-434D9.1, OXT, MT1JP, ECM1, DNASE1L3, MTND4P20, ATF5, RP11-290F5.1, GNAO1, PZP, HEPN1, MT1A, AC005077.14, CFHR3, CYP2E1, INS-IGF2, LINC01370, RP11-6B4.1, FOS, CXCL12, SAA2-SAA4, RDH16, SFRP5, ENO3, CYP2B6, PCK1, IGHA1, ANGPTL6, LY6E, ADAMTS13, CYP26A1, LCAT, NPIPB5, DPT, PRSS53, RP3-342P20.2, PLGLA, PLIN4, RP4-564F22.6, CYP2A6, AADAT, LYVE1, OIT3, LINC01348, AVPR1A, LRCOL1, CYP39A1, C8orf4, GCKR, HAND2, KCNN2, MME, HGF, LPA, C3P1, AC104809.2, STAB2, RP11-326C3.2, FLJ22763, FAM83A-AS1, TNFSF14, OR10J6P, TMEM27, AC068535.3 |
Enrichment analysis and PPI network construction
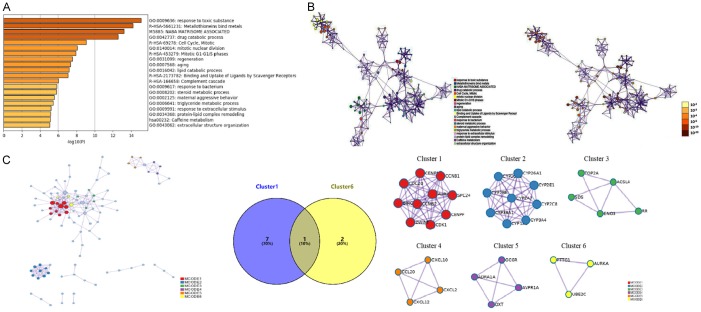
Using STRING tools, GO enrichment and KEGG pathway enrichment analyses were performed using Metascape to further investigate the biological function of each DEG. P < 0.01 was considered to indicate a significantly enriched DEG. A network of GO and KEGG enriched terms colored by P-values was generated (Figure 2A and 2B). The retrieved data is also provided in Table 2. Specifically, the DEGs were significantly enriched in the following GO terms: response to toxic substance (P < 0.001), drug catabolic process (P < 0.001), mitotic nuclear division (P < 0.001), regeneration (P < 0.001), aging (P < 0.001), lipid catabolic process (P < 0.001), response to bacteria (P < 0.001), steroid metabolic process (P < 0.001), maternal aggressive behavior (P < 0.001), triglyceride metabolic process (P < 0.001), response to extracellular stimulus (P < 0.001), protein-lipid complex remodeling (P < 0.001), and extracellular structure organization (P < 0.001). The 13 most enriched GO terms of the DEGs were obtained in patients with HCC (Figure 2A and 2B). KEGG pathway analysis showed significant signaling pathways associated with DEGs in HCC pursuant to P-value, as presented in Table 3.
Figure 2.
Enrichment analysis and PPI network construction. A, B. A network of GO and KEGG enriched terms colored by P-values was generated. The retrieved data correspond with Table 2. The 13 most enriched GO terms of the DEGs were obtained in patients with HCC (P < 0.001), as follows: response to toxic substance, drug catabolic process, mitotic nuclear division, regeneration, aging, lipid catabolic process, response to bacteria, steroid metabolic process, maternal aggressive behavior, triglyceride metabolic process, response to extracellular stimulus, protein-lipid complex remodeling, and extracellular structure organization. KEGG pathway analysis showed significant signaling pathways associated with DEGs in HCC pursuant to P-value, as presented in Table 3. C. Based on the frequency of module genes in enrichment analyses and the number of enrichment genes in each cluster as shown in Table 4, cluster one and cluster six were screened for analysis. According to the union set of important eight genes in cluster one and three genes in cluster six, CCNB1, CDC20, CCNB2, CDK1, SPC24, CENPW, ZWINT, PTTG1, AURKA, and UBE2C were selected. GO, Gene ontology; KEGG, Kyoto Encyclopedia of Genes and Genomes. MCODE, Molecular Complex Detection; HCC, hepatocellular carcinoma.
Table 2.
The network of GO and KEGG enriched terms
| Term | Description | Count | Log10 (P) |
|---|---|---|---|
| GO:0009636 | Response to toxic substance | 30 | -15.07 |
| R-HSA-5661231 | Metallothioneins bind metals | 8 | -14.19 |
| M5885 | NABA MATRISOME ASSOCIATED | 33 | -13.19 |
| GO:0042737 | Drug catabolic process | 16 | -12.57 |
| R-HSA-69278 | Cell Cycle, Mitotic | 23 | -9.06 |
| GO:0140014 | Mitotic nuclear division | 16 | -8.06 |
| R-HSA-453279 | Mitotic G1-G1/S phases | 12 | -7.91 |
| GO:0031099 | Regeneration | 13 | -7.54 |
| GO:0007568 | Aging | 16 | -7.34 |
| GO:0016042 | Lipid catabolic process | 16 | -7.17 |
| R-HSA-2173782 | Binding and Uptake of Ligands by Scavenger Receptors | 7 | -7.03 |
| R-HSA-166658 | Complement cascade | 7 | -6.03 |
| GO:0009617 | Response to bacterium | 21 | -5.84 |
| GO:0008202 | Steroid metabolic process | 14 | -5.78 |
| GO:0002125 | Maternal aggressive behavior | 3 | -5.53 |
| GO:0006641 | Triglyceride metabolic process | 8 | -5.4 |
| GO:0009991 | Response to extracellular stimulus | 17 | -5.2 |
| GO:0034368 | Protein-lipid complex remodeling | 5 | -5.16 |
| hsa00232 | Caffeine metabolism | 3 | -5.14 |
| GO:0043062 | Extracellular structure organization | 15 | -5.08 |
Table 3.
KEGG pathway analysis showed significant signaling pathways associated with DEGs in HCC
| Term | Count | DEGs |
|---|---|---|
| Metallothioneins bind metals | 49 | MT1A, MT1E, MT1F, MT1G, MT1H, MT1M, MT1X, MT2A, CDK1, CYP1A2, FOS, NUDT1, APOA4, NQO1, GSTM1, HBA1, HBA2, HBB, AKR1B10, GDF2, HFE, LCN2, S100A8, HAMP, ADRA1A, AVPR1A, C7, CXCL10, OXT, PTH1R, SAA1, CCL14, CXCL12, THY1, CD24, CCNB1, CRHBP, ADAMTS13, CDKN2A, GPC3, SFN, IGF2, SPP1, CCNB2, CDHR2, MEG3, E2F1, HMGA1, UBE2C |
| NABA MATRISOME ASSOCIATED | 49 | CRHBP, FCN2, GDF2, GPC3, CXCL2, HGF, HGFAC, IGF2, CXCL10, LGALS4, LPA, MDK, MMP11, PZP, S100A8, S100A10, CCL14, CCL20, CXCL12, SFRP5, FCN3, CHRD, TNFSF14, CXCL14, CLEC4M, COLEC10, ADAMTS13, MST1L, CLEC1B, MUC13, ANGPTL6, CLEC4G, INS-IGF2, CD34, CD74, DBH, ECM1, IGHA1, SAA1, THBS4, THY1, PLVAP, HFE, LY6E, OXT, SPP1, HAMP, ROBO1, PLA2G2A |
| Cell Cycle, Mitotic | 52 | BIRC5, CCNB1, CDK1, CDC20, CDKN2A, CENPF, E2F1, MCM2, MCM5, MYBL2, RRM2, AURKA, TK1, TOP2A, TYMS, CCNB2, AURKB, PTTG1, UBE2C, ZWINT, GMNN, CENPM, SPC24, SFN, CENPW, FOS, CDKN3, UBD, ATF5, UBE2S, RGCC, TCIM, KDM8, PRC1, CD74, IGF2, GLS2, HGF, SPP1, HFE, HAMP, AVPR1A, S100A8, CXCL12, CAPG, DCN, GBA, S100A10, CLTRN, ADRA1A, CXCL10, TNFSF14 |
| Mitotic G1-G1/S phases | 13 | CCNB1, CDK1, CDKN2A, E2F1, MCM2, MCM5, MYBL2, RRM2, TK1, TOP2A, TYMS, GMNN, NUDT1 |
| Binding and Uptake of Ligands by Scavenger Receptors | 43 | COL4A1, HBA1, HBA2, HBB, SAA1, MARCO, STAB2, APOA4, CYP1A2,PCK1, AKR1B10, ACSM1, UROC1, BLVRA, ENO3, ACSL4, GCKR, GSTM1, NNMT, TYMS, AADAT, HKDC1, BOLA2B, NQO1, HGF, THBS4, CDK1, LCN2, CD34, CRP, GLS2, BCO2, CD74, RRM2, S100A10, C9, GBA, SLC22A1, TK1, VWF, APOC2, HFE, IGHA1 |
| Complement cascade | 11 | C7, C9, CRP, FCN2, FCN3, COLEC10, CFHR3, IGHA1, VWF, RGCC, MARCO |
| Caffeine metabolism | 7 | NAT2, CYP1A2, CYP2A6, CYP3A4, TK1, CYP2A7, AKR1B10 |
In addition, PPIs among the DEGs were predicted. The related nodes and edges were identified in the PPI network, and, subsequently, six module networks were analyzed by MCODE. Comparing the module genes with the signaling pathway associated genes, we found that the module genes were mainly enriched in binding of metallothionein and the cell cycle. Based on the frequency of module genes in enrichment analyses and the number of enrichment genes in each cluster, important genes were identified, as shown in Table 4. Clusters one and six were eventually selected for analysis, and union sets consisting of eight important genes in cluster one and three genes in cluster six, were further screened (Figure 2C). Thereby, CCNB1, CDC20, CCNB2, CDK1, SPC24, CENPW, ZWINT, PTTG1, AURKA, and UBE2C were identified as genes of interest.
Table 4.
Six modules from PPI networks analyzed by MCODE
| Cluster | Official Gene Symbol |
|---|---|
| 1 | CEBPF, CCNB1, CDC20, CCNB2, CDK1, SPC24, CENPW, AURKA, RIRC5, ZWINT |
| 2 | CYP2B6, CYP39A1, CYP2A7, CYP26A1, CYP2E1, CYP2C8, CYP3A4, CYP1A2, CYP2C19 |
| 3 | TOP2A, SDS, ENO3, ACSL4, RRM2 |
| 4 | CXCR10, CCL20, CXCL12, CXCL2 |
| 5 | GCGR, ADRA1A, OXT, AVPR1A |
| 6 | PTTG1, AURKA, UBE2C |
Upregulation of genes in HCC
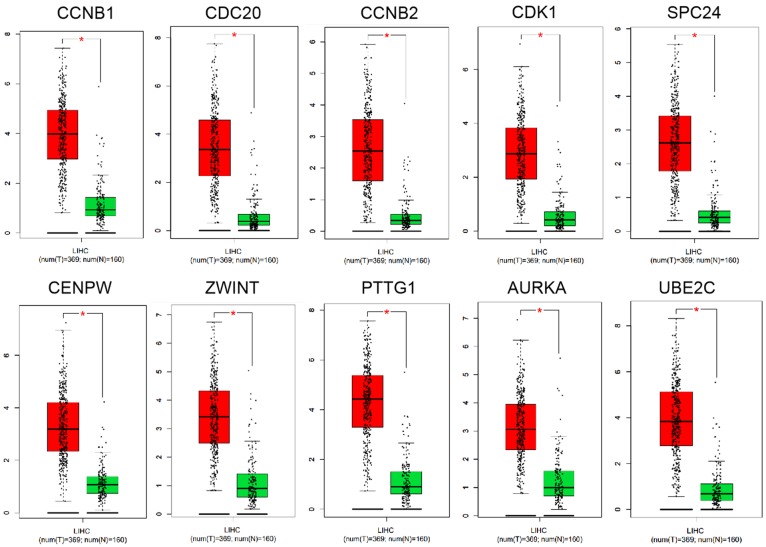
To analyze the expression of the 10 genes, the GEPIA web-based tool with the TCGA database was used to compare the differences in expressions of the hub genes by normal and tumor tissues. The GEPIA database showed higher expression levels of CCNB1, CDC20, CCNB2, CDK1, SPC24, CENPW, ZWINT, PTTG1, AURKA, and UBE2C in HCC tissues compared with corresponding normal HCC tissues (Figure 3, P < 0.05). The data suggested that the 10 genes were highly expressed in HCC tissues.
Figure 3.
Upregulation of genes in HCC. The GEPIA web-based tool with the TCGA database was used to compare the differences in expressions of the hub genes by normal and tumor tissues. The GEPIA database showed higher expression levels of CCNB1, CDC20, CCNB2, CDK1, SPC24, CENPW, ZWINT, PTTG1, AURKA, and UBE2C in HCC tissues compared with corresponding normal HCC tissues, respectively (P < 0.05). It suggested that these hub genes CCNB1, CDC20, CCNB2, CDK1, SPC24, CENPW, ZWINT, PTTG1, AURKA, and UBE2C might be related with HCC. GEPIA, Gene Expression Profiling Interactive Analysis; TCGA, The Cancer Genome Atlas; HCC, hepatocellular carcinoma.
Validation of key genes expression in HCC
To verify the above results, the expression levels of the 10 genes were collected in the Oncomine database, which showed several missing values in microarray data. Based on the median rank and P-value, PTTG1, CCNB1, CDK1, AURKA, UBE2C, and ZWINT were chosen for further research (Figure 4, P < 0.001).
Figure 4.
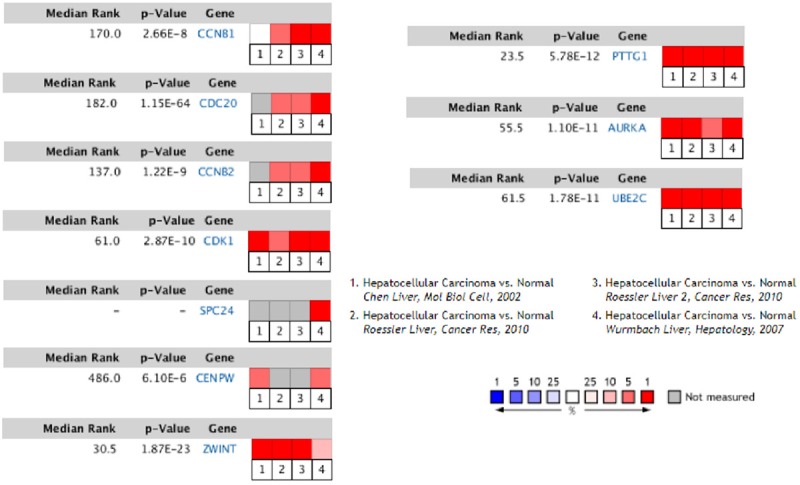
Validation of key genes expression in HCC. The expression levels of the 10 genes were collected in the Oncomine database. The results showed several missing values in microarray data. Based on the median rank and P-value, PTTG1 (Median Rank, 23.5; P-value, 5.78E-12), CCNB1 (Median Rank, 170.0; P-value, 2.66E-8), CDK1 (Median Rank, 61.0; P-value, 2.87E-10), AURKA (Median Rank, 55.5; P-value, 1.10E-11), UBE2C (Median Rank, 61.5; P-value, 1.78E-11), and ZWINT (Median Rank, 30.5; P-value, 1.87E-23) were chosen for further research (P < 0.001). HCC, hepatocellular carcinoma.
Protein expression in tissues with immunohistochemistry
To analyze protein expression patterns in normal human tissues and HCC tissues, the Human Protein Atlas database was applied. The Human Protein Atlas provides a map showing the distribution and relative abundance of proteins in normal human tissues and HCC tissues (Figure 5). The results suggest that PTTG1, CCNB1, CDK1, AURKA, UBE2C, and ZWINT were upregulated in HCC tissues compared with the corresponding normal tissues.
Figure 5.
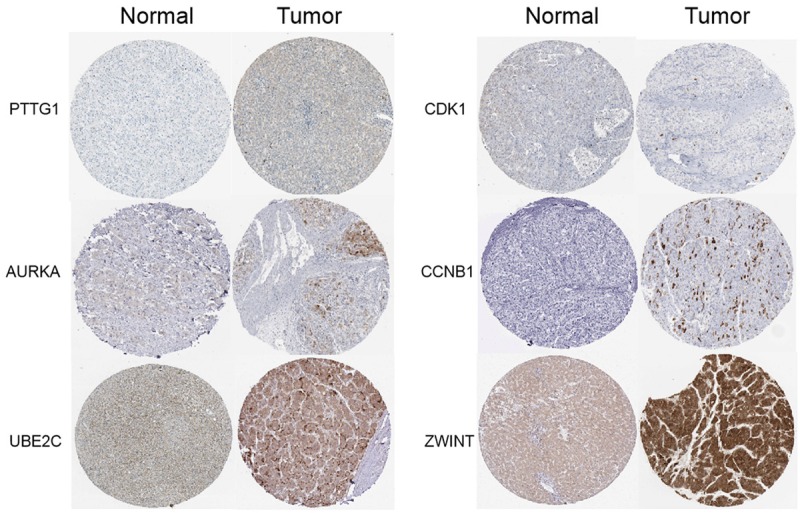
Protein expression in tissues with imimmunohistochemistry. Protein expression patterns in normal human tissues and HCC tissues were analyzed. The Human Protein Atlas database was applied. The Human Protein Atlas provides a map showing the distribution and relative abundance of proteins in normal human tissues and HCC tissues. Based on the data, it showed that PTTG1, CCNB1, CDK1, AURKA, UBE2C, and ZWINT were upregulated in HCC tissues compared with the corresponding normal tissues. The results suggested protein expressions of PTTG1, CCNB1, CDK1, AURKA, UBE2C, and ZWINT were higher in HCC tissues. HCC, hepatocellular carcinoma.
Predictive targets for HCC prognosis
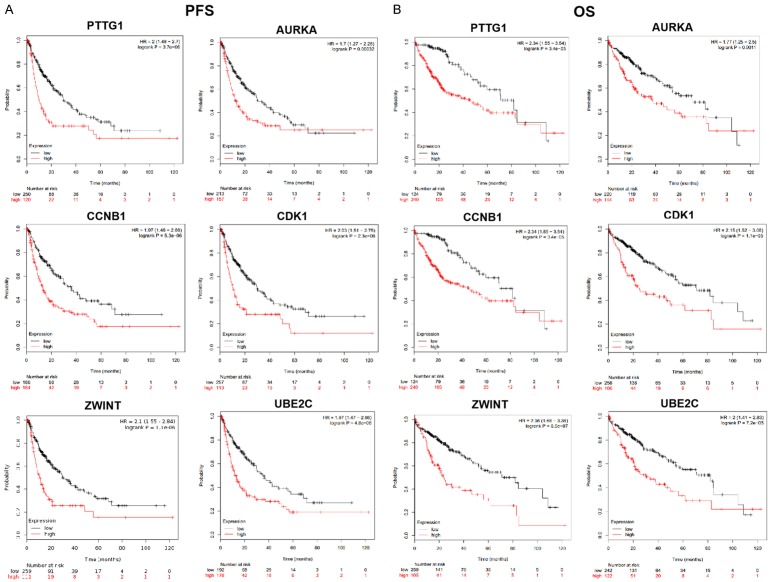
To explore the prognostic values of the PTTG1, CCNB1, CDK1, AURKA, UBE2C, and ZWINT genes, the Kaplan-Meier plotter bioinformatics analysis platform was used. We found that high expression levels of these six genes were associated with an unfavorable overall survival and progression-free survival (PFS) of HCC patients (Figure 6, P < 0.05). The results therefore showed that PTTG1, CCNB1, CDK1, AURKA, UBE2C, and ZWINT might serve as potential targets for HCC prognosis in patients.
Figure 6.
Predictive targets for HCC prognosis. A, B. The prognostic values of the PTTG1, CCNB1, CDK1, AURKA, UBE2C, and ZWINT genes were explored. The Kaplan-Meier plotter bioinformatics analysis platform was used. We found that with high-level expression gene PTTG1, patients had an unfavorable overall survival (OS) and progression-free survival (PFS) compared with corresponding low expression level group. Similarly, the results from the rest of genes CCNB1, CDK1, AURKA, UBE2C, and ZWINT were observed, which corresponded with PTTG1. The findings showed that the high expression levels of these six genes PTTG1, CCNB1, CDK1, AURKA, UBE2C, and ZWINT were associated with an unfavorable overall survival (OS) and progression-free survival (PFS) of HCC patients. Thereby, our data suggested that PTTG1, CCNB1, CDK1, AURKA, UBE2C, and ZWINT might function as potential targets for HCC prognosis in patients. HCC, hepatocellular carcinoma.
The correlation between gene expression and clinical relevance
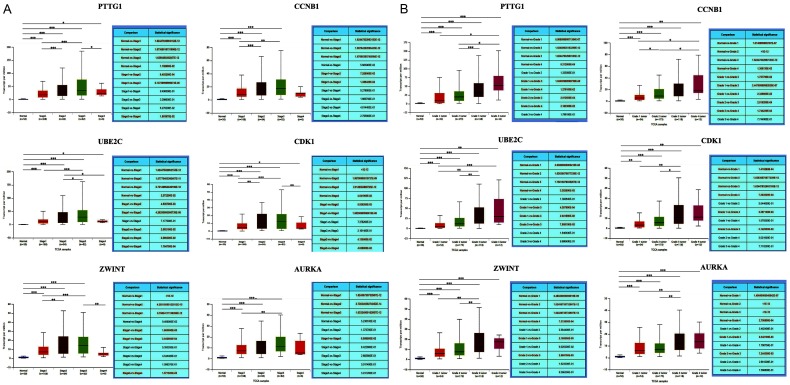
To analyze the correlation between gene expression and clinical relevance, UALCAN was used based on the TCGA database. Retrieved data showed that PTTG1, CCNB1, CDK1, AURKA, UBE2C, and ZWINT were associated with different tumor stages and pathological grades in HCC patients (Figure 7A and 7B).
Figure 7.
The correlation between gene expression and clinical relevance. A, B. The correlation between gene expression and clinical relevance was identified. UALCAN was used based on the TCGA database. Based on the data from UALCAN, we found that higher expression of PTTG1, CCNB1, CDK1, AURKA, UBE2C, and ZWINT showed higher stages (stage 1, stage 2, stage 3, and stage 4) and pathological grades (grade 1 tumor, grade 2 tumor, grade 3 tumor, and grade 4 tumor) compared with normal group, respectively. The data suggested that higher expression levels of PTTG1, CCNB1, CDK1, AURKA, UBE2C, and ZWINT were associated with different tumor stages and pathological grades in HCC patients. HCC, hepatocellular carcinoma.
PTTG1, UBE2C and ZWINT as the targets for anti-cancer drugs
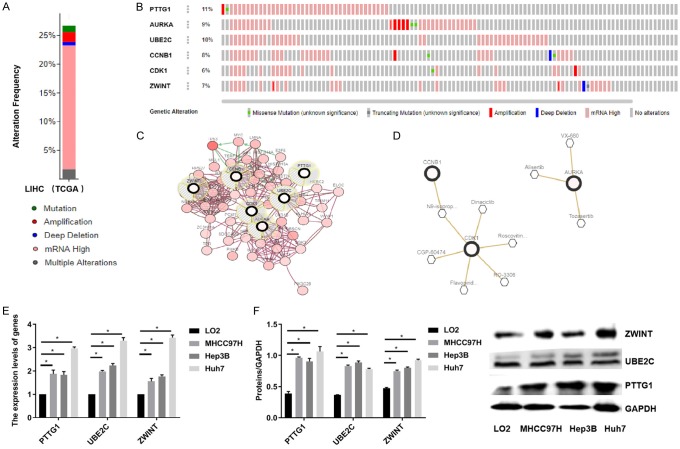
Alteration in the frequency of six genes mutations in HCC was analyzed using cBioPortal. The data suggests that the six genes were altered in 93 (26.96%) of 345 patients (Figure 8A). In addition, OncoPrint was used to provide a visual summary of alterations across a set of HCC samples. PTTG1 was altered in approximate 11%, and the main type of alteration was mRNA upregulation (Figure 8B). A network contained 56 genes (6 real hub genes and 50 most variant genes) (Figure 8C). TP53 was significantly vital in the network (Figure 8D). As for the relationship between anti-cancer drugs and hub genes, we found that CCNB1, CDK1, and AURKA were targets of cancer drugs. However, there was no drug targeting to the rest of the three hub genes, PTTG1, UBE2C, and ZWINT, which might serve as novel therapeutic targets for patients with HCC. Moreover, qPCR and western blot assays suggested that PTTG1, UBE2C, and ZWINT were highly expressed in MHCC97H, Hep3B, and HuH7 cell lines (Figure 8E and 8F). These findings suggest that PTTG1, UBE2C, and ZWINT might be considered as future targets for anti-cancer drugs.
Figure 8.
PTTG1, UBE2C and ZWINT as the targets for anti-cancer drugs. A. Alteration in the frequency of six genes mutations in HCC was analyzed using cBioPortal. The data suggested that the six genes were altered in 93 (26.96%) of 345 patients. B. OncoPrint was used to provide a visual summary of alterations across a set of HCC samples. PTTG1 was altered in approximate 11%, and the main type of alteration was mRNA upregulation. C. A network contained 56 genes (6 real hub genes and 50 most variant genes). D. TP53 was significantly vital in the network. E, F. The relationship between anti-cancer drugs and hub genes was explored, which showed that CCNB1, CDK1, and AURKA were targets of cancer drugs. However, there was no drug targeting to the rest of the three hub genes, PTTG1, UBE2C, and ZWINT, which might serve as novel therapeutic targets for patients with HCC. Furthermore, qPCR and western blot assays suggested that PTTG1, UBE2C, and ZWINT were highly expressed in MHCC97H, Hep3B, and HuH7 cell lines. HCC, hepatocellular carcinoma.
Discussion
In the present study, the initial results displayed a great number of DEGs in HCC using GEPIA and NetworkAnalyst. This indicates that this group of genes might play roles in HCC. Although there have been a number of research studies about HCC in the last couple of decades, the molecular mechanisms of HCC are still unclear. Therefore, the most pressing need facing this disease is identification of more potential targets for HCC treatment.
The traditional biological research approach investigates only one gene or a few genes at a time [32]. In contrast, based on bioinformatics methods, our study obtained a host of DEGs that were further analyzed via GO enrichment analysis and KEGG pathway enrichment analysis. We found that the DEGs were significantly enriched in the following processes: response to toxic substances, metallothionein binding of metals, matrisome association, drug catabolic process, cell cycle, mitotic nuclear division, mitotic G1-G1/S phases, regeneration, aging, lipid catabolic process, binding and uptake of ligands by scavenger receptors, complement cascade, response to bacteria, steroid metabolic process, maternal aggressive behavior, triglyceride metabolic process, response to extracellular stimulus, protein-lipid complex remodeling, caffeine metabolism, and extracellular structure organization. In addition, to screen the top key genes in HCC among the numerous DEGs, a PPI network was constructed. Combined, key genes (CCNB1, CDC20, CCNB2, CDK1, SPC24, CENPW, ZWINT, PTTG1, AURKA, and UBE2C) were selected. The findings implied that 10 vital genes might be partly responsible for HCC. To further investigate the expression levels of these 10 genes, the GEPIA web tool based on TCGA was used. High expression was found for all 10 genes with GEPIA. In contrast, only six genes (PTTG1, CCNB1, CDK1, AURKA, UBE2C, and ZWINT) were shown to be overexpressed in the Oncomine database. In addition, the Human Protein Atlas database, commonly used for the examination of protein expression, showed upregulation of six genes, suggesting that these were more active in HCC. The results were in accordance with the previous studies that showed that overexpression of PTTG1 in HCC is associated with angiogenesis and poor prognosis [33], a decrease of CCNB1 inhibits cell proliferation, migration, and invasion in HCC [34], inhibition of CDK1 limits the proliferation of HCC [35], AURKA promotes cancer metastasis and cancer stem cell properties in HCC [36], and UBE2C functions as a potential oncogene by enhancing cell proliferation, migration, invasion, and drug resistance in HCC [37]. Among these genes, CCNB1, CDK1, and AURKA are currently being targeted with sorafenib [38]. Thus far, sorafenib, an oral multitargeted tyrosine kinase inhibitor, is the only approved, first-line targeted drug against advanced HCC [39,40]. Unfortunately, drug effectiveness is often hindered by the development of resistance, contributing to a poor prognosis [41]. Mechanisms of resistance to sorafenib remain to be fully revealed. Hence, exploration of more alternative targeted treatments for overcoming sorafenib resistance in HCC is a pressing matter. In our study, PTTG1, UBE2C, and ZWINT were selected and associated with anti-cancer drug targets. High expression levels of PTTG1, UBE2C, and ZWINT were found in HCC cell lines. Of note, PTTG1 belongs to the PTTG gene family and is overexpressed in various human cancers including HCC [42]; however, the pathogenic implications of PTTG1 for anti-cancer drugs is largely unknown. Likewise, UBE2C and ZWINT were found to serve as potential oncogenes by enhancing cell proliferation, migration, and invasion in HCC [37,43]. Therefore, building a relationship between these three genes and anti-cancer drugs is tempting. Our findings provide foundation for the further clinical studies on new targeted agents for HCC.
Overall, this comprehensive bioinformatics analysis provides idea list of potential candidates that may be used in HCC targeted treatment. In our study, numerous DEGs were identified in large scale samples. Six key genes were screened out and shown to be upregulated in HCC. Furthermore, these genes were linked with unfavorable prognostics, progression-free survival, and clinically relevant factors. Although PTTG1, UBE2C, and ZWINT were ultimately determined to be as potential targets for anti-cancer drugs, further molecular biological experiments are needed to confirm the underlying molecular mechanism and to uncover the clinical significance in targeted therapy of HCC.
Disclosure of conflict of interest
None.
References
- 1.Lu CY, Chen SY, Peng HL, Kan PY, Chang WC, Yen CJ. Cell-free methylation markers with diagnostic and prognostic potential in hepatocellular carcinoma. Oncotarget. 2017;8:6406–6418. doi: 10.18632/oncotarget.14115. [DOI] [PMC free article] [PubMed] [Google Scholar]
- 2.Davila JA, Morgan RO, Shaib Y, McGlynn KA, El-Serag HB. Hepatitis C infection and the increasing incidence of hepatocellular carcinoma: a population-based study. Gastroenterology. 2004;127:1372–1380. doi: 10.1053/j.gastro.2004.07.020. [DOI] [PubMed] [Google Scholar]
- 3.Burrel M, Llovet JM, Ayuso C, Iglesias C, Sala M, Miquel R, Caralt T, Ayuso JR, Solé M, Sanchez M. MRI angiography is superior to helical CT for detection of HCC prior to liver transplantation: an explant correlation. Hepatology. 2003;38:1034–1042. doi: 10.1053/jhep.2003.50409. [DOI] [PubMed] [Google Scholar]
- 4.Huang J, Yan L, Cheng Z, Wu H, Du L, Wang J, Xu Y, Zeng Y. A randomized trial comparing radiofrequency ablation and surgical resection for HCC conforming to the Milan criteria. Ann Surg. 2010;252:903–912. doi: 10.1097/SLA.0b013e3181efc656. [DOI] [PubMed] [Google Scholar]
- 5.Wang W, Tsuchiya K, Kurosaki M, Yasui Y, Inada K, Kirino S, Yamashita K, Sekiguchi S, Hayakawa Y, Osawa L, Okada M, Higuchi M, Takaura K, Maeyashiki C, Kaneko S, Tamaki N, Nakanishi H, Itakura J, Takahashi Y, Asahina Y, Enomoto N, Izumi N. Sorafenib-regorafenib sequential therapy in japanese patients with unresectable hepatocellular carcinoma-relative dose intensity and post-regorafenib therapies in real world practice. Cancers (Basel) 2019;11 doi: 10.3390/cancers11101517. [DOI] [PMC free article] [PubMed] [Google Scholar]
- 6.Li L, Lei Q, Zhang S, Kong L, Qin B. Screening and identification of key biomarkers in hepatocellular carcinoma: evidence from bioinformatic analysis. Oncol Rep. 2017;38:2607–2618. doi: 10.3892/or.2017.5946. [DOI] [PMC free article] [PubMed] [Google Scholar]
- 7.Liu CL, Fan ST. Nonresectional therapies for hepatocellular carcinoma. Am J Surg. 1997;173:358–65. doi: 10.1016/S0002-9610(96)00384-4. [DOI] [PubMed] [Google Scholar]
- 8.Llovet JM, Villanueva A, Lachenmayer A, Finn RS. Advances in targeted therapies for hepatocellular carcinoma in the genomic era. Nat Rev Clin Oncol. 2015;12:408–24. doi: 10.1038/nrclinonc.2015.103. [DOI] [PubMed] [Google Scholar]
- 9.Kamada K, Kitamoto M, Aikata H, Kawakami Y, Kono H, Imamura M, Nakanishi T, Chayama K. Combination of transcatheter arterial chemoembolization using cisplatin-lipiodol suspension and percutaneous ethanol injection for treatment of advanced small hepatocellular carcinoma. Am J Surg. 2002;184:284–90. doi: 10.1016/s0002-9610(02)00933-9. [DOI] [PubMed] [Google Scholar]
- 10.Tomczak K, Czerwińska P, Wiznerowicz M. The Cancer Genome Atlas (TCGA): an immeasurable source of knowledge. Contemp Oncol (Pozn) 2015;19:A68–77. doi: 10.5114/wo.2014.47136. [DOI] [PMC free article] [PubMed] [Google Scholar]
- 11.Edgar R, Domrachev M, Lash AE. Gene Expression Omnibus: NCBI gene expression and hybridization array data repository. Nucleic Acids Res. 2002;30:207–10. doi: 10.1093/nar/30.1.207. [DOI] [PMC free article] [PubMed] [Google Scholar]
- 12.Kanehisa M, Goto S. KEGG: kyoto encyclopedia of genes and genomes. Nucleic Acids Res. 2000;28:27–30. doi: 10.1093/nar/28.1.27. [DOI] [PMC free article] [PubMed] [Google Scholar]
- 13.Nooren IM, Thornton JM. Diversity of protein-protein interactions. EMBO J. 2003;22:3486–92. doi: 10.1093/emboj/cdg359. [DOI] [PMC free article] [PubMed] [Google Scholar]
- 14.Kumar S, Dudley J. Bioinformatics software for biologists in the genomics era. Bioinformatics. 2007;23:1713–1717. doi: 10.1093/bioinformatics/btm239. [DOI] [PubMed] [Google Scholar]
- 15.Gao L, Zhang LJ, Li SH, Wei LL, Luo B, He RQ, Xia S. Role of miR-452-5p in the tumorigenesis of prostate cancer: a study based on the Cancer Genome Atl (TCGA), Gene Expression Omnibus (GEO), and bioinformatics analysis. Pathol Res Pract. 2018;214:732–749. doi: 10.1016/j.prp.2018.03.002. [DOI] [PubMed] [Google Scholar]
- 16.Zhai Y, Kuick R, Nan B, Ota I, Weiss SJ, Trimble CL, Fearon ER, Cho KR. Gene expression analysis of preinvasive and invasive cervical squamous cell carcinomas identifies HOXC10 as a key mediator of invasion. Cancer Res. 2007;67:10163–72. doi: 10.1158/0008-5472.CAN-07-2056. [DOI] [PubMed] [Google Scholar]
- 17.Guo X, Xiao H, Guo S, Dong L, Chen J. Identification of breast cancer mechanism based on weighted gene coexpression network analysis. Cancer Gene Ther. 2017;24:333–341. doi: 10.1038/cgt.2017.23. [DOI] [PubMed] [Google Scholar]
- 18.Liang B, Li C, Zhao J. Identification of key pathways and genes in colorectal cancer using bioinformatics analysis. Med Oncol. 2016;33:111. doi: 10.1007/s12032-016-0829-6. [DOI] [PubMed] [Google Scholar]
- 19.Tang F, He Z, Lei H, Chen Y, Lu Z, Zeng G, Wang H. Identification of differentially expressed genes and biological pathways in bladder cancer. Mol Med Rep. 2018;17:6425–6434. doi: 10.3892/mmr.2018.8711. [DOI] [PMC free article] [PubMed] [Google Scholar]
- 20.Chen P, Wang F, Feng J, Zhou R, Chang Y, Liu J, Zhao Q. Co-expression network analysis identified six hub genes in association with metastasis risk and prognosis in hepatocellular carcinoma. Oncotarget. 2017;8:48948–48958. doi: 10.18632/oncotarget.16896. [DOI] [PMC free article] [PubMed] [Google Scholar]
- 21.Tang H, Xiao G, Behrens C, Schiller J, Allen J, Chow CW, Suraokar M, Corvalan A, Mao J, White MA. A 12-gene set predicts survival benefits from adjuvant chemotherapy in non-small cell lung cancer patients. Clin Cancer Res. 2013;19:1577–86. doi: 10.1158/1078-0432.CCR-12-2321. [DOI] [PMC free article] [PubMed] [Google Scholar]
- 22.Yao J, Wu L, Meng X, Yang H, Ni S, Wang Q, Zhou J, Zhang Q, Su K, Shao L. Profiling, clinicopathological correlation and functional validation of specific long non-coding RNAs for hepatocellular carcinoma. Mol Cancer. 2017;16:164. doi: 10.1186/s12943-017-0733-5. [DOI] [PMC free article] [PubMed] [Google Scholar]
- 23.Zhang Y, Mo WJ, Wang X, Zhang TT, Qin Y, Wang HL, Chen G, Wei DM, Dang YW. Microarray-based bioinformatics analysis of the prospective target gene network of key miRNAs influenced by long non-coding RNA PVT1 in HCC. Oncol Rep. 2018;40:226–240. doi: 10.3892/or.2018.6410. [DOI] [PMC free article] [PubMed] [Google Scholar]
- 24.Lin P, Wen DY, Dang YW, He Y, Yang H, Chen G. Comprehensive and integrative analysis reveals the diagnostic, clinicopathological and prognostic significance of polo-like kinase 1 in hepatocellular carcinoma. Cell Physiol Biochem. 2018;47:925–947. doi: 10.1159/000490135. [DOI] [PubMed] [Google Scholar]
- 25.Giannelli G, Sgarra C, Porcelli L, Azzariti A, Antonaci S, Paradiso A. EGFR and VEGFR as potential target for biological therapies in HCC cells. Cancer Lett. 2008;262:257–64. doi: 10.1016/j.canlet.2007.12.001. [DOI] [PubMed] [Google Scholar]
- 26.Tang Z, Li C, Kang B, Gao G, Li C, Zhang Z. GEPIA: a web server for cancer and normal gene expression profiling and interactive analyses. Nucleic Acids Res. 2017;45:W98–W102. doi: 10.1093/nar/gkx247. [DOI] [PMC free article] [PubMed] [Google Scholar]
- 27.Xia J, Gill EE, Hancock RE. NetworkAnalyst for statistical, visual and network-based meta-analysis of gene expression data. Nat Protoc. 2015;10:823–44. doi: 10.1038/nprot.2015.052. [DOI] [PubMed] [Google Scholar]
- 28.Rhodes DR, Yu J, Shanker K, Deshpande N, Varambally R, Ghosh D, Barrette T, Pander A, Chinnaiyan AM. ONCOMINE: a cancer microarray database and integrated data-mining platform. Neoplasia. 2004;6:1–6. doi: 10.1016/s1476-5586(04)80047-2. [DOI] [PMC free article] [PubMed] [Google Scholar]
- 29.Zhou Y, Zhou B, Pache L, Chang M, Khodabakhshi AH, Tanaseichuk O, Benner C, Chanda SK. Metascape provides a biologist-oriented resource for the analysis of systems-level datasets. Nat Commun. 2019;10:1523. doi: 10.1038/s41467-019-09234-6. [DOI] [PMC free article] [PubMed] [Google Scholar]
- 30.Szklarczyk D, Franceschini A, Wyder S, Forslund K, Heller D, Huerta-Cepas J, Simonovic M, Roth A, Santos A, Tsafou KP. STRING v10: protein-protein interaction networks, integrated over the tree of life. Nucleic Acids Res. 2015;43:D447–52. doi: 10.1093/nar/gku1003. [DOI] [PMC free article] [PubMed] [Google Scholar]
- 31.Uhlen M, Oksvold P, Fagerberg L, Lundberg E, Jonasson K, Forsberg M, Zwahlen M, Kampf C, Wester K, Hober S. Towards a knowledge-based human protein atlas. Nat Biotechnol. 2010;28:1248–50. doi: 10.1038/nbt1210-1248. [DOI] [PubMed] [Google Scholar]
- 32.Huang DW, Sherman BT, Lempicki RA. Bioinformatics enrichment tools: paths toward the comprehensive functional analysis of large gene lists. Nucleic Acids Res. 2015;43:D447–52. doi: 10.1093/nar/gkn923. [DOI] [PMC free article] [PubMed] [Google Scholar]
- 33.Fujii T, Nomoto S, Koshikawa K, Yatabe Y, Teshigawara O, Mori T, Inoue S, Takeda S, Nakao A. Overexpression of pituitary tumor transforming gene 1 in HCC is associated with angiogenesis and poor prognosis. Hepatology. 2006;43:1267–1275. doi: 10.1002/hep.21181. [DOI] [PubMed] [Google Scholar]
- 34.Gu J, Liu X, Li J, He Y. MicroRNA-144 inhibits cell proliferation, migration and invasion in human hepatocellular carcinoma by targeting CCNB1. Cancer Cell Int. 2019;19:15. doi: 10.1186/s12935-019-0729-x. [DOI] [PMC free article] [PubMed] [Google Scholar]
- 35.Zhang Y, Huang W, Ran Y, Xiong Y, Zhong Z, Fan X, Wang Z, Ye Q. miR-582-5p inhibits proliferation of hepatocellular carcinoma by targeting CDK1 and AKT3. Tumour Biol. 2015;36:8309–16. doi: 10.1007/s13277-015-3582-0. [DOI] [PubMed] [Google Scholar]
- 36.Chen C, Song G, Xiang J, Zhang H, Zhao S, Zhan Y. AURKA promotes cancer metastasis by regulating epithelial-mesenchymal transition and cancer stem cell properties in hepatocellular carcinoma. Biochem Biophys Res Commun. 2017;486:514–520. doi: 10.1016/j.bbrc.2017.03.075. [DOI] [PubMed] [Google Scholar]
- 37.Xiong Y, Lu J, Fang Q, Lu Y, Xie C, Wu H, Yin Z. UBE2C functions as a potential oncogene by enhancing cell proliferation, migration, invasion, and drug resistance in hepatocellular carcinoma cells. Biosci Rep. 2019;39 doi: 10.1042/BSR20182384. [DOI] [PMC free article] [PubMed] [Google Scholar]
- 38.Zhi Y, Abudoureyimu M, Zhou H, Wang T, Feng B, Wang R, Chu X. FOXM1-Mediated LINC-ROR regulates the proliferation and sensitivity to sorafenib in hepatocellular carcinoma. Mol Ther Nucleic Acids. 2019;16:576–588. doi: 10.1016/j.omtn.2019.04.008. [DOI] [PMC free article] [PubMed] [Google Scholar]
- 39.Cervello M, Bachvarov D, Lampiasi N, Cusimano A, Azzolina A, McCubrey JA, Montalto G. Molecular mechanisms of sorafenib action in liver cancer cells. Cell Cycle. 2012;11:2843–2855. doi: 10.4161/cc.21193. [DOI] [PubMed] [Google Scholar]
- 40.Deng M, Li L, Zhao J, Yuan S, Li W. Antitumor activity of the microtubule inhibitor MBRI-001 against human hepatocellular carcinoma as monotherapy or in combination with sorafenib. Cancer Cell Int. 2018;81:853–862. doi: 10.1007/s00280-018-3547-2. [DOI] [PubMed] [Google Scholar]
- 41.Chow AK, Ng L, Lam CS, Wong SK, Wan TM, Cheng NS, Yau TC, Poon RT, Pang RW. The enhanced metastatic potential of hepatocellular carcinoma (HCC) cells with sorafenib resistance. PLoS One. 2013;8:e78675. doi: 10.1371/journal.pone.0078675. [DOI] [PMC free article] [PubMed] [Google Scholar]
- 42.Jung CR, Yoo J, Jang YJ, Kim S, Chu IS, Yeom YI, Choi JY, Im DS. Adenovirus-mediated transfer of siRNA against PTTG1 inhibits liver cancer cell growth in vitro and in vivo. Hepatology. 2006;43:1042–1052. doi: 10.1002/hep.21137. [DOI] [PubMed] [Google Scholar]
- 43.Ying H, Xu Z, Chen M, Zhou S, Liang X, Cai X. Overexpression of Zwint predicts poor prognosis and promotes the proliferation of hepatocellular carcinoma by regulating cell-cycle-related proteins. Onco Targets Ther. 2018;11:689–702. doi: 10.2147/OTT.S152138. [DOI] [PMC free article] [PubMed] [Google Scholar]


