

Abstract
The molecular biological mechanisms of Alzheimer’s disease (AD) involve disease-associated crosstalk through many genes and include a loss of normal as well as a gain of abnormal interactions among genes. A protein domain network (PDN) is a collection of physical bindings that occur between protein domains, and the states of the PDNs in patients with AD are likely to be perturbed compared to those in normal healthy individuals. To identify PDN changes that cause neurodegeneration, we analysed the PDNs that occur among genes co-expressed in each of three brain regions at each stage of AD. Our analysis revealed that the PDNs collapsed with the progression of AD stage and identified five hub genes, including Rac1, as key players in PDN collapse. Using publicly available as well as our own gene expression data, we confirmed that the mRNA expression level of the RAC1 gene was downregulated in the entorhinal cortex (EC) of AD brains. To test the causality of these changes in neurodegeneration, we utilized Drosophila as a genetic model and found that modest knockdown of Rac1 in neurons was sufficient to cause age-dependent behavioural deficits and neurodegeneration. Finally, we identified a microRNA, hsa-miR-101-3p, as a potential regulator of RAC1 in AD brains. As the Braak neurofibrillary tangle (NFT) stage progressed, the expression levels of hsa-miR-101-3p were increased specifically in the EC. Furthermore, overexpression of hsa-miR-101-3p in the human neuronal cell line SH-SY5Y caused RAC1 downregulation. These results highlight the utility of our integrated network approach for identifying causal changes leading to neurodegeneration in AD.
Introduction
Alzheimer’s disease (AD) is a multifactorial disease caused by genetic and environmental factors, including ageing. AD is characterized by extracellular deposition of senile plaques (SPs) and intracellular accumulation of neurofibrillary tangles (NFTs). These aggregates sequentially spread across brain regions, and this development is described by the Braak SP or NFT stage (1). As the Braak NFT stage progresses, NFTs diffuse from regions such as the entorhinal cortex (EC) and hippocampus to the neocortical regions.
As brain pathologies progress, AD-associated molecular changes are induced in the brain, and these changes are thought to cause synaptic degeneration and neuronal death. To systematically detect such changes, genome-wide gene expression analyses have been carried out and have identified a number of genes differentially expressed in the AD brain, some of which are associated with the progression of SP or NFT pathology (2–7). These findings suggest that the progression of AD can be described as alterations in these molecular networks and that the elucidation of such changes will reveal mechanisms underlying AD and may lead to the development of novel therapeutics for AD.
Network analysis is effective not only for detecting differences in molecular networks between AD patients and healthy controls but also for identifying hub genes that interact with many genes as key drivers of pathologies (8–14). A protein interaction network (PIN) is a collection of physical protein–protein interactions validated by high-throughput techniques, such as yeast two-hybrid systems and mass spectrometry-based technologies. PINs have diverse structures among different tissues and cell types and between normal and disease states (15,16). Such diversities may stem from differential gene expression patterns or differential exon usage by alternative splicing. Since the molecular mechanisms of AD involve a loss of normal as well as a gain of abnormal interactions among genes, we sought to systematically detect alterations in the physical associations of gene products associated with AD pathology.
In this study, we developed a network analysis method via a combination of PINs and gene expression data from AD brains. We constructed domain-level PINs [called protein domain networks (PDNs)] expressed in each Braak NFT stage by integrating the whole-exome expression data measured by exon array and domain–domain interaction data from the INstruct database (17). The INstruct database provides detailed domain–domain interaction data that combine protein physical interaction data and protein co-crystal structure data. Our analyses revealed that the loss of PDNs occurred with the progression of Braak NFT stage and identified RAC1 as a hub gene, a key player in the alteration of PDNs. Using the fruit fly Drosophila, we experimentally validated that modest knockdown of RAC1 in brain neurons induced age-dependent neurodegeneration. Our data further suggested that a microRNA (miRNA)-mediated process is involved in the downregulation of RAC1 expression in response to the progression of Braak NFT stage.
Results
In this study, we aimed to detect the dynamics of PDNs across Braak NFT stages in AD brains and to identify key networks and hub genes associated with the progression of Braak NFT stage (summarized in Fig. 1). To this end, we reanalysed our exon array data from 213 postmortem brain samples composed of three brain regions of 71 donors [the EC, temporal cortex (TC), and frontal cortex (FC)] at various Braak NFT stages (Fig. 1A) (7). We then constructed PDNs in the three brain regions at each Braak NFT stage (Fig. 1B, left). The structures of the PDNs were analysed to detect changes in the PDNs associated with the progression of Braak NFT stage (Fig. 1B, centre). The hub genes, which are connected to many genes, were identified in the PDNs in each brain regions (Fig. 1B, right). Finally, we examined whether the identified hub genes were downregulated in independent mRNA expression data sets from AD brains (Fig. 1C left) and whether loss of function of the identified hub gene was sufficient to cause neurodegeneration (Fig. 1C, centre). We further identified miRNAs that could regulate the expression levels of the hub genes using bioinformatics tools followed by experimental validation using human neuronal cultured cells (Fig. 1C, right).
Figure 1.

Overview of the present study. (A) Analysis of gene expression data to estimate ‘expressed’ domains. Postmortem brain samples were obtained from three brain regions (the EC, TC and FC) of 71 individuals. These samples were analysed by exon array. Expressed exons and domains in each brain region at each Braak NFT stage were estimated based on the expression values and statistics. (B) Network analysis to detect hub genes. Expressed domains were projected onto the domain–domain interaction data to construct the PDNs in each brain region at each Braak NFT stage. The structures of the PDNs were analysed to detect changes in PDNs associated with the progression of Braak NFT stage. Hub genes were identified from the PDNs to obtain AD-associated genes. (C) Validation of the hub genes. The expression changes in the hub genes were verified using independent data sets. The confirmed hub genes were characterized for age-dependent behavioural deficits and neurodegeneration using transgenic flies. Finally, miRNAs that regulate the expression levels of the hub genes were identified and validated in the human neuronal cell line SH-SY5Y.
Construction of PDNs in the EC, TC and FC at each Braak NFT stage
To compare the network structures across Braak NFT stages, we first constructed ‘expressed’ PDNs in the three brain regions at each Braak NFT stage. As a reference for the potential PDNs in the brains, we utilized the INstruct database, which includes physical interactions between 3626 human proteins based on co-crystal structures. These interaction data are composed of physical associations between protein domains [e.g. an interaction between domain A of protein A and domain B of protein B (Fig. 2A)]. To infer whether given protein interactions occur at each Braak NFT stage in each brain region, we used gene expression data from postmortem brain samples from patients with AD. We predicted that two proteins could potentially interact if the known binding domains of two genes were co-expressed in the same brain region at the same Braak NFT stage. Conversely, if one or both of the binding domains between two genes were not expressed, we predicted that these two proteins could not interact (Fig. 2B). Exon array analysis was carried out in the postmortem brain samples obtained from the three brain regions of the 71 individuals. The samples were divided into four groups based on Braak NFT stage [stage 0 (n = 13), stages I and II (n = 20), stages III and IV (n = 19) and stages V and VI (n = 19)]. An exon array is a DNA microarray with probesets for exons in the human genome and enables comprehensive quantification of changes in exon usage.
Figure 2.

Construction of PDNs. (A) Schematic of a domain–domain interaction. The yellow circles indicate proteins. An ellipse indicates a domain. For instance, protein A and protein B interact through a physical association between domain A and domain B. (B) Identification of expressed PDNs. The ellipses in magenta and cyan indicate an expressed domain and a domain that is not expressed, respectively. If both domains that form an interaction are expressed, the interaction is assumed to be expressed. (C) Discrimination of expressed domains. A density plot shows the signals of all probes from expressed exons (red) and introns (green) and from non-expressed exons. The threshold determining whether a domain is expressed was set at 6. (D) Assignment of exons to a domain. The short rectangles indicate probes in each exon. The short rectangles outlined in blue show a domain in the corresponding protein sequence. In (D), the domain includes exons 1 and 2. Therefore, the expression level of the domain is determined by the expression levels of those exons.
We defined an ‘expressed’ exon as an exon with a median detection above background (DABG) P-value of <0.05 and a median log2-transformed expression value of ≥6 across all samples in a brain region at a Braak NFT stage. The DABG P-value is a metric used to detect signals that are distinct from background noise. The DABG P-value can highly discriminate between exons (assumed to be present) and introns (assumed to be absent) (18). A cutoff value of 6 was used based on a report by Kang et al. (19), which successfully explained gene expression dynamics across brain regions and ageing. Consistent with this report, the expression levels of probes in expressed exons were clearly distinct from those in non-expressed exons or introns in our data (Fig. 2C). The area under the curve (AUC) was used as a measure of the ability of a metric to discriminate between the expressed exons and introns. The AUC for the above criteria (AUC = 0.855) was higher than that for only the DABG P-value (AUC = 0.691) (Supplementary Material, Fig. S1).
We examined exon usage and found that more than 90% of exons were stably expressed (i.e. satisfied the criteria described above) across all Braak NFT stages in all brain regions. This finding suggests that the majority of exons do not dynamically change with the progression of Braak NFT stage (Supplementary Material, Fig. S2A). In addition, more than 20% of genes had one or more domains that varied across Braak NFT stages (Supplementary Material, Fig. S2B). Each exon was assigned to the corresponding protein domain based on the DNA sequences and the amino acid sequences (Fig. 2D) (see Materials and Methods section for details). Finally, we identified the PDNs expressed in each Braak NFT stage by integrating the whole-exome expression data and the domain–domain interaction data from the INstruct database. As defined above, if all exons corresponding to a domain interaction between two proteins were ‘expressed’, we predicted that the interaction was ‘expressed’. In this way, we constructed a total of 12 PDNs expressed in each of the four Braak NFT stages in each of the three brain regions.
PDNs altered with the progression of Braak NFT stage
To detect changes in PDNs associated with the progression of Braak NFT stage, we compared the expression profiles of PDNs in each brain region across Braak NFT stages. We focused on the subsets of PDNs whose expression patterns were positively (‘appearing’ PDNs) or negatively (‘disappearing’ PDNs) correlated with the progression of Braak NFT stage. These subsets of PDNs were classified into six expression patterns (Fig. 3A). Figure 3B and C shows the proportion of interactions constructing the appearing or disappearing PDNs against the total number of interactions in the PDNs in Figure 3A, respectively. We found that the proportions of disappearing PDNs were much higher than those of appearing PDNs in all brain regions, indicating that PDNs collapse with AD progression. Among the three patterns in disappearing PDNs, the most common pattern was ‘Pattern 1’, in which PDNs disappeared after Braak stage 0 (Fig. 3C). In addition, the EC was the most severely affected among the three brain regions (Fig. 3C). These results are consistent with the observation that the EC is affected more severely from the early stage of AD than the TC and FC (1).
Figure 3.

PDNs collapse with the progression of Braak stage. (A) Expression pattern of domain–domain interactions. ‘Appearing’ and ‘disappearing’ PDNs had three patterns each. Each pattern was defined by whether it was expressed or not in each Braak stage. (B, C) The proportions of interactions in appearing (B) and disappearing (C) PDNs. The colours in each bar correspond to the colours in the patterns in (A). The values on each bar indicate the number of interactions. (D) Braak stage-specific network perturbation in the EC. Each node and link indicate a protein domain and a domain–domain interaction, respectively. Those colours correspond to the expression patterns shown in (A). The labels on each node indicate the protein name and domain name. The coloured nodes and interactions were perturbed in a specific Braak stage but not by ageing. The grey colour indicates the other expression patterns.
To determine whether each pattern occurs by chance, we further examined the statistical significance relevant to the number of interactions constructing the PDNs in each expression pattern. We calculated theoretical values based on the probabilities of interactions expressed in each Braak NFT stage (see Materials and Methods section for details). These theoretical values are equal to the proportion of interactions that occur by chance. We attempted to show whether the proportions of the observed interactions are greater or less than the theoretical values. ‘Pattern 1’ in disappearing interactions was more than 44.6-fold higher than the theoretical value (48.4-fold in the EC, 44.6-fold in the TC and 47.3-fold in the FC) (Supplementary Material, Table S1). Next, we performed permutation tests with 10 000 replicates to calculate the P-values in each brain region (Supplementary Material, Fig. S3). The P-values of ‘Pattern 1’ in disappearing interactions were significant across all brain regions (P-value < 1.00 × 10−300 in all brain regions).
We also found a statistically significant high number of interactions for ‘Pattern 3’ in appearing interactions. ‘Pattern 3’ is an expression pattern that was not present through Braak stages III + IV and was present only in Braak stages V + VI (17.2-fold and P-value = 2.70 × 10−66 in the EC; 23.4-fold and P-value = 9.08 × 10−121 in the TC; 9.34-fold and P-value = 9.56 × 10⁻²¹ in the FC). Comparison of the fold changes calculated above showed that ‘Pattern 1’ in disappearing interactions had higher fold changes than ‘Pattern 3’ in appearing interactions across all brain regions [2.81-fold (=48.4/17.2) in the EC, 1.91-fold (=44.6/23.4) in the TC and 5.06-fold (=47.3/9.34) in the FC]. Taken together, our statistical results further confirmed the abovementioned collapse of PDNs.
To gain insight into the functional consequences of altered PDNs in each brain region, we performed gene functional enrichment analysis (Supplementary Material, Tables S2–S7). In the EC, the genes within appearing or disappearing PDNs were enriched in a pathway related to the immune systems [the top 11 in appearing PDNs (P-value = 5.43 × 10⁻²¹) and the top 10 in disappearing PDNs (P-value = 1.18 × 10−38)]. In addition, the genes within disappearing domains were enriched in a phagocytosis-associated pathway [top 8 (P-value = 5.43 × 10⁻²¹)], suggesting impairment of phagocytosis in the EC. In the TC, the genes within appearing PDNs [top 39 (P-value = 4.89 × 10⁻¹⁴)] and those within disappearing PDNs [top 6 (P-value = 6.96 × 10⁻²⁸)] were significantly enriched in a pathway related to axon guidance. We also found that the immunological pathway was enriched in the FC [the top 4 in appearing PDNs (P-value = 4.35 × 10⁻²⁹) and the top 23 in disappearing PDNs (P-value = 7.37 × 10⁻²⁴)].
We next asked whether the genes near the signals found in AD genome-wide association studies (GWASs) are included in the list of genes with predicted perturbation of the PDNs. For this purpose, we extracted the genes near AD GWAS signals from GWAS catalog database and mapped them onto the PDNs in each brain region. This analysis revealed that 29 genes were identified in the PDNs with appearing or disappearing interactions in one or more brain regions (Supplementary Material, Table S8). These genes include HLA-DRA and PTK2B, which are the genes near the AD GWAS signals from the latest largest AD GWAS (20). PTK2B is located next to CLU (21–23), and the two genomic regions are suggested to physically interact with each other via chromatin higher order structure (20). The gene functional enrichment analysis showed that these genes were significantly enriched in T cell receptor signalling [top2 (P-value = 2.51 × 10⁻⁹)], cognition [top17 (P-value = 1.26 × 10⁻⁶)] and neuron projection morphogenesis [top40 (P-value = 1.00 × 10⁻⁵)] (Supplementary Material, Table S9).
Identification of hub genes in PDNs that collapsed with the progression of Braak NFT stage in the EC
To identify key genes that play major roles in the perturbation of the PDNs, we searched for genes with hub domains, which have many interactions with other domains in each PDN. The patterns of those domains were classified into six expression patterns, similar to the classification shown in Figure 3A.
In general, Braak NFT stage correlates with ageing, suggesting that ageing is a potential confounding factor. Since we were interested in identifying AD-associated genes specifically related to Braak NFT stage rather than ageing, we extracted hub domains in which the expression patterns were specifically associated with the progression of Braak NFT stage but not with ageing using a linear regression model (those with an FDR-adjusted P-value for Braak NFT stage of <0.05 and an FDR-adjusted P-value for ageing of >0.05 in a Z-test). By these criteria, we identified 15 domains in only the EC (Fig. 3D). Among the genes with these domains, we found five genes with hub domains (hereafter referred to as hub genes) having eight or more interactions. Interestingly, these hub genes were the disappearing genes.
HRAS (the HRas proto-oncogene, a GTPase) had the most disappearing interactions among the hub genes. HRAS belongs to the Ras family and is an oncogene. Upregulation of HRAS negatively controls the expression of the CLU gene near the AD GWAS signals (21–23). RAC1 is a member of the Rho family of small GTPases that regulates actin cytoskeleton remodelling and controls the formation of axon growth and guidance (24–26). The remaining three hub genes (PTPN6, PRKCD and CSK) formed a network module. Protein Tyrosine Phosphatase, Non-Receptor Type 6 (PTPN6) is related to endocytosis along with CD33, a mutation in which was identified as a member of the susceptibility loci for AD by GWASs (27). Protein Kinase C Delta (PRKCD) is a PKC family member that has a role in learning and memory (28,29), and its activity is decreased in human AD brains (30,31). C-terminal Src kinase (CSK) acts as a non-receptor tyrosine protein kinase, and studies have suggested that CSK directly binds to N-methyl-D-aspartate receptor and controls synaptic plasticity (32,33).
Taken together, these reports suggest that the collapse of these networks may impair critical functions such as endocytosis and synaptic plasticity.
A reduction in the mRNA expression levels of RAC1 in AD brains was verified using independent data sets
To examine whether decreased expression levels of the hub genes identified in our data set could be verified with independent data sets, we used AlzData, a database providing statistical results from a meta-analysis using publicly available data sets (34), to reanalyse the expression levels of the five hub genes—CSK, HRAS, PRKCD, PTPN6 and RAC1—in the EC of patients with AD. Among the five genes, RAC1 was significantly downregulated in the EC of AD patients (FDR-adjusted P-value = 0.046) (Fig. 4A). Moreover, consistent with the results from our data sets, a reduction in the RAC1 expression level was not simply correlated with ageing (Fig. 4B). We also found that reductions in the mRNA expression levels of RAC1 in the EC, but not in the TC or FC, were statistically significant across Braak NFT stage in our data sets (Fig. 4C). These results indicate that RAC1 expression decreases across Braak NFT stage in two independent data sets. Taken together, we suggest that disruption of RAC1 functions is specifically associated with AD pathology and may be a causative factor for neurodegeneration.
Figure 4.

Expression levels of the five hub genes from a publicly available database, AlzData. (A) Comparisons of the expression levels of the five hub genes between control and AD in the EC region. FDRs were calculated based on P-values adjusted for age and sex by using a linear regression model. (B) Correlations between age and the expression levels of the five hub genes. SCCs were calculated. The P-values were calculated by a test for no correlation. (C) Correlations between the expression levels of RAC1 gene and Braak NFT stage in our study. The P-values indicating an association with Braak NFT stage were adjusted for age at death, Braak SP stage, sex and APOE4 by using a linear regression model. FDRs were calculated based on these P-values.
Robustness of the PDNs
We divided the samples into four groups in the above analyses to detect the change in the PDNs; however, the number of samples was relatively small in each group. To test whether our results are stable with larger sample size, we divided the samples into two groups: the non-demented/early demented group (Braak NFT stages 0–II; n = 33) and the late-demented group (Braak NFT stages III–VI; n = 38) (Supplementary Material, Fig. S4). This analysis revealed that the proportions of disappearing PDNs were much higher than those of appearing PDNs in all brain regions (Supplementary Material, Fig. S4B). This result is consistent with the data with four subgroups in Figure 3B and C.
However, we could not identify RAC1 gene in the EC region in the analysis with the above two subgroups, presumably because a reduction in mRNA expression levels of RAC1 gene already started from Braak stage I (Fig. 4C). To overcome this problem, we next divided our samples into the non-demented group (Braak NFT stage 0; n = 13) and the early/late-demented group (Braak NFT stages I–VI; n = 58). In this case, we could reproduce our previous results shown in Figure 3B and C (Supplementary Material, Fig. S4C) and also detected the Braak stage-specific PDN in the EC including four hub genes, RAC1, HRAS, PTPN6 and CSK (Supplementary Material, Fig. S4D).
Taken together, these results suggest that the global changes of the PDNs through Braak NFT stage are robust with the current sample size.
Neuronal knockdown of Rac1 causes age-dependent behavioural deficits and neurodegeneration
To determine whether a reduction in the RAC1 level is sufficient to cause age-dependent neurodegeneration, we utilized Drosophila as an in vivo genetic model. According to the Drosophila RNAi Screening Center (DRSC) Integrative Ortholog Prediction Tool (DIOPT), the primary amino acid sequences of Drosophila Rac1 and human RAC1, which are similar in size (192 and 211 amino acids, respectively), exhibit 83% identity and 87% similarity.
To modestly knock down Rac1 expression in fly neurons, the pan-neuronal elav-GAL4 driver was used to express shRNAi targeting Rac1. Quantitative RT-PCR analysis detected significant reductions (60%) in the mRNA expression level of Rac1 in fly brains (Transgenic RNAi Project (TRiP) RNAi line #34910, Fig. 5A). We first examined the effects of Rac1 knockdown on locomotor functions in flies, as assessed by a forced climbing assay (35,36). Neuronal knockdown of Rac1 significantly exacerbated age-dependent locomotor deficits after the age of 28 days (Fig. 5B). In contrast, Rac1 knockdown did not affect the life span of flies, suggesting that the observed locomotor deficits are not simply due to the reduced viability of flies (Fig. 5C).
Figure 5.
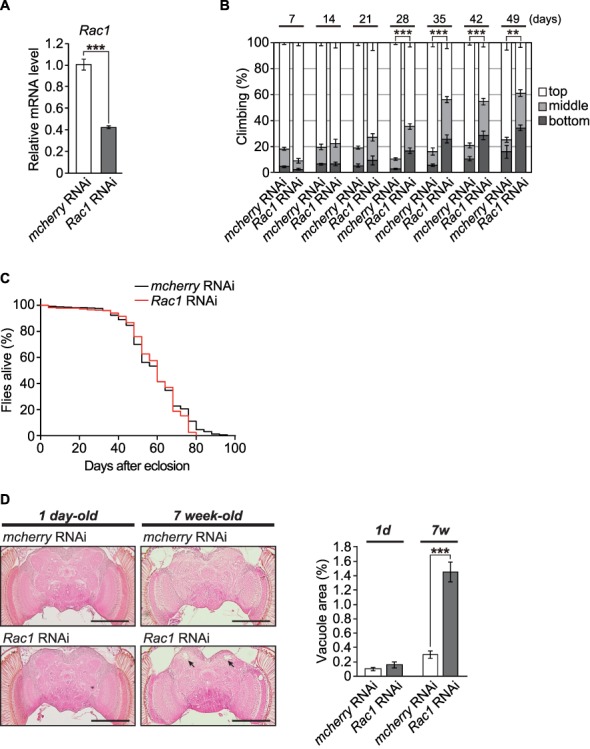
Neuronal knockdown of Rac1 causes age-dependent behavioural deficits and neurodegeneration. (A) mRNA levels of Rac1 in the heads of flies carrying the RNAi transgene targeting Rac1 were analysed by qRT-PCR. n = 4; ***P < 0.001 by Student’s t-test. (B) Knockdown of Rac1 in neurons induced age-dependent locomotor deficits, as revealed by the climbing assay. The average percentages of flies that climbed to the top (white), climbed to the middle (light grey) or stayed at the bottom (dark grey) of the vials were calculated. The percentage of flies that stayed at the bottom was used for statistical analyses. n = 6 independent experiments; **P < 0.01 and ***P < 0.001 by Student’s t-test. (C) Knockdown of Rac1 in neurons did not affect life span (n = 316, Rac1 RNAi group; n = 326, control group). The life span of the flies was determined by Kaplan–Meier survival analysis with a log-rank test (n.s., not significant). (D) Knockdown of Rac1 in neurons caused age-dependent neurodegeneration in the calyx (dendrite) region of the central neuropil in the fly brain. Representative images show the central neuropil in paraffin-embedded, HE-stained brain sections from 1-day-old or 7-week-old flies. Scale bars: 500 μm. The percentages of the vacuolar areas (indicated by the arrows in the images) in the central neuropil are shown. n = 8–12 hemispheres; ***P < 0.001 by Student’s t-test.
In Drosophila, brain vacuolation is a morphological hallmark of neurodegeneration. We next examined structural changes in the fly brains using serial sections of whole brains. In aged (49-day-old) fly brains expressing control RNAi targeting mCherry, neurodegeneration was spontaneously observed (Fig. 5D). However, neuronal knockdown of Rac1 induced prominent neurodegeneration in the neuropil region of aged (49-day-old) but not young (1-day-old) fly brains (Fig. 5D). These results suggest that neuronal knockdown of Rac1 is sufficient to cause age-dependent neurodegeneration in flies.
To minimize potential off-target effects of RNAi, histological analysis was performed in an independent transgenic line carrying RNAi targeting a different region of Rac1 (Supplementary Material, Fig. S5, TRiP RNAi line #28985). Although the knockdown efficiency of Rac1 by this RNAi was decreased (Supplementary Material, Fig. S5A), age-dependent neurodegeneration was similarly observed in these fly brains (Supplementary Material, Fig. S5B).
Reduced Rac1 functions and accumulation of amyloid-β42 (Aβ42) additively contribute to neuronal dysfunction and neurodegeneration in fly models
We next asked whether Rac1 expression is altered in a transgenic Drosophila model that expresses human Aβ42 in neurons (35). We found that mRNA expression levels of Rac1 were not significantly reduced, rather slightly increased, in Aβ42 flies (Fig. 6A). This suggest that reductions in mRNA expression levels of Rac1 are independent of Aβ42 accumulation, which is consistent with our data that there is no correlation between amyloid pathology and reduced mRNA expression levels of RAC1 in AD brains (FDR-adjusted P-value = 0.337).
Figure 6.

Neuronal knockdown of Rac1 exacerbates behavioural deficits and neurodegeneration caused by overexpression of human amyloid-β42 peptide. (A) mRNA levels of Rac1 in the heads of flies carrying the UAS-Aβ42 (Aβ42) were analysed by qRT-PCR. n = 4; **P < 0.01 by Student’s t-test vs. control. (B) Levels of Aβ42 peptides in fly brains. Heads from flies carrying the UAS-Aβ42 and mcherry RNAi (Aβ42/mcherry RNAi) or Rac1 RNAi (Aβ42/Rac1 RNAi) were subjected to western blotting using an anti-Aβ antibody. Tubulin was used as the loading control. n = 4. (C) Knockdown of Rac1 in neurons exacerbated Aβ42-induced locomotor deficits, as revealed by the climbing assay. n = 3 independent experiments, *P < 0.05 and **P < 0.01 by Student’s t-test. (D) Knockdown of Rac1 in neurons increased the neurodegeneration in the calyx (dendrite) region of Aβ42 fly brains. Representative images show the central neuropil and cell body region in paraffin-embedded, HE-stained brain sections from 32-day-old Aβ42 flies. Scale bars: 500 μm. The percentages of the vacuolar areas (indicated by the arrows in calyx regions and by arrow heads in cell body regions) in Aβ42 fly brains are shown. n = 20–24 hemispheres; ***P < 0.001 by Student’s t-test.
Next, we examined the effects of neuronal knockdown of Rac1 on Aβ42 accumulation and Aβ42-induced toxicity in flies. Elav-GAL4 driver was used to express both Aβ42 and shRNAi targeting Rac1 or control shRNAi in neurons. Neuronal knockdown of Rac1 did not affect the levels of Aβ42 peptide in Aβ42 fly brains (Fig. 6B); however, it significantly exacerbated the locomotor deficits in Aβ42 flies after the age of 21 days (Fig. 6C). The Aβ42 flies also showed the age-dependent neurodegeneration accessed by vacuolation in the brain, which was also significantly increased by neuronal knockdown of Rac1 in neuropil region (Fig. 6D).
Taken together, these results suggest that reductions in Rac1 functions and accumulation of Aβ42 additively contribute to neuronal dysfunction and neurodegeneration in fly models.
miRNA hsa-miR-101-3p represses RAC1 expression
To gain insight into the potential mechanism underlying the downregulation of RAC1 expression in the EC, we focused on miRNAs, which are short non-coding RNA molecules of 21–25 nucleotides that bind to complementary mRNAs to inhibit mRNA translation. We searched for candidate miRNAs that inhibit RAC1 expression using starBase, a database for searching candidate miRNA–mRNA interactions from experimental data sets [crosslinking immunoprecipitation (CLIP)-seq or degradome-seq] and seven prediction tools (37). More than three prediction tools identified that 62 miRNAs could bind to RAC1. Furthermore, more than five experimental data sets supported the interactions between the associated miRNAs and RAC1.
To narrow down candidate miRNAs, we measured comprehensive miRNA expression levels using small RNA sequencing in brain tissues obtained from the same individuals used for microarray analysis (59 samples in each brain region). We found nine miRNAs whose expression levels were negatively correlated with RAC1 gene expression in the EC (Spearman correlation coefficient (SCC) < 0; Table 1). Among these miRNAs, hsa-miR-101-3p showed the strongest negative correlation (SCC = −0.501, P-value = 6.66 × 10⁻⁵), and its interaction with RAC1 was validated in the most experimental data sets (Fig. 7A). The SCCs between RAC1 and hsa-miR-101-3p also indicated a negative correlation in the TC and FC (SCC = −0.543, P-value = 1.23 × 10⁻⁵ in the TC; SCC = −0.336, P-value = 0.015 in the FC). Moreover, the hsa-miR-101-3p levels were significantly increased with progressive Braak NFT stage in the EC (Fig. 7B, SCC = 0.359; P-value = 5.29 × 10⁻³), suggesting that this miRNA responded to disease progression.
Table 1.
Candidates of miRNAs targeting RAC1
| RAC1-miRNA expression correlation | |||||||
|---|---|---|---|---|---|---|---|
| miRNAname | Binding region | #CLIP-Seq | #Degradome-Seq | #Database Hits | EC | TC | FC |
| hsa-miR-101-3p | chr7:6442614-6442620 [+] | 36 | 1 | 4 | −0.501 | −0.543 | −0.317 |
| hsa-miR-365a-3p | chr7:6442981-6442987 [+] | 30 | 0 | 5 | −0.293 | −0.232 | 0.095 |
| hsa-miR-365b-3p | chr7:6442981-6442987 [+] | 30 | 0 | 3 | −0.293 | −0.232 | 0.095 |
| hsa-miR-155-5p | chr7:6443104-6443109 [+] | 19 | 0 | 4 | −0.388 | −0.212 | −0.009 |
| hsa-miR-155-5p | chr7:6443554-6443560 [+] | 17 | 0 | 4 | −0.388 | −0.212 | −0.009 |
| hsa-miR-194-5p | chr7:6443146-6443151 [+] | 16 | 0 | 3 | −0.300 | −0.277 | −0.102 |
| hsa-miR-194-5p | chr7:6442204-6442209 [+] | 12 | 0 | 5 | −0.300 | −0.277 | −0.102 |
| hsa-miR-495-3p | chr7:6442202-6442207 [+] | 12 | 0 | 3 | −0.201 | −0.142 | −0.059 |
| hsa-miR-22-3p | chr7:6443216-6443221 [+] | 11 | 0 | 3 | −0.318 | −0.382 | −0.019 |
| hsa-miR-1296-5p | chr7:6442312-6442317 [+] | 8 | 1 | 3 | −0.478 | 0.058 | −0.231 |
| hsa-miR-495-3p | chr7:6442264-6442268 [+] | 5 | 0 | 4 | −0.201 | −0.142 | −0.059 |
‘#CLIP-Seq’ and ‘#Degradome-Seq’ indicate the number of experiments that found miRNA–RAC1 interactions using CLIP-Seq and Degradome-Seq, respectively. ‘#Database Hits’ indicates the number of databases that predicted miRNA–RAC1 interactions in seven databases (PITA, RNA22, miRmap, microT, miRanda, PicTar and TargetScan). ‘RAC1-miRNA expression correlation’ shows Spearman correlation coefficients between RAC1 expression and miRNA expression in our data. miRNAs with #CLIP-Seq ≥ 5, #Database Hits ≥ 3 and Spearman correlation coefficient in EC < 0 were selected.
Figure 7.

hsa-miR-101-3p represses RAC1 expression. (A) Correlation between the hsa-miR-101-3p and total RAC1 levels in each brain region. The P-values were calculated by a test for no correlation. Red and blue dots indicate the non-demented subjects in Braak NFT stage 0 and the demented patients in Braak NFT stage 1 or more, respectively. (B) Correlation of hsa-miR-101-3p expression across Braak stages. (C) RAC1 expression levels in SH-SY5Y neuronal cells overexpressing hsa-miR-101-3p. RAC1 expression levels were quantified by qRT-PCR and were normalized to GUSB expression. The P-value was calculated by the Wilcoxon rank sum test.
To experimentally validate the suppression of RAC1 expression by hsa-miR-101-3p, we transfected human neuronal SH-SY5Y cells with hsa-miR-101-3p and quantified RAC1 expression by quantitative reverse transcription PCR (qRT-PCR). Overexpression of hsa-miR-101-3p resulted in a significant decrease in the RAC1 gene expression level compared to that in scrambled control cells (P-value = 3.32 × 10⁻³), indicating that hsa-miR-101-3p regulates RAC1 in human neuronal cells (Fig. 7C). Taken together, these results suggest that the increased expression of hsa-miR-101-3p with progressive Braak NFT stage may be involved in the suppression of RAC1 expression in AD brains.
Discussion
Several network analyses detected alterations in biological networks in AD brains (10,11,38,39). In this study, to analyse the dynamics of molecular networks during the progression of Braak NFT stage, we constructed PDNs in three regions of AD brains at each Braak NFT stage (Figs 2 and 3). Our analyses revealed that both gain and loss of PDNs occurred with the progression of Braak NFT stage (Fig. 3) and that loss of PDNs was more prominent than gain of PDNs in all three brain regions. These data are consistent with our previous findings (38) and provide further evidence that PDNs collapse during disease progression, which may underlie the neuronal dysfunction and neurodegeneration in AD.
Consistent with the severity of brain pathology (1), our analysis detected that the EC was the most severely affected among the three brain regions analysed (Fig. 3C). Furthermore, gene functional enrichment analysis revealed that genes in appearing or disappearing PDNs in the EC were associated with functions related to immune systems and phagocytosis. Alterations in these pathways have been implicated in brain pathologies in AD (40–45). Moreover, recent GWASs in AD identified the SNPs located in the coding regions of or in the vicinity of genes associated with immune functions, suggesting that alterations in the immune system play significant roles in AD pathogenesis (46–49). We identified Integrin Subunit Alpha X (ITGAX), also known as CD11c, as an immune gene in appearing PDNs in the EC (Table S2). ITGAX/CD11c expression is elevated in the EC and the hippocampus in AD (50), and recent studies found that ITGAX/CD11c is a marker of disease-associated microglia (DAM) in late-stage neurodegenerative diseases, including AD (51,52). Indeed, ITGAX/CD11c was expressed only in Braak stages V + VI in our data sets, suggesting that the formation of DAM is activated in the EC in the late stage of AD.
Our results strongly suggest that loss of PDNs is more prominent than gain of PDNs during the progression of NFT pathology (Fig. 3). Among these 15 collapsed genes, we identified five genes, including RAC1, as hub genes, which play key roles in the alteration of the PDNs. Using independent data sets, we confirmed that the mRNA expression level of RAC1 was downregulated in the EC of AD brains (Fig. 4). Importantly, these changes are not simply due to ageing effects. A previous study showed that RAC1 expression was negatively correlated with phosphorylated tau in the frontal lobes of AD patients (53). In contrast, amyloid-β (Aβ) pathology was not correlated with RAC1 expression (53), and we found no correlation between RAC1 expression and Braak SP stage (FDR-adjusted P-value = 0.337). Interestingly, RAC1 plays a key role in the phagocytosis process, and its dysfunction impairs the removal of synapses, cellular debris and aggregated proteins (54,55). These reports suggest that the collapse of a RAC1-centred PDN may promote synaptic dysfunction and neurodegeneration in AD.
To examine the effects of RAC1 downregulation on neural integrity during ageing, we utilized the fruit fly Drosophila as an in vivo genetic model. RAC1 activity is involved in the formation and maintenance of memory in flies (56) and mice (57–59). Moreover, RAC1 dysfunction is implicated in several neurodegenerative diseases, such as Parkinson’s disease and amyotrophic lateral sclerosis (60–63). Our gene expression analysis showed that the expression level of RAC1 gene decreased during the progression of Braak NFT stage (Fig. 4C). We further demonstrated that neuronal knockdown of a Drosophila orthologue of human RAC1 was sufficient to induce age-dependent behavioural deficits and neurodegeneration, suggesting that a reduction in the mRNA level of Rac1 level may be one of the causes of age-dependent neurodegeneration (Fig. 5). These results suggest that the accumulation of intracellular NFTs induces a reduction in RAC1 expression through increases in hsa-miR-101-3p, which leads to neurodegeneration in the pathogenesis of AD.
Finally, we identified a miRNA, hsa-miR-101-3p, as a potential regulator of RAC1 in AD brains (Fig. 7). As Braak NFT stage progressed, the expression of hsa-miR-101-3p was increased specifically in the EC. Furthermore, overexpression of hsa-miR-101-3p in the human neuronal cell line SH-SY5Y caused RAC1 downregulation. Interestingly, recent studies have reported that hsa-miR-101-3p is differentially expressed in AD serum (64), and precursor as well as mature forms of miR-101 regulate the expression of amyloid-β precursor protein in human HeLa cells and rat hippocampal neurons (65,66). miR-101 is also associated with the innate immune response in macrophages (67) and hepatocellular carcinoma (68). These reports further suggest the potential involvement of has-miR-101-3p in AD pathogenesis.
Although we still do not know the exact mechanisms underlying an increase in has-miR-101-3p level, one possibility could be an impairment of miRNA degradation in AD brains. miRNA is stabilized by recruiting into RNA-induced silencing complex and is degraded by target RNA-directed miRNA degradation (TDMD) (69). In mammals, TDMD activity is greater in neuronal cells than in non-neuronal cells (70), suggesting that strict quality control of miRNA exists in neuronal cells. This miRNA degradation is often impaired by cellular stresses (71, 72), and resultant increases in half-life of miRNA may disturb normal gene expression dynamics. In the context of AD, accumulation of intracellular NFTs may impair miRNA degradation by TDMD, which leads to increases in hsa-miR-101-3p levels and suppresses Rac1 expression in AD brains.
A limitation in our study is a lack of experimental verification for disruption of protein interactions in AD brains. Our prediction is based on physical interactions between proteins that were validated in previous reports such as co-crystal structures (73–78). In future works, it is important to experimentally validate whether the interactions between RAC1 and predicted binding partners appear or disappear in patients’ brains.
In conclusion, we demonstrated that disruption of a RAC1-centred PDN is associated with NFT pathology in AD brains and is sufficient to cause age-dependent neurodegeneration. This study suggests the utility of our integrated network approach for revealing the mechanisms underlying AD and identifying potential therapeutic targets.
Materials and Methods
Postmortem brain tissues
All 71 Japanese subjects used in the exon array analysis were included in a previous study (7). Based on the Braak NFT staging system established by Braak H and Braak E (1), the subjects were divided into four groups: Braak NFT stage 0 (N = 13), I–II (N = 20), III–IV (N = 19) and V–VI (N = 19). Three brain regions (the EC, TC and FC) were used. In total, 213 brain tissue specimens (=71 subjects × 3 brain regions) were ultimately included in this study. Detailed statistical information about the samples is described in Supplementary Material, Table S10.
Total RNA extraction and quality control
Total RNA was extracted from brain tissues and cultured cells with a TRIzol Plus RNA Purification System (Life Technologies, Carlsbad, CA, USA). Genomic DNA was removed through on-column DNase I treatment during RNA preparation. To determine the RNA integrity number (1 (totally degraded) to 10 (intact)), a 2100 Bioanalyzer instrument was used with an RNA 6000 Pico Assay (Agilent, Santa Clara, CA, USA). We fluorometrically determined the concentration of total RNA with a Quant-iT RiboGreen RNA Assay Kit (Life Technologies).
Exon-level gene expression profiling
We used GeneChip Human Exon 1.0 ST arrays (Affymetrix, Santa Clara, CA, USA) to measure the expression levels of transcripts in each brain tissue specimen. The initial raw data (DAT files) were processed into CEL files via Affymetrix GeneChip Operating Software. Partek Genomics Suite 6.4 (Partek, St. Louis, MO, USA) was used to normalize the data in the CEL files and summarize the expression of the probesets in the exon array. Background correction was performed via a robust multi-array average method (79) with adjustment for GC content. The expression levels of all probesets in the CEL files were log2-transformed. A total of 878 018 probesets were used. To filter out low-expression signals (including noise or poorly hybridized probes), which may lead to false positives, the DABG P-values of the exon probesets were calculated using Affymetrix Power Tools (APT, http://www.affymetrix.com/partners_programs/programs/developer/tools/powertools.affx). The probesets and transcripts were annotated according to the human genome hg19 reference sequence.
Domain–domain interaction data set
We used domain–domain interactions registered in INstruct (17). This data set includes 3626 proteins and 11 470 domain–domain interactions in Homo sapiens. We used INstruct-treated protein interactions that were validated through eight protein interaction databases and curated domain–domain interactions that were supported by co-crystal structures. We removed 3414 self-interactions.
Estimation of domain expression levels
We indirectly inferred the expression levels of protein domains using the expression levels of transcripts measured in the exon array. The probes in the exon array were assigned to the exons of each gene using refGene.txt provided by the UCSC Genome Browser. We defined an expressed exon as an exon with a median DABG P-value of <0.05 and a median log2-transformed expression value of ≥6 across all samples in a Braak NFT stage in a brain region. To determine the exons constructing the domains, we compared the coding sequences (CDSs) of the cDNAs and amino acid sequences of the proteins. The sequence information of the CDSs was obtained from the RefSeq database (human.rna.gbff). For amino acid sequences, information from the UniProt database (uniprot_sprot.fasta) was used, because the protein domains in INstruct were based on the canonical protein sequences in the UniProt database. The length of a CDS should be three times that of the corresponding amino acid sequence because one nucleotide triplet encodes one amino acid. We automatically checked these correspondences; however, if there were sequences that deviated from this rule because of polyA sequences or some noises, we manually checked the correspondence between the CDSs and amino acid sequences. We confirmed this criterion for all genes/proteins targeted in this study using the above data. Using this correspondence between the CDSs and the protein sequences, we searched the exons that were included in the domains. If an exon region covered more than half of a domain region or a domain region covered more than half of an exon region, we considered the exon to be a component of the domain.
Calculation of theoretical values
The theoretical value T for the number of interactions in an expression pattern was calculated based on the probabilities of interactions expressed in each Braak NFT stage:
 |
(1) |
 |
(2) |
where N is the total number of interactions expressed in at least one Braak NFT stage in a brain region, and pi indicates an observed probability of an interaction expressed in Braak NFT stage i. The observed probability was calculated as the number of interactions expressed in Braak NFT stage i divided by N. For instance, the theoretical value of ‘Pattern 1’ in disappearing interactions shown in Figure 3A was calculated as N × pBraak0 × (1 − pBraakI-II) × (1 − pBraakIII-IV) × (1 − pBraakV-VI).
Generation of null distribution
To test the statistical significance of the number of interactions in each expression pattern, we generated null distributions corresponding to each expression pattern shown in Figure 3A. The null distributions were generated by ‘expression label shuffling’ in each Braak NFT stage (Supplementary Material, Fig. S3). This procedure involved a set of shuffles from Braak stage 0 to Braak stages V–VI as one trial and was repeated 10 000 times. We calculated the numbers of interactions in each expression pattern in each trial and generated null distributions for each expression pattern. To assess the statistical significance of each expression pattern, we calculated the z-score as Z = (x − μ)/σ, where x is the observed number of interactions in an expression pattern and μ and σ are the mean value and standard deviation calculated from the null distribution of the expression pattern, respectively. The values of μ converge to the theoretical values described above. Each z-score calculated for each expression pattern was converted to a P-value.
Gene functional enrichment analysis
We used Metascape to examine the functions of genes in appearing or disappearing PDNs (80). Terms with a q-value of <0.01, a gene count of >3 and an enrichment factor of >1.5 (the enrichment factor is the ratio of the observed count to the count expected by chance) were assembled and grouped into clusters based on their membership similarities.
The genes near AD GWAS signals
AD-associated genomic loci were obtained from the GWAS catalog database (Release 20191014, ftp://ftp.ebi.ac.uk/pub/databases/gwas/releases/latest/gwas-catalog-associations_ontology-annotated.tsv) (81). These SNPs included ‘Alzheimer’ in the ‘DISEASE/TRAIT’ column of the GWAS catalog data. We treated the genes in ‘REPORTED GENE(S)’ and ‘MAPPED_GENE’ columns as the genes near AD GWAS signals.
Estimation of the effects of Braak NFT stage on domain expression
To examine whether the expression levels of domains depend on Braak NFT stage rather than ageing, we used the following linear regression model:
 |
(3) |
Here, Braak SP stage is represented as 0, A, B or C. These stages were converted to countable values (0–3). Sex was treated as a categorical variable. APOE4 represents the number of Apoe ε4 alleles (0, 1 or 2). These variables were analysed by a Z-test using the R statistical package glm.
Validation of RAC1 expression changes using independent data sets
We used AlzData to obtain gene expression levels in publicly available data sets (34). AlzData is a database storing statistical meta-analysis results using 78 samples from four data sets in the EC. Gene expression profiles were analysed by a linear regression model with age and sex as covariates. Log2 fold change (log2FC) values and FDR-adjusted P-values were calculated in AlzData. We downloaded the expression profiles from AlzData and calculated correlation coefficients between the expression levels of the genes and the age of the samples.
Drosophila genetics
Flies were maintained in standard cornmeal media at 25°C. Elav-GAL4 (#458), UAS-mcherry RNAi (#35785) and UAS-Rac1 RNAi (#34910 and #28985) transgenic flies were obtained from the Bloomington Stock Center. Transgenic fly line carrying UAS-Aβ42 was previously described (35). Experiments were performed using age-matched male flies. The ages of the flies used in the experiments presented in Figure 5A and Supplementary Material, Figure S5A were 7 days old, and the ages of the other flies are indicated in the figures. The genotypes of the flies were as follows: (mcherry RNAi): elav-GAL4/Y;;UAS-mcherry RNAi/+, (Rac1 RNAi): elav-GAL4/Y;;UAS-Rac1 RNAi #34910/+, (Control): elav-GAL4/Y, (Aβ42): elav-GAL4/Y;UAS-Aβ42/+;, (Aβ42/mcherry RNAi): elav-GAL4/Y;UAS-Aβ42/+; UAS- mcherry RNAi/+, (Aβ42/Rac1 RNAi): elav-GAL4/Y;UAS-Aβ42/+; UAS- Rac1 RNAi #34910/+ and (Rac1 RNAi (#28985)): elav-GAL4/Y;;UAS-Rac1 RNAi #28985/+.
RNA extraction and quantitative real-time PCR analysis for Drosophila
More than 25 flies of each genotype were collected and frozen. The heads were mechanically isolated, and total RNA was extracted using TRIzol reagent (Thermo Fisher Scientific) according to the manufacturer’s protocol, with an additional centrifugation step (16 000g for 10 min) to remove cuticle membranes prior to the addition of chloroform. Total RNA was reverse transcribed using a PrimeScript RT-PCR kit (TaKaRa Bio), and qRT-PCR was performed using SsoAdvanced Universal SYBR Green Supermix (Bio-Rad Laboratories) on a CFX96 real-time PCR detection system (Bio-Rad Laboratories). The average threshold cycle value was calculated from at least three replicates per sample. The expression of genes of interest was normalized to GAPDH1 expression. The results are presented as the means ± SEM. An unpaired Student’s t-test (Prism 7, GraphPad) was used to determine statistical significance. The primer sequences used in this study are shown below:
GAPDH1 (Drosophila), 109 bp
Forward: 5′-GACGAAATCAAGGCTAAGGTCG-3′
Reverse: 5′-AATGGGTGTCGCTGAAGAAGTC-3′
Rac1 (Drosophila), 199 bp
Forward: 5′-ACGTTCCATTGCAATTACACTTAC-3
Reverse: 5′-AGTTGCTCAGTTTGATGCCT-3
Climbing assay
The climbing assay was performed as described previously (35,36). Approximately 25 male flies were placed in an empty plastic vial. The vial was then gently tapped to knock all flies to the bottom. The flies in the top, middle and bottom third of the vial were counted after 10 s. The percentage of flies that stayed at the bottom was used for statistical analyses (unpaired Student’s t-test).
Life span analysis
Life span analysis was performed as described previously (35,36). Food vials containing 25 flies were placed on their sides at 25°C under conditions of 70% humidity and a 12:12 h light:dark cycle. Food vials were changed every 3–4 days, and the number of dead flies was counted at each change. At least four vials per genotype were prepared. Experiments were repeated more than three times, and a representative result is shown. Kaplan–Meier survival analysis with a log-rank test (SigmaPlot 11.0, Systat Software, Inc.) was used to determine statistical significance for life span analysis data.
Histological analysis
The heads of male flies were fixed in 4% paraformaldehyde for 24 h at 4°C and embedded in paraffin. Serial sections (6 μm thickness) through the entire head were prepared, stained with haematoxylin and eosin (Sigma-Aldrich) and examined by bright field microscopy. Images of the sections were acquired with an AxioCam 105 colour camera (Carl Zeiss). For quantification, we focused on analysing sections covering central neuropil and cell body regions. We selected the section with the most severe neurodegeneration in each individual fly, and the vacuolar area was measured using ImageJ (NIH). The results are expressed as the means ± SEM. An unpaired Student’s t-test was used to determine statistical significance.
Western blotting
Western blotting was performed as described previously (35, 36). Ten fly heads for each genotype were homogenized in Tris-Tricine SDS sample buffer (Novex, ThermoFisher) and the same amount of the lysate was loaded to each lane of 10–20% Tris-Tricine gels (Novex, ThermoFisher). Separated proteins were transferred to nitrocellulose membrane and blotted with anti-Aβ (6E10, Biolegend) or anti-tubulin (T9026, Sigma-Aldrich) antibodies. After incubating with secondary antibody, the membranes were developed using ECL Prime Western Blotting Detection Reagent (GE Healthcare Life Sciences) and analysed by ImageQuant LAS 4000 (GE Healthcare Life Sciences). The signal intensities were quantified using Image J (NIH).
miRNA sequencing and searching of candidate miRNAs targeting RAC1 mRNA
miRNA sequencing was performed as described previously (82). The samples from 59 donors of 71 donors were analysed because the amount of RNA from these samples is sufficient to perform miRNA sequencing. We used starBase to find candidate miRNAs that target RAC1 mRNA (37). StarBase is a database for searching candidate miRNA–mRNA interactions from experimental data sets (CLIP-seq or degradome-seq) and seven prediction databases. We selected the miRNAs with validation by CLIP-Seq in ≥5 studies, ≥3 database hits and a Spearman correlation coefficient in the EC of <0.
miRNA overexpression in cultured cells
The human neuroblastoma cell line SH-SY5Y was used for miRNA overexpression experiments. Cell culture and miRNA transfection were performed as described previously (82). SH-SY5Y cells were transfected with either the hsa-miR-101-3p mimic (MC11414; Thermo Fisher Scientific, Waltham, MA, USA) or scrambled control (mirVana™ miRNA Mimic, Negative Control #1; Thermo Fisher Scientific). Cells were harvested using TRIzol reagent 24 h after transfection and stored at −80°C until RNA extraction. A total of 200 ng of total RNA was reverse transcribed to cDNA using SuperScript IV VILO Master Mix (Thermo Fisher Scientific) in a reaction volume of 20 μl. The cDNA product was diluted by adding 60 μl of water. qPCR was performed in triplicate, with 2.5 μl of the diluted product in a reaction volume of 10 μl in a 384-well plate on an ABI PRISM 7900HT (Thermo Fisher Scientific) instrument with TaqMan Gene Expression Assays (Hs01902432_s1 for RAC1 and Hs99999908_m1 for GUSB; Thermo Fisher Scientific). The relative gene expression levels of RAC1 were calculated by the 2−ΔΔCT method using GUSB as the endogenous control for normalization. Six biological replicates were included for each condition, and the statistical significance between the two conditions was analysed by the Wilcoxon rank sum test.
Accession number
Gene expression data are available in the GEO database (GEO accession number GSE131617).
Supplementary Material
Acknowledgements
Certain pictures in the figures were obtained from the Togo picture gallery (https://togotv.dbcls.jp/pics.html). We acknowledge all groups that have contributed.
Conflict of Interest statement. The authors declare no competing interests.
Funding
This work was supported by Research and Development Grants for Dementia (M.K., A.M., T.I., A.N.) and Program for an Integrated Database of Clinical and Genomic Information (T.I., A.N.) from the Japan Agency for Medical Research and Development (AMED); Grants-in-Aid for Scientific Research (grant numbers 17K15049 to M.K., 18K07517 to M.S., and 16K08637 to K.M.I.) from the Ministry of Education, Culture, Sports, Science and Technology (MEXT); and the Research Funding for Longevity Science from the National Center for Geriatrics and Gerontology, Japan (grant numbers 19-49 to M.S. and No. 19-7 to K.M.I.). The funders had no role in the study design, data collection and analyses, decision to publish, or preparation of the manuscript.
Authors’ contributions
M.K. conceived the study. M.K., M.S. and K.M.I. designed the analyses. M.K. analysed the data. M.S. and K.M.I. performed the experiments for Drosophila. N.H. performed the experiments for miRNA. M.K., M.S., N.H. and K.M.I. wrote the manuscript. A.M., R.K., T.I. and A.N. reviewed and revised the manuscript. All authors read and approved the final manuscript.
References
- 1. Braak H. and Braak E. (1991) Neuropathological stageing of Alzheimer-related changes. Acta Neuropathol., 82, 239–259. [DOI] [PubMed] [Google Scholar]
- 2. Blalock E.M., Geddes J.W., Chen K.C., Porter N.M., Markesbery W.R. and Landfield P.W. (2004) Incipient Alzheimer's disease: microarray correlation analyses reveal major transcriptional and tumor suppressor responses. Proc. Natl. Acad. Sci. U. S. A., 101, 2173–2178. [DOI] [PMC free article] [PubMed] [Google Scholar]
- 3. Liang W.S., Dunckley T., Beach T.G., Grover A., Mastroeni D., Ramsey K., Caselli R.J., Kukull W.A., McKeel D., Morris J.C. et al. (2008) Altered neuronal gene expression in brain regions differentially affected by Alzheimer's disease: a reference data set. Physiol. Genomics, 33, 240–256. [DOI] [PMC free article] [PubMed] [Google Scholar]
- 4. Silva A.R., Grinberg L.T., Farfel J.M., Diniz B.S., Lima L.A., Silva P.J., Ferretti R.E., Rocha R.M., Filho W.J., Carraro D.M. et al. (2012) Transcriptional alterations related to neuropathology and clinical manifestation of Alzheimer's disease. PLoS One, 7, e48751. [DOI] [PMC free article] [PubMed] [Google Scholar]
- 5. Berchtold N.C., Coleman P.D., Cribbs D.H., Rogers J., Gillen D.L. and Cotman C.W. (2013) Synaptic genes are extensively downregulated across multiple brain regions in normal human aging and Alzheimer's disease. Neurobiol. Aging, 34, 1653–1661. [DOI] [PMC free article] [PubMed] [Google Scholar]
- 6. Hokama M., Oka S., Leon J., Ninomiya T., Honda H., Sasaki K., Iwaki T., Ohara T., Sasaki T., LaFerla F.M. et al. (2014) Altered expression of diabetes-related genes in Alzheimer's disease brains: the Hisayama study. Cereb. Cortex, 24, 2476–2488. [DOI] [PMC free article] [PubMed] [Google Scholar]
- 7. Miyashita A., Hatsuta H., Kikuchi M., Nakaya A., Saito Y., Tsukie T., Hara N., Ogishima S., Kitamura N., Akazawa K. et al. (2014) Genes associated with the progression of neurofibrillary tangles in Alzheimer's disease. Transl. Psychiatry, e396, 4. [DOI] [PMC free article] [PubMed] [Google Scholar]
- 8. Miller J.A., Oldham M.C. and Geschwind D.H. (2008) A systems level analysis of transcriptional changes in Alzheimer's disease and normal aging. J. Neurosci., 28, 1410–1420. [DOI] [PMC free article] [PubMed] [Google Scholar]
- 9. Ray M., Ruan J. and Zhang W. (2008) Variations in the transcriptome of Alzheimer's disease reveal molecular networks involved in cardiovascular diseases. Genome Biol., 9, R148. [DOI] [PMC free article] [PubMed] [Google Scholar]
- 10. Miller J.A., Horvath S. and Geschwind D.H. (2010) Divergence of human and mouse brain transcriptome highlights Alzheimer disease pathways. Proc. Natl. Acad. Sci. U. S. A., 107, 12698–12703. [DOI] [PMC free article] [PubMed] [Google Scholar]
- 11. Zhang B., Gaiteri C., Bodea L.G., Wang Z., McElwee J., Podtelezhnikov A.A., Zhang C., Xie T., Tran L., Dobrin R. et al. (2013) Integrated systems approach identifies genetic nodes and networks in late-onset Alzheimer's disease. Cell, 153, 707–720. [DOI] [PMC free article] [PubMed] [Google Scholar]
- 12. Seyfried N.T., Dammer E.B., Swarup V., Nandakumar D., Duong D.M., Yin L., Deng Q., Nguyen T., Hales C.M., Wingo T. et al. (2017) A multi-network approach identifies protein-specific co-expression in asymptomatic and symptomatic Alzheimer's disease. Cell Syst., 4, e64.60, –72. [DOI] [PMC free article] [PubMed] [Google Scholar]
- 13. Allen M., Wang X., Burgess J.D., Watzlawik J., Serie D.J., Younkin C.S., Nguyen T., Malphrus K.G., Lincoln S., Carrasquillo M.M. et al. (2018) Conserved brain myelination networks are altered in Alzheimer's and other neurodegenerative diseases. Alzheimers Dement., 14, 352–366. [DOI] [PMC free article] [PubMed] [Google Scholar]
- 14. Swarup V., Hinz F.I., Rexach J.E., Noguchi K.I., Toyoshiba H., Oda A., Hirai K., Sarkar A., Seyfried N.T., Cheng C. et al. (2019) Identification of evolutionarily conserved gene networks mediating neurodegenerative dementia. Nat. Med., 25, 152–164. [DOI] [PMC free article] [PubMed] [Google Scholar]
- 15. Bossi A. and Lehner B. (2009) Tissue specificity and the human protein interaction network. Mol. Syst. Biol., 5, 260. [DOI] [PMC free article] [PubMed] [Google Scholar]
- 16. Corominas R., Yang X., Lin G.N., Kang S., Shen Y., Ghamsari L., Broly M., Rodriguez M., Tam S., Trigg S.A. et al. (2014) Protein interaction network of alternatively spliced isoforms from brain links genetic risk factors for autism. Nat. Commun., 5, 3650. [DOI] [PMC free article] [PubMed] [Google Scholar]
- 17. Meyer M.J., Das J., Wang X. and Yu H. (2013) INstruct: a database of high-quality 3D structurally resolved protein interactome networks. Bioinformatics, 29, 1577–1579. [DOI] [PMC free article] [PubMed] [Google Scholar]
- 18. Clark T.A., Schweitzer A.C., Chen T.X., Staples M.K., Lu G., Wang H., Williams A. and Blume J.E. (2007) Discovery of tissue-specific exons using comprehensive human exon microarrays. Genome Biol., 8, R64. [DOI] [PMC free article] [PubMed] [Google Scholar]
- 19. Kang H.J., Kawasawa Y.I., Cheng F., Zhu Y., Xu X., Li M., Sousa A.M., Pletikos M., Meyer K.A., Sedmak G. et al. (2011) Spatio-temporal transcriptome of the human brain. Nature, 478, 483–489. [DOI] [PMC free article] [PubMed] [Google Scholar]
- 20. Jansen I.E., Savage J.E., Watanabe K., Bryois J., Williams D.M., Steinberg S., Sealock J., Karlsson I.K., Hagg S., Athanasiu L. et al. (2019) Genome-wide meta-analysis identifies new loci and functional pathways influencing Alzheimer's disease risk. Nat. Genet., 51, 404–413. [DOI] [PMC free article] [PubMed] [Google Scholar]
- 21. Harold D., Abraham R., Hollingworth P., Sims R., Gerrish A., Hamshere M.L., Pahwa J.S., Moskvina V., Dowzell K., Williams A. et al. (2009) Genome-wide association study identifies variants at CLU and PICALM associated with Alzheimer's disease. Nat. Genet., 41, 1088–1093. [DOI] [PMC free article] [PubMed] [Google Scholar]
- 22. Lambert J.C., Heath S., Even G., Campion D., Sleegers K., Hiltunen M., Combarros O., Zelenika D., Bullido M.J., Tavernier B. et al. (2009) Genome-wide association study identifies variants at CLU and CR1 associated with Alzheimer's disease. Nat. Genet., 41, 1094–1099. [DOI] [PubMed] [Google Scholar]
- 23. Lambert J.C., Ibrahim-Verbaas C.A., Harold D., Naj A.C., Sims R., Bellenguez C., DeStafano A.L., Bis J.C., Beecham G.W., Grenier-Boley B. et al. (2013) Meta-analysis of 74,046 individuals identifies 11 new susceptibility loci for Alzheimer's disease. Nat. Genet., 45, 1452–1458. [DOI] [PMC free article] [PubMed] [Google Scholar]
- 24. Sarner S., Kozma R., Ahmed S. and Lim L. (2000) Phosphatidylinositol 3-kinase, Cdc42, and Rac1 act downstream of Ras in integrin-dependent neurite outgrowth in N1E-115 neuroblastoma cells. Mol. Cell. Biol., 20, 158–172. [DOI] [PMC free article] [PubMed] [Google Scholar]
- 25. Yamaguchi Y., Katoh H., Yasui H., Mori K. and Negishi M. (2001) RhoA inhibits the nerve growth factor-induced Rac1 activation through rho-associated kinase-dependent pathway. J. Biol. Chem., 276, 18977–18983. [DOI] [PubMed] [Google Scholar]
- 26. Hua Z.L., Emiliani F.E. and Nathans J. (2015) Rac1 plays an essential role in axon growth and guidance and in neuronal survival in the central and peripheral nervous systems. Neural Dev., 10, 21. [DOI] [PMC free article] [PubMed] [Google Scholar]
- 27. Walter R.B., Raden B.W., Zeng R., Häusermann P., Bernstein I.D. and Cooper J.A. (2008) ITIM-dependent endocytosis of CD33-related Siglecs: role of intracellular domain, tyrosine phosphorylation, and the tyrosine phosphatases, Shp1 and Shp2. J. Leukoc. Biol., 83, 200–211. [DOI] [PubMed] [Google Scholar]
- 28. Olds J.L. and Alkon D.L. (1993) Protein kinase C: a nexus in the biochemical events that underlie associative learning. Acta Neurobiol. Exp. (Wars), 53, 197–207. [PubMed] [Google Scholar]
- 29. Pascale A., Govoni S. and Battaini F. (1998) Age-related alteration of PKC, a key enzyme in memory processes: physiological and pathological examples. Mol. Neurobiol., 16, 49–62. [DOI] [PubMed] [Google Scholar]
- 30. Cole G., Dobkins K.R., Hansen L.A., Terry R.D. and Saitoh T. (1988) Decreased levels of protein kinase C in Alzheimer brain. Brain Res., 452, 165–174. [DOI] [PubMed] [Google Scholar]
- 31. Wang H.Y., Pisano M.R. and Friedman E. (1994) Attenuated protein kinase C activity and translocation in Alzheimer's disease brain. Neurobiol. Aging, 15, 293–298. [DOI] [PubMed] [Google Scholar]
- 32. Xu J., Weerapura M., Ali M.K., Jackson M.F., Li H., Lei G., Xue S., Kwan C.L., Manolson M.F., Yang K. et al. (2008) Control of excitatory synaptic transmission by C-terminal Src kinase. J. Biol. Chem., 283, 17503–17514. [DOI] [PMC free article] [PubMed] [Google Scholar]
- 33. Spring A.M., Brusich D.J. and Frank C.A. (2016) C-terminal Src kinase gates homeostatic synaptic plasticity and regulates fasciclin II expression at the drosophila neuromuscular junction. PLoS Genet., 12, e1005886. [DOI] [PMC free article] [PubMed] [Google Scholar]
- 34. Xu M., Zhang D.F., Luo R., Wu Y., Zhou H., Kong L.L., Bi R. and Yao Y.G. (2018) A systematic integrated analysis of brain expression profiles reveals YAP1 and other prioritized hub genes as important upstream regulators in Alzheimer's disease. Alzheimers Dement., 14, 215–229. [DOI] [PubMed] [Google Scholar]
- 35. Iijima K., Liu H.P., Chiang A.S., Hearn S.A., Konsolaki M. and Zhong Y. (2004) Dissecting the pathological effects of human Abeta40 and Abeta42 in drosophila: a potential model for Alzheimer's disease. Proc. Natl. Acad. Sci. U. S. A., 101, 6623–6628. [DOI] [PMC free article] [PubMed] [Google Scholar]
- 36. Iijima K., Chiang H.C., Hearn S.A., Hakker I., Gatt A., Shenton C., Granger L., Leung A., Iijima-Ando K. and Zhong Y. (2008) Abeta42 mutants with different aggregation profiles induce distinct pathologies in drosophila. PLoS One, 3, e1703. [DOI] [PMC free article] [PubMed] [Google Scholar]
- 37. Li J.H., Liu S., Zhou H., Qu L.H. and Yang J.H. (2014) starBase v2.0: decoding miRNA-ceRNA, miRNA-ncRNA and protein-RNA interaction networks from large-scale CLIP-Seq data. Nucleic Acids Res., 42, D92–D97. [DOI] [PMC free article] [PubMed] [Google Scholar]
- 38. Kikuchi M., Ogishima S., Miyamoto T., Miyashita A., Kuwano R., Nakaya J. and Tanaka H. (2013) Identification of unstable network modules reveals disease modules associated with the progression of Alzheimer's disease. PLoS One, 8, e76162. [DOI] [PMC free article] [PubMed] [Google Scholar]
- 39. Wang M., Roussos P., McKenzie A., Zhou X., Kajiwara Y., Brennand K.J., De Luca G.C., Crary J.F., Casaccia P., Buxbaum J.D. et al. (2016) Integrative network analysis of nineteen brain regions identifies molecular signatures and networks underlying selective regional vulnerability to Alzheimer's disease. Genome Med., 8, 104. [DOI] [PMC free article] [PubMed] [Google Scholar]
- 40. Nixon R.A. (2005) Endosome function and dysfunction in Alzheimer's disease and other neurodegenerative diseases. Neurobiol. Aging, 26, 373–382. [DOI] [PubMed] [Google Scholar]
- 41. Fiala M., Lin J., Ringman J., Kermani-Arab V., Tsao G., Patel A., Lossinsky A.S., Graves M.C., Gustavson A., Sayre J. et al. (2005) Ineffective phagocytosis of amyloid-beta by macrophages of Alzheimer's disease patients. J. Alzheimers Dis., 7, 221–232; discussion 255-262. [DOI] [PubMed] [Google Scholar]
- 42. Fiala M. and Veerhuis R. (2010) Biomarkers of inflammation and amyloid-beta phagocytosis in patients at risk of Alzheimer disease. Exp. Gerontol., 45, 57–63. [DOI] [PMC free article] [PubMed] [Google Scholar]
- 43. Heneka M.T., Golenbock D.T. and Latz E. (2015) Innate immunity in Alzheimer's disease. Nat. Immunol., 16, 229–236. [DOI] [PubMed] [Google Scholar]
- 44. Heneka M.T., Carson M.J., El Khoury J., Landreth G.E., Brosseron F., Feinstein D.L., Jacobs A.H., Wyss-Coray T., Vitorica J., Ransohoff R.M. et al. (2015) Neuroinflammation in Alzheimer's disease. Lancet Neurol., 14, 388–405. [DOI] [PMC free article] [PubMed] [Google Scholar]
- 45. Heppner F.L., Ransohoff R.M. and Becher B. (2015) Immune attack: the role of inflammation in Alzheimer disease. Nat. Rev. Neurosci., 16, 358–372. [DOI] [PubMed] [Google Scholar]
- 46. Lambert J.C., Grenier-Boley B., Chouraki V., Heath S., Zelenika D., Fievet N., Hannequin D., Pasquier F., Hanon O., Brice A. et al. (2010) Implication of the immune system in Alzheimer's disease: evidence from genome-wide pathway analysis. J. Alzheimers Dis., 20, 1107–1118. [DOI] [PubMed] [Google Scholar]
- 47. Jonsson T., Stefansson H., Steinberg S., Jonsdottir I., Jonsson P.V., Snaedal J., Bjornsson S., Huttenlocher J., Levey A.I., Lah J.J. et al. (2013) Variant of TREM2 associated with the risk of Alzheimer's disease. N. Engl. J. Med., 368, 107–116. [DOI] [PMC free article] [PubMed] [Google Scholar]
- 48. Guerreiro R., Wojtas A., Bras J., Carrasquillo M., Rogaeva E., Majounie E., Cruchaga C., Sassi C., Kauwe J.S., Younkin S. et al. (2013) TREM2 variants in Alzheimer's disease. N. Engl. J. Med., 368, 117–127. [DOI] [PMC free article] [PubMed] [Google Scholar]
- 49. Sims R., van der Lee S.J., Naj A.C., Bellenguez C., Badarinarayan N., Jakobsdottir J., Kunkle B.W., Boland A., Raybould R., Bis J.C. et al. (2017) Rare coding variants in PLCG2, ABI3, and TREM2 implicate microglial-mediated innate immunity in Alzheimer's disease. Nat. Genet., 49, 1373–1384. [DOI] [PMC free article] [PubMed] [Google Scholar]
- 50. Hopperton K.E., Mohammad D., Trépanier M.O., Giuliano V. and Bazinet R.P. (2018) Markers of microglia in post-mortem brain samples from patients with Alzheimer's disease: a systematic review. Mol. Psychiatry, 23, 177–198. [DOI] [PMC free article] [PubMed] [Google Scholar]
- 51. Keren-Shaul H., Spinrad A., Weiner A., Matcovitch-Natan O., Dvir-Szternfeld R., Ulland T.K., David E., Baruch K., Lara-Astaiso D., Toth B. et al. (2017) A unique microglia type associated with restricting development of Alzheimer's disease. Cell, 169, 1276–1290.e17. [DOI] [PubMed] [Google Scholar]
- 52. Mathys H., Adaikkan C., Gao F., Young J.Z., Manet E., Hemberg M., De Jager P.L., Ransohoff R.M., Regev A. and Tsai L.H. (2017) Temporal tracking of microglia activation in neurodegeneration at single-cell resolution. Cell Rep., 21, 366–380. [DOI] [PMC free article] [PubMed] [Google Scholar]
- 53. Matsui C., Inoue E., Kakita A., Arita K., Deguchi-Tawarada M., Togawa A., Yamada A., Takai Y. and Takahashi H. (2012) Involvement of the γ-secretase-mediated EphA4 signaling pathway in synaptic pathogenesis of Alzheimer's disease. Brain Pathol., 22, 776–787. [DOI] [PMC free article] [PubMed] [Google Scholar]
- 54. Castellano F., Montcourrier P. and Chavrier P. (2000) Membrane recruitment of Rac1 triggers phagocytosis. J. Cell Sci., 113, 2955–2961. [DOI] [PubMed] [Google Scholar]
- 55. Mao Y. and Finnemann S.C. (2015) Regulation of phagocytosis by rho GTPases. Small GTPases, 6, 89–99. [DOI] [PMC free article] [PubMed] [Google Scholar]
- 56. Shuai Y., Lu B., Hu Y., Wang L., Sun K. and Zhong Y. (2010) Forgetting is regulated through Rac activity in drosophila. Cell, 140, 579–589. [DOI] [PubMed] [Google Scholar]
- 57. Haditsch U., Leone D.P., Farinelli M., Chrostek-Grashoff A., Brakebusch C., Mansuy I.M., McConnell S.K. and Palmer T.D. (2009) A central role for the small GTPase Rac1 in hippocampal plasticity and spatial learning and memory. Mol. Cell. Neurosci., 41, 409–419. [DOI] [PMC free article] [PubMed] [Google Scholar]
- 58. Hayashi-Takagi A., Yagishita S., Nakamura M., Shirai F., Wu Y.I., Loshbaugh A.L., Kuhlman B., Hahn K.M. and Kasai H. (2015) Labelling and optical erasure of synaptic memory traces in the motor cortex. Nature, 525, 333–338. [DOI] [PMC free article] [PubMed] [Google Scholar]
- 59. Liu Y., Du S., Lv L., Lei B., Shi W., Tang Y., Wang L. and Zhong Y. (2016) Hippocampal activation of Rac1 regulates the forgetting of object recognition memory. Curr. Biol., 26, 2351–2357. [DOI] [PubMed] [Google Scholar]
- 60. Chan D., Citro A., Cordy J.M., Shen G.C. and Wolozin B. (2011) Rac1 protein rescues neurite retraction caused by G2019S leucine-rich repeat kinase 2 (LRRK2). J. Biol. Chem., 286, 16140–16149. [DOI] [PMC free article] [PubMed] [Google Scholar]
- 61. Kim H., Calatayud C., Guha S., Fernández-Carasa I., Berkowitz L., Carballo-Carbajal I., Ezquerra M., Fernández-Santiago R., Kapahi P., Raya Á. et al. (2018) The small GTPase RAC1/CED-10 is essential in maintaining dopaminergic neuron function and survival against α-synuclein-induced toxicity. Mol. Neurobiol., 55, 7533–7552. [DOI] [PMC free article] [PubMed] [Google Scholar]
- 62. Harraz M.M., Marden J.J., Zhou W., Zhang Y., Williams A., Sharov V.S., Nelson K., Luo M., Paulson H., Schöneich C. et al. (2008) SOD1 mutations disrupt redox-sensitive Rac regulation of NADPH oxidase in a familial ALS model. J. Clin. Invest., 118, 659–670. [DOI] [PMC free article] [PubMed] [Google Scholar]
- 63. Kanekura K., Hashimoto Y., Kita Y., Sasabe J., Aiso S., Nishimoto I. and Matsuoka M. (2005) A Rac1/phosphatidylinositol 3-kinase/Akt3 anti-apoptotic pathway, triggered by AlsinLF, the product of the ALS2 gene, antagonizes cu/Zn-superoxide dismutase (SOD1) mutant-induced motoneuronal cell death. J. Biol. Chem., 280, 4532–4543. [DOI] [PubMed] [Google Scholar]
- 64. Cheng L., Doecke J.D., Sharples R.A., Villemagne V.L., Fowler C.J., Rembach A., Martins R.N., Rowe C.C., Macaulay S.L., Masters C.L. et al. (2015) Prognostic serum miRNA biomarkers associated with Alzheimer's disease shows concordance with neuropsychological and neuroimaging assessment. Mol. Psychiatry, 20, 1188–1196. [DOI] [PubMed] [Google Scholar]
- 65. Vilardo E., Barbato C., Ciotti M., Cogoni C. and Ruberti F. (2010) MicroRNA-101 regulates amyloid precursor protein expression in hippocampal neurons. J. Biol. Chem., 285, 18344–18351. [DOI] [PMC free article] [PubMed] [Google Scholar]
- 66. Long J.M. and Lahiri D.K. (2011) MicroRNA-101 downregulates Alzheimer's amyloid-β precursor protein levels in human cell cultures and is differentially expressed. Biochem. Biophys. Res. Commun., 404, 889–895. [DOI] [PMC free article] [PubMed] [Google Scholar]
- 67. Zhu Q.Y., Liu Q., Chen J.X., Lan K. and Ge B.X. (2010) MicroRNA-101 targets MAPK phosphatase-1 to regulate the activation of MAPKs in macrophages. J. Immunol., 185, 7435–7442. [DOI] [PubMed] [Google Scholar]
- 68. Li C.Y., Pang Y.Y., Yang H., Li J., Lu H.X., Wang H.L., Mo W.J., Huang L.S., Feng Z.B. and Chen G. (2017) Identification of miR-101-3p targets and functional features based on bioinformatics, meta-analysis and experimental verification in hepatocellular carcinoma. Am. J. Transl. Res., 9, 2088–2105. [PMC free article] [PubMed] [Google Scholar]
- 69. Bartel D.P. (2018) Metazoan microRNAs. Cell, 173, 20–51. [DOI] [PMC free article] [PubMed] [Google Scholar]
- 70. de la Mata M., Gaidatzis D., Vitanescu M., Stadler M.B., Wentzel C., Scheiffele P., Filipowicz W. and Grosshans H. (2015) Potent degradation of neuronal miRNAs induced by highly complementary targets. EMBO Rep., 16, 500–511. [DOI] [PMC free article] [PubMed] [Google Scholar]
- 71. De Smet E.G., Mestdagh P., Vandesompele J., Brusselle G.G. and Bracke K.R. (2015) Non-coding RNAs in the pathogenesis of COPD. Thorax, 70, 782–791. [DOI] [PubMed] [Google Scholar]
- 72. Belmadani S. and Matrougui K. (2017) The unraveling truth about IRE1 and microRNAs in diabetes. Diabetes, 66, 23–24. [DOI] [PubMed] [Google Scholar]
- 73. Lapouge K., Smith S.J., Walker P.A., Gamblin S.J., Smerdon S.J. and Rittinger K. (2000) Structure of the TPR domain of p67phox in complex with Rac.GTP. Mol. Cell, 6, 899–907. [DOI] [PubMed] [Google Scholar]
- 74. Grizot S., Faure J., Fieschi F., Vignais P.V., Dagher M.C. and Pebay-Peyroula E. (2001) Crystal structure of the Rac1-RhoGDI complex involved in nadph oxidase activation. Biochemistry, 40, 10007–10013. [DOI] [PubMed] [Google Scholar]
- 75. Tarricone C., Xiao B., Justin N., Walker P.A., Rittinger K., Gamblin S.J. and Smerdon S.J. (2001) The structural basis of Arfaptin-mediated cross-talk between Rac and Arf signalling pathways. Nature, 411, 215–219. [DOI] [PubMed] [Google Scholar]
- 76. Chhatriwala M.K., Betts L., Worthylake D.K. and Sondek J. (2007) The DH and PH domains of trio coordinately engage rho GTPases for their efficient activation. J. Mol. Biol., 368, 1307–1320. [DOI] [PMC free article] [PubMed] [Google Scholar]
- 77. Chrencik J.E., Brooun A., Zhang H., Mathews I.I., Hura G.L., Foster S.A., Perry J.J., Streiff M., Ramage P., Widmer H. et al. (2008) Structural basis of guanine nucleotide exchange mediated by the T-cell essential Vav1. J. Mol. Biol., 380, 828–843. [DOI] [PMC free article] [PubMed] [Google Scholar]
- 78. Modha R., Campbell L.J., Nietlispach D., Buhecha H.R., Owen D. and Mott H.R. (2008) The Rac1 polybasic region is required for interaction with its effector PRK1. J. Biol. Chem., 283, 1492–1500. [DOI] [PubMed] [Google Scholar]
- 79. Irizarry R.A., Hobbs B., Collin F., Beazer-Barclay Y.D., Antonellis K.J., Scherf U. and Speed T.P. (2003) Exploration, normalization, and summaries of high density oligonucleotide array probe level data. Biostatistics, 4, 249–264. [DOI] [PubMed] [Google Scholar]
- 80. Zhou Y., Zhou B., Pache L., Chang M., Khodabakhshi A.H., Tanaseichuk O., Benner C. and Chanda S.K. (2019) Metascape provides a biologist-oriented resource for the analysis of systems-level datasets. Nat. Commun., 10, 1523. [DOI] [PMC free article] [PubMed] [Google Scholar]
- 81. Welter D., MacArthur J., Morales J., Burdett T., Hall P., Junkins H., Klemm A., Flicek P., Manolio T., Hindorff L. et al. (2014) The NHGRI GWAS Catalog, a curated resource of SNP-trait associations. Nucleic Acids Res., 42, D1001–D1006. [DOI] [PMC free article] [PubMed] [Google Scholar]
- 82. Hara N., Kikuchi M., Miyashita A., Hatsuta H., Saito Y., Kasuga K., Murayama S., Ikeuchi T. and Kuwano R. (2017) Serum microRNA miR-501-3p as a potential biomarker related to the progression of Alzheimer's disease. Acta Neuropathol. Commun., 5, 10. [DOI] [PMC free article] [PubMed] [Google Scholar]
Associated Data
This section collects any data citations, data availability statements, or supplementary materials included in this article.