

Abstract
Objective
The study evaluated the effects of vindoline on testicular and epididymal oxidative stress in diabetes-induced male Wistar rats.
Methods
Forty-eight (48), 6-week old male Wistar rats weighing between 190-230g were divided into 6 groups (n = 8) and used for this study. Group 1 was the normal control, group 2 comprised non-diabetic rats treated with vindoline, and group 3 was the non-diabetic group of rats treated with glibenclamide-the standard drug for the treatment of diabetes. Group 4 was the diabetic control, group 5 comprised diabetic rats treated with vindoline and group 6 was the diabetic rats treated with glibenclamide. Diabetes was induced in group 4, group 5 and group 6 rats by subjecting them to 10% fructose water over a period of 2 weeks, followed by administration of a single intraperitoneal injection of 40 mg/kg b.w streptozotocin (STZ). Testicular and epididymal lipid peroxidation levels, antioxidant enzymes, scavenging activity and total antioxidant capacity were measured.
Results
Diabetes-induced male Wistar rats demonstrated chronic hyperglycaemia, oxidative stress and reduced oxygen radical absorption capacity in both testicular and epididymal tissues. Short-term treatment of diabetic rats with vindoline for 5 weeks significantly reduced fasting blood glucose levels, minimise testicular oxidative stress, increased testicular and epididymal catalase and epididymal SOD and increase total antioxidant activity capacity.
Conclusion
Treatment with vindoline showed protective effects against diabetes-induced oxidative stress in both testicular and epididymal tissues of male Wistar rats, hence can be considered potential agent in the management of diabetes-induced oxidative stress male sexual dysfunction.
Keywords: Diabetes mellitus, Oxidative stress, Vindoline, Catharanthus roseus, Testicular tissue, Epididymal tissue, Food science, Agricultural science, Biological sciences, Veterinary medicine, Health sciences
Diabetes mellitus, Oxidative stress, Vindoline, Catharanthus roseus, Testicular tissue, Epididymal tissue; Food Science; Agricultural Science; Biological Sciences; Veterinary Medicine; Health Sciences.
1. Introduction
Diabetes has been established as one of the risk factors for the development of male sexual dysfunction [1]. Reports showed that oxidative stress is elevated in diabetic conditions as a consequence of the overproduction of reactive oxygen species (ROS) without adequate neutralization of these harmful reactive species by the body's antioxidant system [1, 2, 3]. This oxidative stress plays a pivotal role in the development of diabetes secondary complications [4] including male sexual dysfunction. It can compromise spermatozoal quality, alter testicular morphology, spermatogenesis, reduce testosterone levels, reduce sexual libido and promote retrograde ejaculation [5, 6, 7, 8]. Oxidative stress generated in diabetic conditions is also responsible for the oxidation of spermatozoal lipids, proteins and deoxyribonucleic acids (DNA). Peroxidative damage of spermatozoal membrane lipids impairs spermatozoal motility [9, 10]. The oxidation of proteins on the other hand, results in site-specific amino acid modifications, altered electric charge and increased susceptibility of spermatozoa to proteolysis [10]. The collective effect of diabetes-induced oxidative stress may therefore precipitate infertility in male diabetic patients [11]. Glycaemic control and increased antioxidant protection are therefore necessary to reduce secondary complications of diabetes [12, 13].
Because of the challenges inherent in the use of orthodox drugs in the management of diabetes, the search for alternative remedies such as medications from natural products is paramount. Due to their hypoglycaemic and rich source of bioactive compounds, a variety of medicinal plants have been used in the management of diabetes mellitus and associated complications [12].
Catharanthus roseus (L.) G. Don Linn (C. roseus) is an ornamental shrub commonly known as the Madagascar periwinkle, as it is native to Madagascar [14]. C. roseus extracts are a viable source of natural antioxidants and hence might be exploited for nutraceutical applications [15, 16]. Phytochemical analysis of C. roseus shows the presence of alkaloids, terpenoids, steroids, flavonoids as well as some other useful secondary metabolites [17]. Previous studies have demonstrated the antihyperglycaemic and antioxidant activities of various extracts from C. roseus [18, 19, 20]. Vindoline is an intermediate, semi-synthetic, vinca alkaloid, extractable from C. roseus that has been reported to exhibit antidiabetic properties in diabetes-induced animal models. This study assessed the antioxidant and antidiabetic activities of vindoline in testicular and epididymal tissues in 10% fructose water and STZ-induced diabetic and non-diabetic rats.
2. Materials and methods
2.1. Animal requirements
Forty-eight, 6-week old, male Wistar rats, RattusNorvegicus, 190–230 g body mass, with a conventional microbial status were obtained from the Primate Unit and Delft Animal care, South African Medical Research Council, and used for this study.
2.2. Place of study
Animal feeding and sacrifice were done at the South African Medical Research Council in Parrow, Western Cape, South Africa; while laboratory analysis of samples obtained from the rats was carried out at the Oxidative Stress Research Centre of the Cape Peninsula University of Technology, Bellville; South Africa.
2.3. Ethical consideration
Ethical approval was sought and obtained from the Research Ethics Committee (CPUT/HW-REC 2017/A1), Faculty of Health and Wellness Sciences, Cape Peninsula University of Technology. All animals received humane care and were treated with respect according to the principles of Laboratory Animal Care of the National Society of Medical Research and the National Institute of Health Guide for the Care and Use of Laboratory Animals of the National Academy of Sciences (National Institutes of Health, Publication Number 80-23, Revised 1978).
2.4. Source of vindoline
Vindoline used for this study was commercially purchased from Best of Chemicals; United States of America.
2.5. Experimental design
The experiment comprised 6 groups of rats; each group with 8 rats. The first 3 groups (Groups 1, 2 and 3) were normal, non-diabetic male Wistar rats while the last 3 groups (Groups 4, 5 and 6) were diabetes-induced male Wistar rats.
2.6. Induction of diabetes
Induction of type 2 diabetes mellitus followed the modified method of Wilson et al. [21]. Diabetic groups (Groups 4, 5 and 6) received distilled water and 10% fructose water for the first 2 weeks of the study. At the end of 2 weeks, the administration of 10% fructose water was terminated and the rats were fasted overnight prior to the administration of a single intraperitoneal injection of STZ solution (Sigma, United States of America) at 40 mg/kg b.w. dissolved in sodium citrate at pH 4.4. Three days after STZ injection, drops of blood were collected from the tails and blood glucose levels were measured using a portable glucometer (Accu-Chek, Roche, Germany). Diabetes status was confirmed where glucose levels were above 18 mmol/l.
2.7. Animal feeding
All rats were fed with standard rat chow (SRC) purchased from AQUANUTRO Company (Mamelsbury, South Africa).
2.8. Animal treatment
All animals received humane care according to the principles of Laboratory Animal Care of the National Society of Medical Research and the National Institutes of Health Guideline for the Care and Use of Laboratory Animals of the National Academy of Sciences (National Institutes of Health publication no. 80-23, revised 1978). They were accommodated individually in plastic cages at the animal facility of the South African Medical Research Council and supplied with SRC and distilled water ad libitum. They were subjected to standard laboratory conditions of 22 ± 2 °C and 12-hour light/dark cycles at humidity levels of 55 ± 5%.
Rats from all the 6 different groups were subjected to different treatments as follows:
-
•
Group 1 (normal control) comprised normal non-diabetic rats (n = 8). Rats from this group were treated with the vehicle (castor oil); 5 times a week for 5 weeks, fed on SRC and had access to distilled water ad libitum.
-
•
Group 2 comprised normal, non-diabetic rats (n = 8), treated with vindoline (20 mg/kg/b.w), 5 times a week for 5 weeks, using castor oil as the vehicle for the administration of vindoline. The rats were fed on SRC and had access to distilled water ad libitum
-
•
Group 3 comprised normal, non-diabetic rats (n = 8) treated with glibenclamide (50 mg/kg/b.w), 5 times a week for 5 weeks. Glibenclamide is the standard drug for the treatment of diabetes. This group of rats was fed on SRC and allowed access to distilled water ad libitum.
-
•
Group 4 comprised untreated-diabetic rats (n = 8) and was considered the diabetic control. Rats from this group were treated with the vehicle (castor oil), fed on SRC and allowed free access to distilled water ad libitum.
-
•
Group 5 was the diabetic group of rats (n = 8), treated with vindoline (20 mg/kg/b.w.), using castor oil as the vehicle for administration. This group of rats was fed on SRC and allowed free access to distilled water ad libitum.
-
•
Group 6 was the diabetic group of rats (n = 8), treated with glibenclamide (50 mg/kg/b.w.), 5 times a week for 5 weeks. Rats from this group were fed on SRC and allowed access to distilled water ad libitum.
2.9. Sample collection and preparation
Body weights were measured from the onset of the study and monitored throughout the feeding period until sacrifice. 72 hours after STZ injection, drops of blood were collected from the tails and blood glucose levels were measured using a portable glucometer (Accu-Chek, Roche, Germany). Diabetic status was confirmed where glucose levels were above 18 mmol/l. On completion of the treatment periods, rats were fasted overnight in preparation for sacrifice and sample collection. Fasting blood glucose levels were measured after 4 h of fasting. Rats were anaesthetised and euthanized using isoflurane gas at 2% with 1% oxygen during laparotomy. Following complete anaesthesia, blood was collected from the abdominal vena cava using 5ml syringes connected to a 23- gauge hypodermic needle and collected into appropriate tubes containing sodium fluoride/potassium oxalate. The epididymis and testes were excised, weighed and used for the study. Testicular and epididymal tissue samples were snap-frozen in liquid nitrogen and stored at -80 °C until ready for biochemical analysis.
3. Biochemical experiment
All laboratory investigations were carried out at the Oxidative Stress Research Laboratory of the Cape Peninsula University of Technology, in Bellville; Western Cape Province of South Africa.
3.1. Buffer solutions
Fresh 50mM sodium phosphate buffer with 0.5% v/v Triton X-100 at pH 7.5 was used for homogenising all tissue samples. Thereafter, 50mM sodium phosphate buffer without Triton X-100 at pH 7.5 was used for diluting samples for purposes of running all the biochemical analyses.
3.2. Preparation of testicular and epididymal homogenates
Using a balance, 100 mg of each tissue (testicular/epididymal) was weighed and added to 1ml of the 50Mm sodium phosphate buffer with Triton X-100 (pH 7.5) in a glass homogeniser on ice water. The tissues were homogenised in potter-elvehjam for five strokes on ice water and the homogenates were transferred to new tubes and sonicated on ice. The homogenates were centrifuged for 15 min at 15 000 rpm at a temperature of 4 °C. The supernatant was transferred to newly marked tubes and stored at -80 °C until needed for protein determination and biochemical assays.
3.3. Total protein determination
Testicular and epididymal total protein measurements were determined and used for the calculation of testicular and epididymal SOD and catalase antioxidant enzyme activities. The Bicinchoninic acid (BCA) protein assay; a combination of the biuret reaction (characterised by the reduction of Cu2+ to Cu+ by protein in an alkaline medium) and the colorimetric detection of the produced Cu+ using a unique reagent containing BCA was used for the measurement of testicular and epididymal total protein levels. The chelation of two molecules of BCA with a single Cu+ ion results in a water-soluble purple-coloured complex with a strong absorption at 562nm. The prepared BSA dilutions were assayed alongside the unknown samples. Protein concentrations of the unknown samples were quantified using the standard curve generated from BSA and results were expressed as μg/ml.
3.4. Lipid peroxidation dertermination
Malondialdehyde (MDA), a meta-stable end-product of lipid peroxidation (LPO) was measured by the thiobarbituric acid reactive substances (TBARS) assay which is a simple and useful diagnostic tool for the measurement of LPO for in-vitro and in-vivo systems. Briefly, 100μl of each testicular/epididymal homogenate was mixed with 12.5μl of butylatedhydroxytoluene (BHT) ethanol and 100μl of 0.2MO-PA in a 2ml eppindoff tube. 12μl of thiobarbituric acid in 0.1M NaOH was added to the same mixture and the tubes were vortexed and incubated in a 90 °C water-bath for 45 min. The tubes were then cooled on ice water. 1000μl of butanol and 100μl of NaCI were added into each tube and the tubes were vortexed. Using a 96-well plate, 300μl of butanol/each prepared testicular and epididymal samples were pipetted into each well in triplicates and the absorbance of the pink-coloured chromogen was measured spectrophotometrically at 532nm on a microplate reader (Thermo Electron Corporation, Multiskan spectrum, United States of America). Results were expressed in μmol/g.
3.5. SOD assay
Testicular and epididymal SOD activity followed the methodology outlined by Ellerby and Bredesen [22], which uses 6 hydroxydopamine (6-HD, Sigma Cat H8523) and diethylenetriaminepentaacetic acid (DETAPAC, Sigma Cat CD6518) to generate superoxide anions. Briefly; in a 15ml tube, 1.6mM 6-HD was freshly prepared by mixing 10ml of distilled water and 50μl of perchloric acid for 15 min. 10 ml of this solution was measured, and to this, 4mg of 6-HD was added. The tube was labelled as 6-HD, stored on ice and used as soon as possible. 0.1mM DETAPAC solution was prepared by dissolving 2mg of DETAPAC in 50 ml of the 50mM sodium phosphate buffer without Triton X-100 and mixing the solution. This solution was stored at -20 °C and used as soon as possible. Tubes were labelled and into each tube, 50μl of the 50mM sodium phosphate buffer and 50μl of the blank/testicular/epididymal homogenates were added making up a 2× dilution of the samples’ original concentrations. Using a 96-well plate; 12μl of the blank/testicular and epididymal samples was added into each respective well in triplicates. Using a multiple-channel pipette, 15μl of the 6-HD solution and 170μl of the DETAPAC solution was added into each well making a total volume of 197μl for each well. The absorbance was measured immediately at 490nm for 4 min at 1min intervals on a microplate reader (Thermo Electron Corporation, Multiskan spectrum, United States of America). The activity of SOD was calculated from a linear calibration curve and expressed as μmol/mg protein.
3.6. Catalase assay
Testicular and epididymal catalase activity followed the methodology outlined by Aebi, [23]. Briefly; hydrogen peroxide (H2O2) solution was prepared by adding 34μl of the H2O2 stock solution to 10ml of the 50mM sodium phosphate buffer at pH 7.5. Testicular and epididymal tissue homogenates were diluted 5× by adding 10μl of each homogenate to 40μl of the 50mM sodium phosphate buffer. Using a 96 well plate, 10μl of the blank and each diluted unknown tissue sample were pipetted into each well in triplicates. 170μl of the 50mM sodium phosphate buffer was added to each well using a multiple channel pipette. The loaded 96 well plate was carried to the spectrophotometer where 75μl of the H2O2 solution was added to each well using a multiple channel pipette. The plate was immediately loaded onto the microplate reader (Thermo Electron Corporation, Multiskan spectrum, United States of America) and absorbance was measured at 240nm. Catalase activity results were expressed as μmol/mg of protein.
3.7. FRAP assay
The ferric reducing antioxidant power (FRAP) assay; this is an endpoint assay that uses antioxidants as reducing agents in a redox-linked colorimetric method employing an easily reduced oxidant. Fe3+ was used to determine ferric reducing antioxidant power in testicular and epididymal tissues. The reduction of colourless Fe3+ to blue Fe2+was monitored spectrophotometrically at 593nm. Briefly, iron chloride solution (FeCl3) was prepared by dissolving 0.053g of FeCl3 in 10ml of distilled water. TPTZ solution was prepared by dissolving 0.0279g of TPTZ in 9ml of 0.1M hydrochloric acid. The FRAP reagent was prepared by adding 90ml of the 50mM sodium phosphate buffer solution (pH 7.5) to 9ml of the already prepared FeCl3 solution, 9ml of the TPTZ solution and 18ml of distilled water. Ascorbic acid (AA) was diluted into different standard solution concentrations. Using a 96-well microplate; 10μl of the blank, each standard and respective testicular and epididymal samples were pipetted into each well in triplicates. 300μl of the FRAP working reagent was added into each well using a multiple channel pipette and the plate was incubated for 30 min at 37 °C. The plate was then loaded into the spectrophotometer (Thermo Electron Corporation, Multiskan spectrum, United States of America) where absorbance was measured at 593nm. Results were compared to a standard curve and expressed in μmol/g.
3.8. ORAC assay
The Oxygen Radical Absorbance Capacity (ORAC) assay was used to provide a comprehensive analysis of test sample antioxidant activity by measuring hydrogen atom transfer in testicular and epididymal tissues. Briefly, testicular and epididymal samples were deproteinated by mixing 50μl of each homogenised tissue with 50μl of perchloric acid making a 2× dilution of the original sample concentration. The mixture was vortexed and centrifuged at 14 000rpm for 1minute at 4 °C. 50μl of each supernatant was then added to 200μl of the 75mM ORAC buffer solution at pH 7.5 making an additional 5× dilution of the tissue samples. Fluorescein was prepared by adding 10μl of fluorescein to 2ml of the ORAC buffer in a 2.5ml tube. 300μl of this mixed solution (10μl fluorescein + 2ml ORAC buffer) was then pipetted into a 15ml tube and 15ml of the ORAC buffer solution was added into that tube. AAPH was prepared by adding 0.150g of AAPH to 6ml of the 75Mm ORAC buffer in a 15ml tube and standard Trolox was diluted to different concentrations. Using a 96-well plate, 12μl of the blank, each standard and deproteinated testicular and epididymal homogenates were added into each well in triplicates. Using a multiple channel pipette, 138μl of fluorescein was added into each well. The loaded 96-well plate was carried to the reading machine where 50μl of the AAPH solution was added into each well using a multiple-channel pipette. The 96-well plate was then loaded into the machine where results were generated over a period of 2 h. The regression equation (Y = a+bX + cX2) was used to determine ORAC values where Y = Trolox concentration in μM and X = net area under the fluorescence decay curve. Results were reported in Trolox equivalents per millilitre/μmol. The area under the curve (AUC) was calculated as follows:
| AUC= (0.5 + f2 / f1 +f3 / f1 +f4 / f1 +………+ fi / f1) × CT |
Where f1 is the initial reading at cycle 1, fi is the reading at cycle I and CT is the cycle time in minutes.
3.9. Statistical analysis
Data were expressed as mean ± standard error of the mean (Mean ± SEM). One-way analysis of variance (ANOVA) was used to test for significance between the different experimental groups. The Bonferroni1 Multiple Comparison analysis was used to compare the differences between multiple groups. Statistical analysis of two groups was performed using the unpaired student's t-test. Differences were considered significant at p < 0.05. GraphPad PRISM 5 software package and Microsoft Excel 2010 were used for all statistical evaluations and graphical representations.
4. Results
4.1. Initial blood glucose levels in diabetic and non-diabetic groups before treatment
The mean fasting blood glucose (FBG) levels of diabetic rats was significantly higher (p < 0.05) in comparison to FBG levels of normal, non-diabetic rats (29.27 ± 0.7882 mmol/l versus 11.21 ± 0.9771 mmol/l).
4.2. Evaluation of blood glucose levels following various treatments
There was a significant difference (p < 0.05) in FBG levels between the normal control (Group 1) and non-diabetic rats treated with vindoline (Group 2) (Figure 1). The FBG level of the diabetic control (Group 4) was significantly higher (p < 0.05) compared to FBG levels of the normal control (Group 1). Diabetic rats treated with vindoline (Group 5) and diabetic rats treated with glibenclamide (Group 6) had significantly higher (p < 0.05) FBG levels when compared to the normal control (Group 1). The mean FBG glucose levels of diabetic rats treated with vindoline (Group 5) were significantly (p < 0.05) lower in comparison to those of the diabetic control (Group 4).
Figure 1.

Final Fasting blood glucose.
4.3. Evaluation of body weights following treatment of rats
The mean final body weight of non-diabetic rats treated with vindoline (Group 2) was significantly higher (p < 0.05) compared to that of the normal control (Group 1). There was no significant difference (p > 0.05) in final body weights between groups 2 and 3. Final body weights of diabetic control (Group 4) were significantly lower (p < 0.05) compared to those of the normal control (Group 1). The final body weights of non-diabetic rats treated with vindoline (Group 2) were significantly higher (p < 0.05) in comparison to the mean final body weights of Group 4, Group 5 and Group 6. There was no significant difference (p > 0.05) in final body weights between rats in Group 4 and Group 5, also no significant difference between final body weights of the Group 4 and Group 6. There was no significant difference in final body weights between Groups 5 and 6 (p > 0.05). These are represented in Figure 2.
Figure 2.

Final body weights.
4.4. Effect of vindoline on testicular and epididymal weights
Figure 3 compares testicular weights of type 2 diabetes-induced rats and non-diabetic rats after 5 weeks following various treatments. The differences in testicular weights between the normal control (Group 1) and non-diabetic rats treated with vindoline (Group 2), and between testicular weights of normal control (Group 1) and non-diabetic rats treated with glibenclamide (Group 3) were not significantly different (p > 0.05). The mean testicular weight of the diabetic control (Group 4) was significantly lower (p < 0.05) in comparison to that of the normal control (Group 1). Diabetic rats treated with vindoline (Group 5) and diabetic rats treated with glibenclamide (Group 6) had significantly lower (p < 0.05) testicular weights in comparison to testicular weights of the normal control (Group 1).
Figure 3.
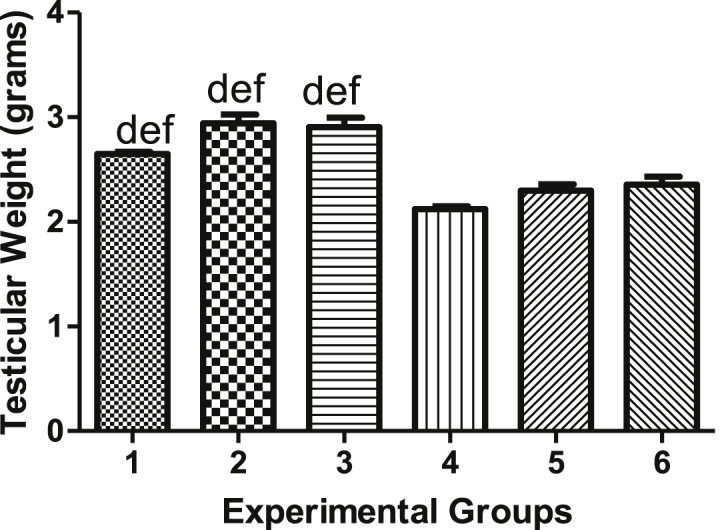
Testicular weights.
Epididymal weights of diabetes-induced rats and non-diabetic rats following various treatments for 5 weeks are represented in Figure 4. The mean epididymal weights for groups 1, 2, 3, 4, 5 and 6 are not significant (p > 0.05) and are depicted in Figure 4.
Figure 4.
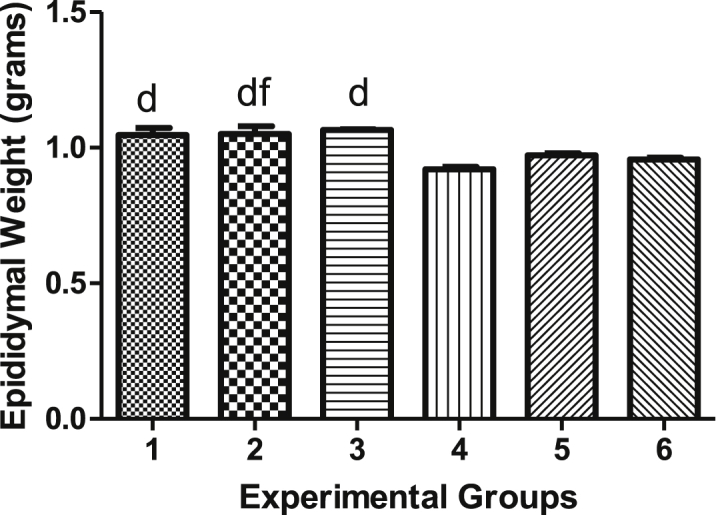
Epididymal weights.
4.5. Effects of vindoline on testicular and epididymal lipid peroxidation levels
Our results showed non-significant difference (p > 0.05) between testicular MDA levels of the normal control (Group 1) and non-diabetic rats treated with vindoline (Group 2). Testicular MDA levels of diabetic control (Group 4) were significantly higher (p < 0.05) in comparison to testicular MDA levels of the normal control (Group 1). Diabetic rats treated with vindoline (Group 5) and diabetic rats treated with glibenclamide (Group 6) had significantly lower (p < 0.05) testicular MDA levels in comparison to testicular MDA levels of the diabetic control (Group 4). Other groups show no significant difference, represented in Figure 5.
Figure 5.

Testicular MDA levels.
No significant difference (p > 0.05) was observed between epididymal MDA levels of normal control (Group 1) and non-diabetic rats treated with vindoline (Group 2). Epididymal MDA levels of diabetic control (Group 4) were significantly higher (p < 0.05) in comparison to those of the normal control (Group 1). Overall, epididymal MDA levels of non-diabetic groups (Groups 1, 2 and 3) were significantly lower in comparison to epididymal MDA levels of diabetic groups (Groups 4, 5 and 6) (Figure 6).
Figure 6.

Epididymal MDA levels.
4.6. Effects of vindoline on testicular and epididymal SOD activity
There was no significant difference (p > 0.05) in testicular SOD activity between non-diabetic rats supplemented with vindoline (Group 2) and the normal control (Group 1). The mean SOD activity in testicular tissues of diabetic control (Group 4) was significantly lower (p < 0.05) than that of normal control (Group 1). Testicular SOD activity of all non-diabetic groups (Groups 1, 2 and 3) were significantly higher (p < 0.05) than that of testicular SOD activity of diabetic control (Group 4). There was no significant difference in other groups (groups 4, 5 and 6) as shown in Figure 7.
Figure 7.
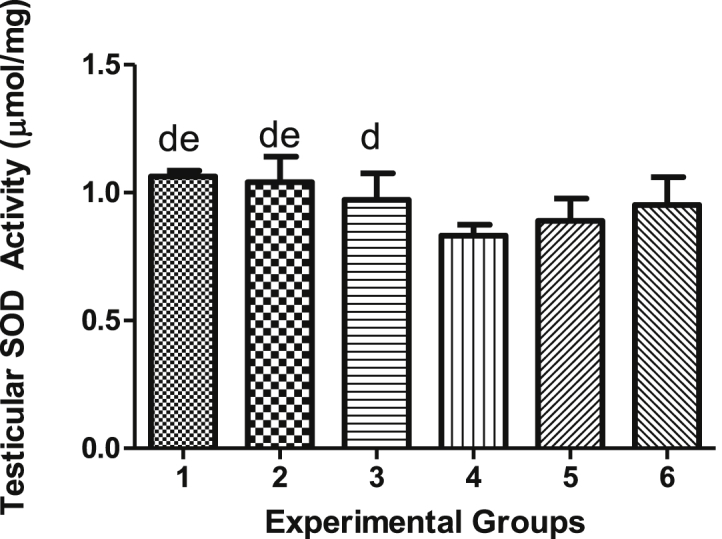
Testicular SOD activity.
Epididymal SOD activity of diabetic control (Group 4) was significantly lower (p < 0.05) compared to those of the normal control (Group 1). This is also true for epididymal SOD activity between Group 5 rats and diabetic control (Group 4). Other groups showed no significant difference (Figure 8).
Figure 8.

Epididymal SOD activity.
4.7. Effects of vindoline on testicular and epididymal catalase activity
In Figure 9, non-diabetic rats treated with vindoline (Group 2) had significantly higher (p < 0.05) testicular catalase activity than that of normal control (Group 1) while no significant difference (p > 0.05) was observed between testicular catalase activity of non-diabetic rats treated with glibenclamide (Group 3) and the normal control (Group 1). On the other hand, diabetic control (Group 4) had significantly lower (p < 0.05) testicular catalase activity than those of normal control (Group 1). Testicular catalase activity of Group 5 was significantly higher (p < 0.05) than that of diabetic control. Testicular catalase activity of Group 5 was significantly higher (p < 0.05) than that of those of Group 6. However, testicular catalase activity of diabetic rats treated with glibenclamide (Group 6) was not significantly different (p > 0.05) from the testicular catalase activity of the diabetic control (Group 4).
Figure 9.

Testicular catalase activity.
As could be seen in Figure 10, the difference between epididymal catalase activity of normal control (Group 1) and non-diabetic rats supplemented with vindoline (Group 2) was not significant (p < 0.05). Notably, epididymal catalase activity of diabetic groups (Group 4, 5 and 6) were significantly lower (p < 0.05) than those of non-diabetic groups (Groups 1, 2 and 3).
Figure 10.

Epididymal catalase activity.
4.8. Effects of vindoline on testicular and epididymal FRAP levels
FRAP concentration in testicular tissues of diabetic rats treated with vindoline (Group 5) were significantly higher (p < 0.05) compared to those of the diabetic control (Group 4). The mean testicular FRAP concentration of Group 6 rats was significantly higher (p < 0.05) than those of diabetic control Other groups showed no significant difference in the value of FRAP levels (Figure 11).
Figure 11.
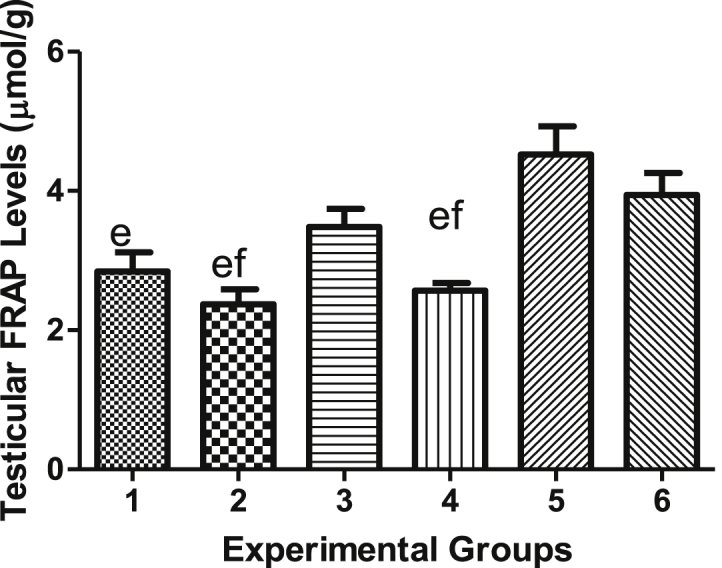
Testicular FRAP levels.
We observed that diabetic rats treated with vindoline (Group 5) and diabetic rats treated with glibenclamide (Group 6) had significantly higher (p < 0.05) epididymal FRAP levels than those of diabetic control (Group 4). Epididymal FRAP levels of Group 2 were significantly lower (p < 0.05) than those of Group 3. There was no significant difference I the epididymmal FRAP levels between other groups (Figure 12).
Figure 12.

Epididymal FRAP levels.
4.9. Effect of vindoline on testicular and epididymal ORAC levels of wistar rats
As represented in Figure 13, testicular ORAC levels of non-diabetic rats treated with vindoline (Group 2) were significantly higher (p < 0.05) when compared to those of normal control (Group 1). Treatment of diabetic rats with vindoline (Group 5) resulted in significantly higher (p < 0.05) testicular ORAC levels in comparison to the diabetic control (Group 4). We observed that testicular ORAC levels of Group 2 were significantly higher (p < 0.05) than those of Group 3. However, there was no significant difference between testicular ORAC levels of non-diabetic rats treated with glibenclamide (Group 3) and the normal control-Group 1 (Figure 13).
Figure 13.

Testicular ORAC levels.
Epididymal ORAC levels of all non-diabetic groups (Groups 1, 2 and 3) were significantly higher (p < 0.05) in comparison to those of all diabetic groups (Groups 4, 5 and 6). Significant difference was not observed in other groups (Figure 14). Table 1 shows blood levels, body weights, testicular and epididymal weights of diabetic and non-diabetic rats. Table 2 shows biochemical parameters of diabetic and non-diabetic rats in testicular and epididymal homogenates.
Figure 14.
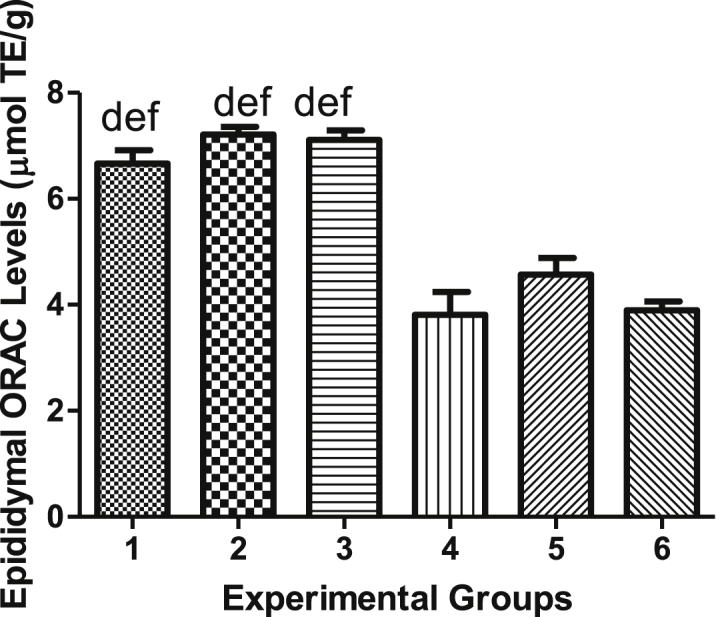
Epididymal ORAC levels.
Table 1.
Blood glucose levels, body weights, testicular and epididymal weights of diabetic and non-diabetic rats.
| Experimental Groups | Final Blood Glucose (mmol/l) | Final Body Weight (grams) | Testicular Weights (grams) | Epididymal Weights (grams) |
|---|---|---|---|---|
| Group 1 | 10.56 ± 0.3380 | 293.0 ± 8.251 | 2.647 ± 0.09365 | 1.047 ± 0.02988 |
| Group 2 | 10.03 ± 0.9161 | 338.4 ± 13.10 | 2.941 ± 0.06671 | 1.050 ± 0.02712 |
| Group 3 | 10.18 ± 0.2944 | 310.0 ± 10.41 | 2.906 ± 0.08967 | 1.066 ± 0.01710 |
| Group 4 | 31.94 ± 0.5438 | 243.1 ± 11.88 | 2.123 ± 0.04656 | 0.9202 ± 0.007020 |
| Group 5 | 27.15 ± 1.472 | 241.0 ± 9.417 | 2.299 ± 0.06905 | 0.9702 ± 0.004497 |
| Group 6 | 29.23 ± 1.335 | 255.0 ± 5.586 | 2.275 ± 0.06370 | 0.9562 ± 0.005837 |
Table 2.
Biochemical parameters of diabetic and non-diabetic rats in testicular and epididymal homogenates.
| Group 1 | Group 2 | Group 3 | Group 4 | Group 5 | Group 6 | |
|---|---|---|---|---|---|---|
| Testicular | ||||||
| MDA(μmol/g) | 0.2847 ± 0.1239 | 0.277 ± 0.020 | 0.2905 ± 0.015 | 0.3870 ± 0.010 | 0.2654 ± 0.027 | 0.2877 ± 0.01934 |
| SOD (μmol/mg) | 1.063 ± 0.007962 | 1.041 ± 0.349 | 0.9725 ± 0.035 | 0.8313 ± 0.363 | 0.890 ± 0.0151 | 0.9517 ± 0.0446 |
| Catalase (μmol/mg) | 30.69 ± 0.9186 | 38.69 ± 0.919 | 24.77 ± 1.588 | 23.65 ± 0.994 | 32.34 ± 1.589 | 19.08 ± 1.486 |
| FRAP (μmol/mg) | 3.285 ± 0.1319 | 2.374 ± 0213 | 3.483 ± 02617 | 2.566 ± 0.1273 | 4.524 ± 0.4045 | 3.941 ± 0.3147 |
| ORAC (μmol TE/g) |
3.710 ± 0.4902 |
5.109 ± 0.130 |
3.892 ± 03946 |
1.926 ± 0.1577 |
3.143 ± 0.0825 |
3.009 ± 0.1354 |
| Epididymal | ||||||
| MDA (μmol/g) | 0.1913 ± 0.229 | 0.141 ± 0.012 | 0.2115 ± 0.015 | 0.4846 ± 0.032 | 0.3756 ± 0.037 | 0.438 ± 0.04474 |
| SOD (μmol/mg) | 2.117 ± 0.1476 | 2.286 ± 0.228 | 1.841 ± 0.1348 | 0.9938 ± 0.064 | 1.513 ± 0.089 | 1.104 ± 0.06542 |
| Catalase (μmol/mg) | 62.66 ± 0.5878 | 63.54 ± 1.462 | 61.65 ± 2.396 | 27.73 ± 1.131 | 39.79 ± 1.587 | 38.60 ± 0.9332 |
| FRAP (μmol/mg) | 3.007 ± 0.05471 | 2.402 ± 0220 | 3.371 ± 0.2077 | 2.702 ± 0.2126 | 3.702 ± 0.2126 | 4.372 ± 0.1498 |
| ORAC (μmol TE/g) | 6.663 ± 0.2992 | 7.209 ± 0.148 | 7.109 ± 0.1370 | 3.809 ± 0.4244 | 4.571 ± 0.2455 | 3.896 ± 0.2300 |
Figures 1, 2, 3, 4, 5, 6, 7, 8, 9, 10, 11, 12, 13, and 14 represent mean final fasting blood glucose levels, final body weights, testicular and epididymal weights, MDA levels, SOD activity, catalase activity, FRAP and ORAC levels of Experimental Groups 1–6. Data is presented as mean ± SEM. (a) indicates significant difference of groups when compared to group 1 at p < 0.05 (b) indicates significant difference of groups when compared to group 2 at p < 0.05; (d) indicates significant difference of groups when compared to group 4 at p < 0.05; (e) indicates significant difference of groups when compared to group 5 at p < 0.05 and (f) indicates significant difference of groups when compared to group 6 at p < 0.05.
5. Discussion
The administration of high energy diet and a single low dose STZ have been demonstrated to induce insulin resistance in animal models and partially destroy pancreatic β-cells leading to insufficient insulin secretion and closely mimicking the symptoms observed in human type 2 diabetes mellitus patients [21]. With regards to the present study, the possible therapeutic effect of vindoline against diabetes-induced oxidative stress in testicular and epididymal tissues was investigated using 10% fructose water and STZ-induced diabetic male Wistar rats. Hyperglycaemia was observed 72 h after STZ administration and this was confirmed by fasting blood glucose levels greater than 18 mmol/l in diabetes-induced rats. As such, a type 2 diabetes mellitus experimental model was successfully created in rats and used as experimental diabetic groups. These diabetes-induced rats were then subjected to treatments with the aim of evaluating the possible therapeutic effects of vindoline against diabetes-induced oxidative stress effects in testicular and epididymal tissues.
5.1. Evaluation of final body weights, testicular and epididymal weights after treatments
Final body weights, testicular weights and epididymal weights of diabetic control were significantly lower than those of normal control (non-diabetic group). Insufficient insulin secretion and dysfunction in the insulin signalling pathways in diabetic conditions is known to result in disturbed glucose homeostasis. This usually prompts the body to use alternative sources of energy such as lipids and proteins instead of glucose through the process of gluconeogenesis [24]. Diabetes is therefore known to be associated with increased protein degradation, decreased protein synthesis and increased gluconeogenesis [24], which ultimately leads to rapid organ and body weight loss. Final body weights of non-diabetic treated groups in this study were higher than those of diabetic control, mainly due to undisturbed glucose metabolism and no muscle atrophy in the non-diabetic groups. As such, rats from non-diabetic groups were able to maintain high body weights in comparison to the diabetic control. We observed that non-diabetic rats treated with vindoline had significantly higher body weights in comparison to the normal control, showing the possible enhancing and protective effects of vindoline on body weights in non-diabetic conditions. Unfortunately, we did not observe similar trend when non-diabetic rats were treated with vindoline or glibenclamide. Neither vindoline nor glibenclamide showed any significant impact on both testicular and epididymal weights in comparison to the normal control.
Treatment of diabetic male Wistar rats with vindoline or glibenclamide for 5 weeks did not have a significant impact on final body weights and testicular weights of diabetes-induced male Wistar rats when compared against the diabetic control. Diabetes is associated with increased gluconeogenesis which can precipitate organ and body weight loss [23, 24]. Failure of vindoline or glibenclamide to significantly improve body weight gain and testicular weights in type 2 diabetes-induced rats may possibly be due to a short treatment period. It may be necessary to increase stidy time or dosage of the vindoline.
5.2. The effect of vindoline on blood glucose and lipid peroxidation in treated animal groups
There is a close relationship between chronic hyperglycaemia, oxidative stress and lipid peroxidation and the progression of diabetes mellitus [25]. Diabetes-induced sexual dysfunction is considered one of the most prevalent diabetic complications where oxidative stress plays a crucial role in its pathogenesis. Results of this study demonstrated high blood glucose levels and high oxidative stress as reflected by MDA levels in both testicular and epididymal tissues of diabetic control. Though vindoline significantly reduced blood glucose levels in diabetes-induced rats, however, final blood glucose levels of diabetic rats treated with vindoline remained significantly higher than those of the normal control. The inability of vindoline to restore blood glucose levels to normal levels in the diabetic rats may be related to a shorter experimental period or an insufficient dosage, thus further study is suggested. Treatment of diabetic rats with vindoline was able to significantly reduce testicular MDA levels. These results therefore show that vindoline has the potential to mitigate the effects of oxidative stress in diabetic testicular tissues. Epididymal MDA levels of diabetic control were also significantly higher in comparison to those of the normal control. Treatment with vindoline resulted in significant reduction in epididymal MDA in diabetic rats. It could be said that treatment with vindoline can significantly reduce oxidative stress levels in epididymal tissues of type 2 diabetes mellitus in animal model.
5.3. Effect of vindoline on testicular and epididymal SOD activity
Oxidative stress depletes antioxidant defence systems in diabetic condition and a dysfunctional antioxidant system cannot protect tissues against reactive oxygen species (ROS). Consequently, free radicals continue to accumulate leading to enhanced oxidative stress [25]. Decreased activities of SOD and catalase antioxidant enzymes in various tissues of diabetic rats clearly demonstrate that these antioxidant enzymes are easily inactivated by diabetes-induced ROS and lipid peroxides [24]. The relatively normal levels of blood glucose, low MDA levels and normal catalase and SOD activity in both testicular and epididymal tissues of non-diabetic rats following treatment with vindoline may be due to the absence of a pathological condition in these rats. Non-diabetic rats were not exposed to 10% fructose water or STZ, therefore antioxidant enzyme activity was not negatively altered.
Testicular SOD activity in the diabetic control was significantly reduced in comparison to that of the normal control. Chronic hyperglycaemia in diabetic condition promotes free radical production culminating in oxidative stress. This could alter antioxidant enzymes in various ways such that antioxidant enzymes’ activities are reduced. This leads to the accumulation of free radicals which may promote testicular and epididymal oxidative stress. High oxidative stress due to chronic hyperglycaemia in diabetic rats may have altered SOD antioxidant enzyme leading to reduced SOD activity in testicular tissues of diabetic control. Epididymal SOD activity in diabetic rats treated with vindoline was significantly higher than that reported for diabetic control. This shows the possible efficacy of vindoline in improving epididymal SOD activity in diabetic rats. Chronic hyperglycaemia in diabetic rats decreased epididymal SOD activity, however, administration of vindoline was able to significantly increase epididymal SOD activity.
5.4. The effect of vindoline on testicular and epididymal catalase activity
Testicular and epididymal catalase activities of diabetic control were significantly lower compared to that of the normal control. Diabetes mellitus is associated with high levels of ROS which subsequently attack amino acids that are the building blocks of antioxidant enzymes leading to the modification and alteration of antioxidant enzyme activity, hence the association observed between diabetes and low antioxidant activity [25]. Treatment of diabetic and non-diabetic rats with vindoline increased testicular catalase activity to activity, reflecting the potential efficacy of vindoline in enhancing testicular catalase activity in a pathological and non-pathological conditions. Treatment of diabetic rats with vindoline and glibenclamide significantly increased epididymal catalase levels in diabetes-induced rats. The results therefore show that vindoline can potentially improve testicular and epididymal catalase activity in diabetes-induced animal model, thereby improving reproduction function.
5.5. Assessment of vindoline on testicular and epididymal total antioxidant capacity
FRAP provides the overall antioxidant power of a sample based on its ferrous ion reducing power by antioxidant vitamins and enzymes [26, 27]. Treatment of diabetic rats with vindoline and glibenclamide increased levels of ferric ion reducing antioxidants possibly as a defence against diabetes-induced oxidative stress in testicular and epididymal tissues of diabetes-induced Wistar rats. ORAC is an oxidation-inhibition based method that measures the ability of a specimen's antioxidants to inhibit the oxidation of a fluorescent probe derived from peroxyl radicals by hydrogen atom transfer [28]. In diabetic conditions, the ROS-scavenging power of antioxidants becomes weakened resulting in diabetes-induced oxidative stress [29]. Testicular and epididymal tissues of the non-diabetic control had higher ORAC values in comparison to the diabetic control. The absence of diabetic pathology in the normal control possibly explain the high ORAC levels reported in this group.
Treatment of non-diabetic rats with vindoline significantly increased testicular ORAC levels, showing the potential of vindoline to enhance testicular antioxidant capacity in a biological system. Treatment of diabetic rats with vindoline significantly increased testicular ORAC levels to near-normal levels. This shows the potential of vindoline to restore testicular ORAC capacity in type 2 diabetic conditions.
6. Conclusion
Results obtained from this study showed that treatment of diabetic rats with vindoline potentially reduced fasting blood glucose levels in diabetic rats, reduced lipid peroxidation levels, significantly increased antioxidant enzyme activity and increased total antioxidant capacity. Vindoline thus demonstrates antihyperglycaemic and antioxidant potential on testicular and epididymal tissues in diabetic and non-diabetic animal model.
Declarations
Author contribution statement
O. Oguntibeju: Conceived and designed the experiments; Contributed reagents, materials, analysis tools or data.
Y. Aboua: Conceived and designed the experiments.
P. Kachepe: Performed the experiments; Analyzed and interpreted the data; Wrote the paper.
Funding statement
This study was funded by the National Research Foundation of the Republic of South Africa (NRFCPUT-R022) and Cape Peninsula University of Technology (CPUT-RJ23) granted to OO Oguntibeju.
Competing interest statement
The authors declare no conflict of interest.
Additional information
No additional information is available for this paper.
Acknowledgements
The authors would like to thank Mr Fanie Rautenbach for technical assistance.
References
- 1.Rochette L., Zeller M., Cottin Y., Vergley C. Diabetes, oxidative stress and therapeutic strategies. BiochimActa. 2014;1840(9):2709–2729. doi: 10.1016/j.bbagen.2014.05.017. [DOI] [PubMed] [Google Scholar]
- 2.Asmat U., Abad K., Ismail K. Diabetes mellitus and oxidative stress_ a concise review. Saudi Pharmaceut. J. 2015;24(5):547–553. doi: 10.1016/j.jsps.2015.03.013. [DOI] [PMC free article] [PubMed] [Google Scholar]
- 3.Chikezie P.C., Ojiako O.A., Ogbuji A.C. Oxidative stress in diabetes mellitus. Integr Obesity Diabetes. 2015;1(3):71–79. [Google Scholar]
- 4.Giacco F., Brownlee M. Oxidative stress and diabetic complications. Circ. Res. 2010;107(9):1058–1070. doi: 10.1161/CIRCRESAHA.110.223545. [DOI] [PMC free article] [PubMed] [Google Scholar]
- 5.La-vignera S., Condorelli R., Vicari E., D’agata R., Calogero A.E. Diabetes mellitus and sperm parameters. J. Androl. 2012;33(2):145–153. doi: 10.2164/jandrol.111.013193. [DOI] [PubMed] [Google Scholar]
- 6.Jain G.C., Jangir R.N. Modulation of diabetes mellitus-induced male reproductive dysfunction in experimental animal models with medicinal plants. Phcog. Rev. 2014;8(16):113–121. doi: 10.4103/0973-7847.134245. [DOI] [PMC free article] [PubMed] [Google Scholar]
- 7.Oliveira J.S., Silva A.A.N., Silva Jnr V.A. Phytotherapy in reducing glycaemic index and testicular oxidative stress resulting from induced diabetes: a review. Braz. J. Biol. 2015;77(1) doi: 10.1590/1519-6984.09915. [DOI] [PubMed] [Google Scholar]
- 8.Elabbady A., Hashad M.M., Kotb A.F., Ghanem A.E. Studying the effect of type 2 diabetes mellitus on prostate related parameters: - a prospective single institutional study. Prostate Int. 2016;4(4):156–159. doi: 10.1016/j.prnil.2016.07.005. [DOI] [PMC free article] [PubMed] [Google Scholar]
- 9.Bucak M.N., Atessahin A., Yuce A. Effect of antioxidants and oxidative stress parameters on ram semen after the freeze thawing process. Small Rumin. Res. 2010;75(3):128–134. [Google Scholar]
- 10.Tvrdá E., Kňažická Z., Bárdos L., Massányi P., Lukáč N. Impact of oxidative stress on male fertility- a review. Acta Vet. Hung. 2011;59(4):465–484. doi: 10.1556/AVet.2011.034. [DOI] [PubMed] [Google Scholar]
- 11.Tremellen K. Oxidative Stress and male fertility- a clinical perspective. Hum. Reprod. Update. 2008;14(3):243–258. doi: 10.1093/humupd/dmn004. [DOI] [PubMed] [Google Scholar]
- 12.Singh R., Bhadwaj P., Sharma P. Antioxidant and Toxicological evaluation of Cassia Sopheira streptozotocin induced diabetic Wistar rats. Pharmacogn. Res. 2013;5(4):225–232. doi: 10.4103/0974-8490.118767. [DOI] [PMC free article] [PubMed] [Google Scholar]
- 13.Chaudhury A., Duvoor C., Dendi V.S.R., Kraleti S., Chada A., Ravilla R., Marco A., Shekhawatt N.S., Montales M.T., Kuriakose K., Sasapu A., Beebe A., Patil Initial, Musham C.K., Lohani G.P., Mirza W. Clinical review of antidiabetic drugs: implications for type 2 diabetes mellitus management. Front. Endocrinol. 2017;8:6. doi: 10.3389/fendo.2017.00006. [DOI] [PMC free article] [PubMed] [Google Scholar]
- 14.Tiong S.H., Looi C.Y., Hazni H., Arya A., Paydar M., Wong W.F., Chear S., Mustafa M.R., Awang K. Antidiabetic and antioxidant properties of alkaloids from Catharanthus roseus (L.) G. Don. Molecules. 2013;18(8):9770–9784. doi: 10.3390/molecules18089770. [DOI] [PMC free article] [PubMed] [Google Scholar]
- 15.Patharajan S., Abirami S.B. Antioxidant activity and phytochemical analysis of fractionated leaf extract of Catharanthus roseus. Int. J. Pharmacogn. 2014;1(2):138–143. [Google Scholar]
- 16.Rasool A.N., Jaheerunnisa S., Javaveera K.N., Kumar S. In vitro callus induction and in-vivo antioxidant activity of Passiflorafoetida L. leaves. Int. J. App. Res. Nat. Prod. 2011;4(1) [Google Scholar]
- 17.Aslam J., Khan S.H., Siddiqui Z.H., Fatima Z., Maqsoud M., Bhat M.A., Nasim S.A., Ilah A., Ahmad I.Z., Khan S.A., Mujib A., Sharma M.P. Catharanthus roseus (L.) G. Don.: an important drug: its implications and production. Int. J. Comprehen. Pharm. 2010;4(12):1–16. [Google Scholar]
- 18.Rasineni K., Bellamkonda R., Singareddy S.R., Desireddy S. Antihyperglycaemic activity of Catharanthus roseus leaf powder in streptozotocin induced rats. Pharmacogn. Res. 2010;2(3):195–201. doi: 10.4103/0974-8490.65523. [DOI] [PMC free article] [PubMed] [Google Scholar]
- 19.Vega-Vila E., Cano-Velasco, Alarcon-Aguilar F.J., Ortiz M.C.F., Almanza-Perez J.C., Roman-Ramos R. 2012. Hypoglycaemic Activity of Aqueous Extracts from Catharanthus Roseus. Evidence-Based Complementary and Alternative Medicine. Article 934258; 7pages. [DOI] [PMC free article] [PubMed] [Google Scholar]
- 20.Al-Shaqha W., Khai M., Salam N., Azzi A., Chaudhary A. Antidiabetic potential of Catharanthus roseus Linn and its effects on the glucose transport gene (GLUT-2 and GLUT-4) in streptozotocin induced diabetic Wistar rats. BMC Compl. Alternative Med. 2015;15:379. doi: 10.1186/s12906-015-0899-6. [DOI] [PMC free article] [PubMed] [Google Scholar]
- 21.Wilson R.D., Islam S. Fructose-fed streptozotocin-injected rat: an alternative model for type 2 diabetes. Pharmacol. Rep. 2012;64(1):129–139. doi: 10.1016/s1734-1140(12)70739-9. [DOI] [PubMed] [Google Scholar]
- 22.Ellerby L.M., Bredesen D.E. Measurement of cellular oxidation, reactive oxygen species, and antioxidant enzymes during apoptosis. Methods Enzymol. 2000;322:413–421. doi: 10.1016/s0076-6879(00)22040-5. [DOI] [PubMed] [Google Scholar]
- 23.Aebi H. Catalase in vitro. Methods Enzymol. 1984;105:121–126. doi: 10.1016/s0076-6879(84)05016-3. [DOI] [PubMed] [Google Scholar]
- 24.Gannon M.C., NuttallF Q. Control of blood glucose in type 2 diabetes without weight loss by modification of diet composition. Nutr. Metab. 2006;3(16) doi: 10.1186/1743-7075-3-16. PMID 16556307. [DOI] [PMC free article] [PubMed] [Google Scholar]
- 25.Maritim A.C., Sanders R.A., Watkins J.B., III Diabetes, oxidative stress and antioxidants: a review. J. Biochem. Mol. Toxicol. 2003;17(1):24–38. doi: 10.1002/jbt.10058. [DOI] [PubMed] [Google Scholar]
- 26.Maiti R., Karak P., Misra D.S., Ghosh D. Diabetes-induced testicular dysfuntion correction by hydromethanolic extract of Tamarindus indica Linn seed in male albino rats. International Journal of Green Pharmarcy. 2017;11(4) [Google Scholar]
- 27.Kiran B.S.R., Lakshmi T.M., Srikuma R., Reddy E.P. Total antioxidant status and oxidative stress in diabetes mellitus and metabolic syndrome. Int J. Pharm Scie Rev. 2016;40(1):271–277. [Google Scholar]
- 28.Sahari M.A., Berenji A.S. Bio-antioxidant activity: their mechanisms and measurement methods. Applied Food Biotechnology. 2015;2(1):3–8. [Google Scholar]
- 29.Houcher Z., Boudiaf K., Benboubetra M., Houcher B. Effects of methanolic extract and commercial oil of Nigella sativa L. on blood glucose and antioxidant capacity in alloxan-induced diabetic rats. Pteridines. 2007;18(1):8–18. [Google Scholar]