Abstract
Background
SETDB1, an H3K9-specific histone methyltransferase, plays important roles in the progression of various human cancers. However, the expression patterns and its clinical roles of SETDB1 remain elusive in breast cancer (BC).
Material/Methods
The transcriptional level of SETDB1 and survival data in BC were analyzed through UALCAN, ONCOMINE, and Pan Cancer Prognostics Database. SETDB1 protein expression was assessed by immunohistochemistry (IHC) in 159 BC tissue samples. The associations between SETDB1 expression and clinical pathological characteristics of patients were analyzed. The GEO dataset GSE108656 was downloaded and analyzed to identify the differentially expressed genes (DEGs) between control and BC cells targeting interference with SETDB. The DEGs were further integrated by bioinformatics analysis to decipher the key signaling pathways and hub genes that are regulated by SETDB.
Results
The public databases showed the level of SETDB1 mRNA was significantly upregulated in BC. Our IHC results demonstrated the level of SETDB1 protein was associated with tumor size (P=0.028), histopathological grading (P=0.012), lymph node metastasis (P<0.001), and TNM stage (P<0.001). High expression of SETDB1 indicated worse overall survival (P=0.015) and shorter relapse-free survival (P=0.027). The bioinformatic analysis of GSE108656 suggested that the SETDB1-related DEGs was mainly enriched in antigen processing and presentation, as well as immune networks in BC. The cytoHubba analysis suggested the top 10 hub genes were IL6, BMP4, CD74, PECAM1, HLA-DPA1, HLA-DRA, LAMC1, CTSB, SERPINA1, and CTSD.
Conclusions
The results suggest that SETDB1 is an oncogene and can serve as a prognostic biomarker for BC. However, the mechanisms of SETDB1 in BC remain to be explored.
MeSH Keywords: Immunochemistry, Prognosis, Triple Negative Breast Neoplasms
Background
Breast cancer (BC), one of the most common malignancies in the world, is correlated with a high mortality rate [1]. In China, its incidence increased approximately 30%, and the related mortality has doubled over the past 30 years [2,3]. Although specific biomarkers are routinely used to predict response to therapy and prognoses, the underlying cause of development of this tumor is largely unknown, and clinically useful prognostic and predictive parameters are still insufficient. Thus, it is important to develop and broaden additional prognostic biomarkers.
SETDB1 (SET domain bifurcated 1), an H3K9-specific histone methyltransferase, locates on human chromosome 1q21.3 with a length of about 38.6 Kb. The SETDB1 protein belongs to the SET domain protein methyltransferase family and plays important roles in heterochromatin formation and gene expression [4]. As a H3K9 methyltransferase, the physiological function of SETDB1 has been associated with gene silencing in mammalian development [5], particularly involving heterochromatin formation [6], stem cell maintenance [7], and endogenous retrovirus genes repression [8]. In the field of oncology, SETDB1 has been observed to be deregulated in various human carcinogenesis, including colorectal cancer, lung cancer, melanoma, and BC [9–13]. Moreover, abnormal expression of SETDB1 has been found to be a diagnostic biomarker of patient survival in the 2 major forms of human non-small cell lung carcinoma (adenocarcinoma and squamous cell carcinoma) [11]. Thus, SETDB1 has been regarded as a key methyltransferase in the progression of human cancer.
Previous studies showed the level of SETDB1 was significantly elevated in BC, and SETDB1 was involved in BC tumorigenesis [13–15]. Most of these previous studies were performed on transcriptome or gene levels. A recent study performed immunohistochemical staining (IHC) of SETDB1 in 43 BC tissues and showed a significant increase in the SETDB1 level in BC samples [13]. The present study further investigated the expression of SETDB1 by IHC and its clinical performance in a cohort of 159 patients with BC. Our results demonstrated that the level of SETDB1 expression was associated with some pathological parameters in BC. Moreover, we deciphered the potential biological function of SETDB1 by bioinformatics analysis of GEO data, which was based on BC cells targeting interference with SETDB1. Therefore, it SETDB1 appears to play an important role in BC.
Material and Methods
Analysis of SETDB1 on the transcriptional level in public databases
The SETDB1 expression in BC was analyzed using public databases. UALCAN is a comprehensive and interactive web resource for analyzing cancer OMICS data, which includes the transcriptional and clinical data from TCGA and MET500 databases (http://ualcan.path.uab.edu) [16]. We used UALCAN to compare the transcriptional levels of SETDB1 among various cancer stages, and the SETDB1 expression across 20 cancer types was explored using the ONCOMINE database (www.oncomine.org) [17].
IHC of SETDB1 expression in BC tissues
All of the specimens, fixed with 10% formalin and paraffin-embedded in wax blocks, were retrospectively collected from patients who had undergone BC resection in Huashan Hospital of Fundan University between January 2000 and December 2010. These tissues were obtained from 159 patients with an average age of 55.23 years (range 34.4~85.5). All the patients met the following criteria: i) patients were diagnosed as primary mammary carcinoma; and ii) patients received chemotherapy or radiation therapy before surgery [18]. All the patients were diagnosed according to the AJCC/UICC TNM Classification and Stage grouping system [19]. Prior to the study, all patients provided informed consent approved by the local ethics committee. The expression of SETDB1IHC was determined by IHC. Antigen retrieval was performed with 0.01 M citrate buffer at 95°C for 30 min, followed by washing with PBS buffer. Then, slides were incubated with diluted anti-human primary antibodies against SETDB1 (1: 80; Proteintech, IL), anti-ER (1: 100, Sigma-Aldrich, MO), anti-PR (1: 100, Sigma-Aldrich, MO), and anti-HER-2 (1: 100 Newcastle upon Tyne, UK) at 4°C overnight, followed by incubations with HRP-conjugated secondary antibody and diaminobenzidine as chromogen. Slides were again counterstained with hematoxylin. The negative controls were incubated with PBS in place of primary antibody in the slides. Each slide was assessed by 2 independent pathologists to obtain average percentage and the intensity of immunostained cells. The average percentage was scored as follows: 0 (0%); 1 (1–25%); 2 (26–50%); 3 (51–75%); and 4 (76–100%). The intensity of stained cells was scored according to the following criteria: 0 (negative); 1 (weak); 2 (moderate), and 3 (strong). The final IHC scores were calculated by multiplying the staining intensity (0 to 3) by percentage of tumor cells [20].
Bioinformatics analysis of GSE108656
To explore the potential mechanism, the GEO database was searched to study the roles of SETDB1 in BC. The search details were (SETDB1[Description] AND breast cancer[Description]) AND “Homo sapiens”[porgn: __txid9606]) AND “Homo sapiens”[porgn: __txid9606]. The GSE108656 dataset was included in our analysis. GSE108656 is an expression profile of the human breast cancer cell line MDA-MB-231 upon silencing of SETDB1. The dataset was based on the GPL10558Illumina Human HT-12V4.0 expression bead chip platform. The raw data were analyzed using the GEO2R tool. To screen differentially expressed genes (DEGs) between SETDB1-silenced cells and control, the adjusted p-value <0.05 and |log2FC| >2.0 were used as cutoff criteria [21]. A volcano plot was applied to show the DEGs in GSE108656.
For the function annotation of SETDB1, the DEGs were analyzed for Gene Ontology (GO) terms (biological process) using the GO database, an online database that provides a comprehensive interpretation of summed genes. Kyoto encyclopedia of genes and genomes (KEGG) pathway was enriched by using the DAVID database (Version 6.7). P<0.05 was set as a cutoff for significance.
STRING database was used to obtain the networks of DEGs. To evaluate the interactive associations among SETDB1-related DEGs, the obtained DEGs were analyzed by STRING to get the PPI network, which was visualized by Cytoscape software (version 3.4.0). Moreover, the hub genes were screened by using the Cytoscape plugin cytoHubba. The set parameters in cytoHubba were as follows: hubba nodes: top 10 nodes ranked by degree, display options: check the first-stage nodes, display the shortest path, and display the expanded subnetwork.
Statistical analyses
Statistical analyses were performed using SPSS 22.0 software (IBM SPSS Statistics, Armonk, NY, USA). Using web-based bioinformatics tools, statistical analysis was automatically obtained. To assess the relationship between SETDB1 expression and clinical parameters, categorical variables were analyzed using the chi-squared tests or Fisher’s exact test [22]. P<0.05 was considered a statistically significant difference.
Results
SETDB1 overexpression in BC within the public databases
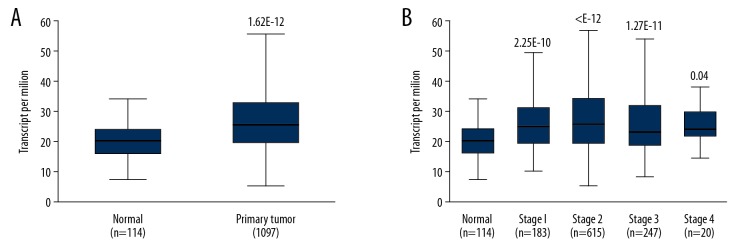
The transcriptional level of SETDB1 in BC was analyzed within the UALCAN database. The results showed the levels of SETDB1 were relatively upregulated in BC (Figure 1A). In terms of tumor stages, the levels of SETDB1 were significantly elevated in all stages compared with normal counterparts (Figure 1B). Intriguingly, SETDB1 was not only upregulated in BC, but was also induced in other types of cancers, including cervical cancer, liver cancer, lymphoma, and sarcoma according to the ONCOMINE database (Supplementary Figure 1).
Figure 1.
Expression levels of SETDB1 gene are upregulated in breast cancer. (A) Box plot showed the relative expression of SETDB1 in tumor tissues compared with non-tumor tissues from the UALCAN database. (B) Box plot shows relative expression of SETDB1 in normal individuals or in BC patients with different clinical stages. * P<0.01.
Correlation of SETDB1 expression with patient survival in BC
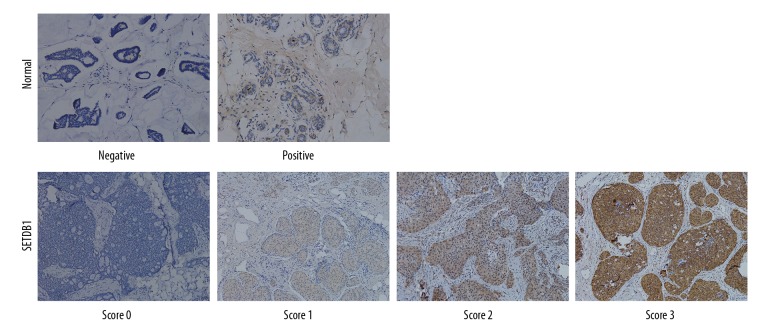
To verify the transcriptional levels of SETDB1 in BC, 159 BC tissues were subjected to IHC assay. Expectedly, SETDB1 was upregulated in BC tissues relative to the normal controls. Representative immunostaining of SETDB1 with different staining levels (score: 0~3) along with negative and positive controls are shown in Figure 2. Next, we determined the relationship between the protein levels of SETDB1 and the clinical parameters of patients with BC. Our results demonstrated that high level of SETDB1 expression was correlated with tumor size (P=0.028), lymph node metastasis (P<0.001), clinical stage (P<0.001), and histological grading (P=0.012). No significant correlation was observed between SETDB1 expression levels and age and receptor status (P>0.05, Table 1).
Figure 2.
Representative immunostaining of SETDB1 in breast cancer. Representative immunostaining of SETDB1 scaled 0, 1, 2, 3, along with positive and negative controls. Sections of human normal breast tissues were used as control. Negative controls were incubated with immunoglobulin fraction in place of polyclonal primary antibody. All representative images were taken at power of ×100.
Table 1.
Correlation of SETDB1 with clinicopathological factors (n=159).
| Variable | Total | SETDB1expression | r | p-Value | |
|---|---|---|---|---|---|
| Low | High | ||||
| All cases | 159 | 78 | 81 | ||
| Age (year) | |||||
| <50 | 58 | 25 | 33 | −0.09 | 0.258 |
| ≥50 | 101 | 53 | 48 | ||
| Tumor size(cm) | |||||
| <2.5 | 90 | 51 | 39 | 0.174 | 0.028* |
| ≥2.5 | 69 | 27 | 42 | ||
| Lymph-node metastasis | |||||
| Negative | 97 | 64 | 33 | 0.423 | <0.001* |
| Positive | 62 | 14 | 48 | ||
| TNM classification | |||||
| I | 59 | 41 | 18 | 0.409 | <0.001* |
| II | 66 | 33 | 33 | ||
| III | 32 | 4 | 28 | ||
| IV | 2 | 0 | 2 | ||
| Histological grade | |||||
| I | 19 | 15 | 4 | 0.198 | 0.012* |
| II | 114 | 53 | 61 | ||
| III | 26 | 10 | 16 | ||
| ER status | |||||
| Negative | 65 | 27 | 38 | −0.125 | 0.116 |
| Positive | 94 | 51 | 43 | ||
| PR status | |||||
| Negative | 86 | 43 | 43 | 0.020 | 0.798 |
| Positive | 73 | 35 | 38 | ||
| HER-2 status | |||||
| Negative | 61 | 29 | 32 | −0.024 | 0.765 |
| Positive | 98 | 49 | 49 | ||
| Subtype | |||||
| Luminal A | 37 | 20 | 17 | 0.134 | 0.093 |
| Luminal B | 63 | 35 | 28 | ||
| HER-2overexpression | 35 | 14 | 21 | ||
| TNBC | 24 | 9 | 15 | ||
To explore the prognostic value of SETDB1 in BC, the relationship between the level of SETDB1 and survival time was assessed by using an online database (http://genomics.jefferson.edu). SETDB1 overexpression was significantly correlated with poor overall survival (P=0.015; Figure 3A). Then, we analyzed the correlation of relapse-free survival with SETDB1 expression among patients with BC. These results also showed that patients with high SETDB1 expression experienced significantly shorter relapse-free survival than those with low SETDB1 expression (P=0.027; Figure 3B). Taken together, our results suggest that the expression of SETDB1 is a prognostic indicator for BC patients.
Figure 3.
The prognostic value of SETDB1 in breast cancer. Kaplan-Meier curves showed high mRNA expression levels of SETDB1 was associated with unfavorable overall survival (A) and relapse-free survival (B) in patients with breast cancer.
Identification of DEGs in GSE108656
To explore the potential mechanism underlying SETDB1-promoted BC, we searched the GEO database and obtained the transcriptome of human BC cell lines by silencing of SETDB1 and GSE108656. We used the GEO2R tool to screen the DEGs between control and MDA-MB231 BC cells upon silencing of SETDB1. A total of 323 DEGs were identified from the dataset (available on request). As shown in Figure 4, there were 248 upregulated DEGs and 75 downregulated DEGs.
Figure 4.
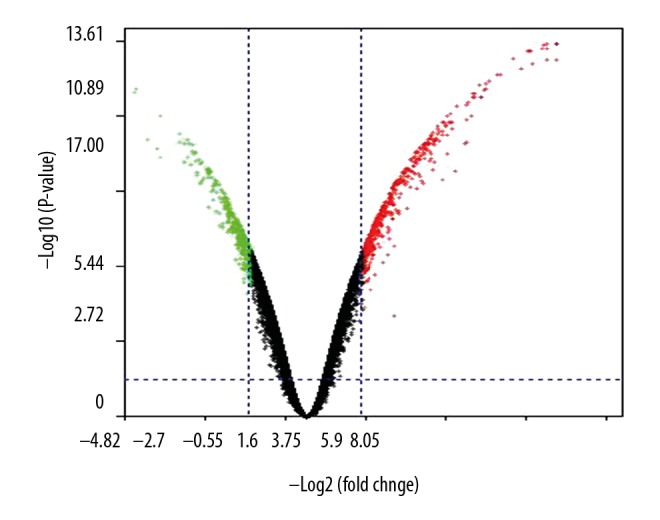
Identification of the DEGs between SETDB1-silenced BC cells and control. The volcano plot shows the DEG distributions in both up- and downregulated genes. The green color shows the downregulated genes, while the red indicates the upregulated genes.
Functional annotation for DEGs
To identify the DEGs functions, all the DEGs were imported into DAVID. As shown in Table 2, the top 10 significant biological process GO terms were response to external stimulus (GO: 0009605), response to wounding (GO: 0009611), regulation of protein transport (GO: 0051223), regulation of establishment of protein localization (GO: 0070201), regulation of protein localization (GO: 0032880), organ development (GO: 0048513), angiogenesis (GO: 0001525), localization of cell (GO: 0051674), cell motility (GO: 0048870), and cell migration (GO: 0016477).
Table 2.
Go analysis of differentially expressed genes in Biological processes.
| Term | Count | P value | Genes |
|---|---|---|---|
| GO: 0009605~response to external stimulus | 40 | 1.24E-08 | KYNU, SHROOM3, F2RL1, ITGB2, GPR68, MDK, TIMP3, TYMP, SAA2, MAP1LC3A, CXCR4, BCHE, GSN, SAA1, SERPINA3, SERPINA1, CFD, SREBF1, TXNIP, BMP4, MUC1, IL6, CMKLR1, CFB, RXRA, SAA4, ITGA2, CHST4, NLRP3, COL5A1, AOX1, ECSCR, CTSD, PLLP, ID3, CTSB, ENG, CD14, IGFBP4, F2R |
| GO: 0009611~response to wounding | 28 | 8.70E-08 | F2RL1, ITGB2, GPR68, TIMP3, MDK, SAA2, CXCR4, SAA1, GSN, SERPINA3, SERPINA1, CFD, IL6, CFB, RXRA, SAA4, ITGA2, CHST4, NLRP3, COL5A1, AOX1, PLLP, ID3, CTSB, ENG, CD14, IGFBP4, F2R |
| GO: 0051223~regulation of protein transport | 13 | 2.52E-07 | BMP4, PRKCZ, IL6, SAA2, SAA1, ANG, PYCARD, BCL3, NLRP3, PKIA, NLRP2, LCP1, SRGN |
| GO: 0070201~regulation of establishment of protein localization | 13 | 4.85E-07 | BMP4, PRKCZ, IL6, SAA2, SAA1, ANG, PYCARD, BCL3, NLRP3, PKIA, NLRP2, LCP1, SRGN |
| GO: 0032880~regulation of protein localization | 13 | 1.99E-06 | BMP4, PRKCZ, IL6, SAA2, SAA1, ANG, PYCARD, BCL3, NLRP3, PKIA, NLRP2, LCP1, SRGN |
| GO: 0048513~organ development | 53 | 3.68E-06 | S100A4, GYPC, PGF, JAG1, HLA-DMA, SPRY1, ANG, CXCR4, GSN, AR, RXRA, PTPRU, TNS3, G6PD, TAGLN, CST6, LAMC2, LAMC1, SHROOM3, ALDOC, SOX4, EHF, MDK, TIMP3, TAGLN3, CD74, FOXQ1, TYMP, CRISPLD2, PPL, BCL3, AHNAK2, ZC3H12A, LFNG, SRGN, DCLK1, COL18A1, BMP4, TXNIP, IL6, EPAS1, FOXA1, ITGA2, COL5A1, GJB2, WNT7B, ID1, LAMA5, ECSCR, PHGDH, ID3, ENG, F2R |
| GO: 0001525~angiogenesis | 13 | 4.15E-06 | COL18A1, BMP4, TYMP, EPAS1, CXCR4, ID1, ANG, LAMA5, PGF, ECSCR, ZC3H12A, JAG1, ENG |
| GO: 0051674~localization of cell | 18 | 8.21E-06 | IL6, S100P, ITGB2, DNAH2, COL5A1, TNS3, TNS1, SAA2, CXCR4, ID1, SAA1, LAMA5, ANG, PRSS3, LAMC1, ENG, DCLK1, LRP5 |
| GO: 0048870~cell motility | 18 | 8.21E-06 | IL6, S100P, ITGB2, DNAH2, COL5A1, TNS3, TNS1, SAA2, CXCR4, ID1, SAA1, LAMA5, ANG, PRSS3, LAMC1, ENG, DCLK1, LRP5 |
| GO: 0016477~cell migration | 17 | 8.61E-06 | IL6, S100P, ITGB2, COL5A1, TNS3, TNS1, SAA2, CXCR4, ID1, SAA1, LAMA5, ANG, PRSS3, LAMC1, ENG, DCLK1, LRP5 |
For KEGG pathway enrichment analysis (Table 3), a total of 11 pathways were significantly enriched (P≤0.05). Among these pathways, the most significant term was antigen processing and presentation, containing 9 DEGs (KLRC2, KLRC3, HLA-DRB4, HLA-DPA1, CTSB, HLA-DMB, HLA-DMA, CD74, and HLA-DRA). Other enriched terms were: hsa04672: Intestinal immune network for IgA production, hsa05332: Graft-versus-host disease, hsa04940: Type I diabetes mellitus, hsa05310: Asthma, hsa05330: Allograft rejection, hsa05416: Viral myocarditis, hsa04514: Cell adhesion molecules (CAMs), hsa05320: Autoimmune thyroid disease, hsa04512: ECM-receptor interaction, and hsa05200: Pathways in cancer.
Table 3.
KEGG pathway analysis of differentially expressed genes.
| Term | Count | P value | Genes |
|---|---|---|---|
| hsa04612: Antigen processing and presentation | 9 | 0.0002 | KLRC2, KLRC3, HLA-DRB4, HLA-DPA1, CTSB, HLA-DMB, HLA-DMA, CD74, HLA-DRA |
| hsa04672: Intestinal immune network for IgA production | 7 | 0.0003 | IL6, CXCR4, HLA-DRB4, HLA-DPA1, HLA-DMB, HLA-DMA, HLA-DRA |
| hsa05332: Graft-versus-host disease | 6 | 0.0008 | IL6, HLA-DRB4, HLA-DPA1, HLA-DMB, HLA-DMA, HLA-DRA |
| hsa04940: Type I diabetes mellitus | 6 | 0.0012 | CPE, HLA-DRB4, HLA-DPA1, HLA-DMB, HLA-DMA, HLA-DRA |
| hsa05310: Asthma | 5 | 0.0021 | HLA-DRB4, HLA-DPA1, HLA-DMB, HLA-DMA, HLA-DRA |
| hsa05330: Allograft rejection | 5 | 0.0048 | HLA-DRB4, HLA-DPA1, HLA-DMB, HLA-DMA, HLA-DRA |
| hsa05416: Viral myocarditis | 6 | 0.0115 | HLA-DRB4, ITGB2, HLA-DPA1, HLA-DMB, HLA-DMA, HLA-DRA |
| hsa04514: Cell adhesion molecules (CAMs) | 8 | 0.0132 | PECAM1, HLA-DRB4, ITGB2, HLA-DPA1, CLDN11, HLA-DMB, HLA-DMA, HLA-DRA |
| hsa05320: Autoimmune thyroid disease | 5 | 0.0162 | HLA-DRB4, HLA-DPA1, HLA-DMB, HLA-DMA, HLA-DRA |
| hsa04512: ECM-receptor interaction | 6 | 0.0224 | LAMA5, ITGB4, ITGA2, LAMC2, LAMC1, COL5A1 |
| hsa05200: Pathways in cancer | 13 | 0.0228 | JUP, BMP4, AR, IL6, WNT7B, EPAS1, LAMA5, PGF, RXRA, ITGA2, LAMC2, LAMC1, CRK |
Analysis of protein-protein interactions (PPI) and hub genes
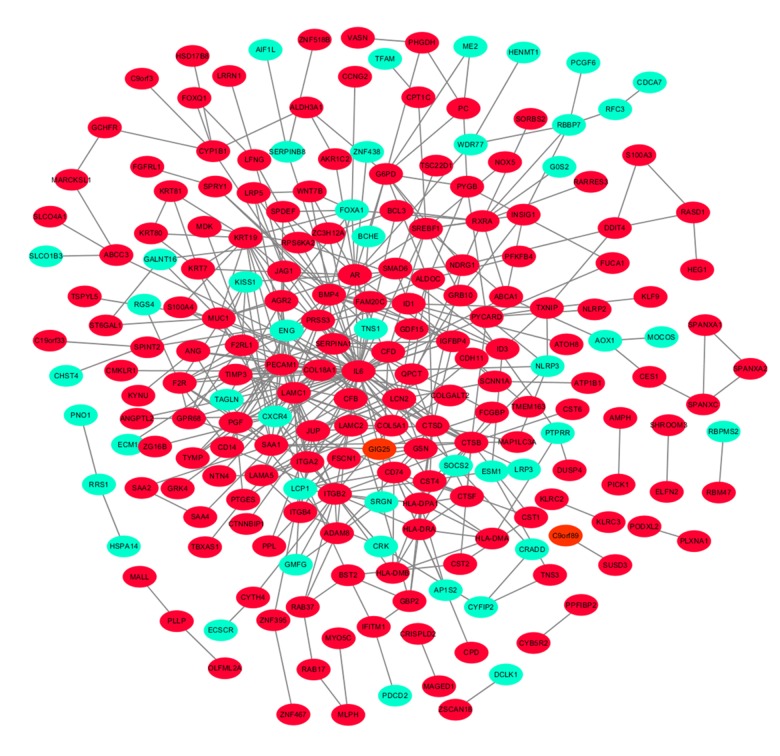
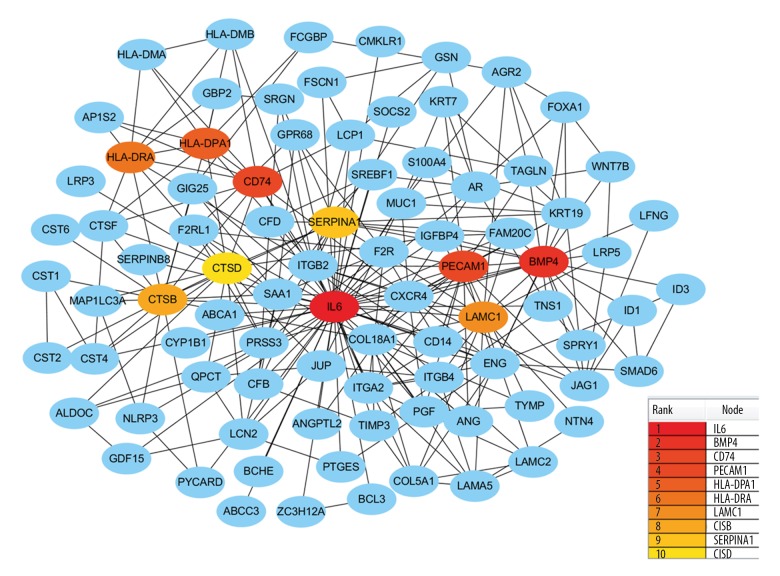
In addition to the DEGs, the PPI network and hub genes were further analyzed. The interactions among the 323 DEGs were analyzed by STRING with a combined score ≥0.4 and visualized by Cytoscape software. The PPI network of the DEGs consisted of 278 nodes and 451 edges (Figure 5). CytoHubba analysis showed 10 hub genes: IL6, BMP4, CD74, PECAM1, HLA-DPA1, HLA-DRA, LAMC1, CTSB, SERPINA1, and CTSD (Figure 6). Of the 10 hub genes, only SERPINA1 was downregulated, while the other 9 hub genes were upregulated. The MCODE result showed the most significant module contained 11 nodes with 8 hub genes (Figure 7).
Figure 5.
Protein-protein interaction network of DEGs. The green color shows the downregulated genes, while the red indicates the upregulated genes.
Figure 6.
Identification of hub DEGs by cytoHubba plugin. The rank of connection degree is represented by different degrees of color (from red to yellow).
Figure 7.
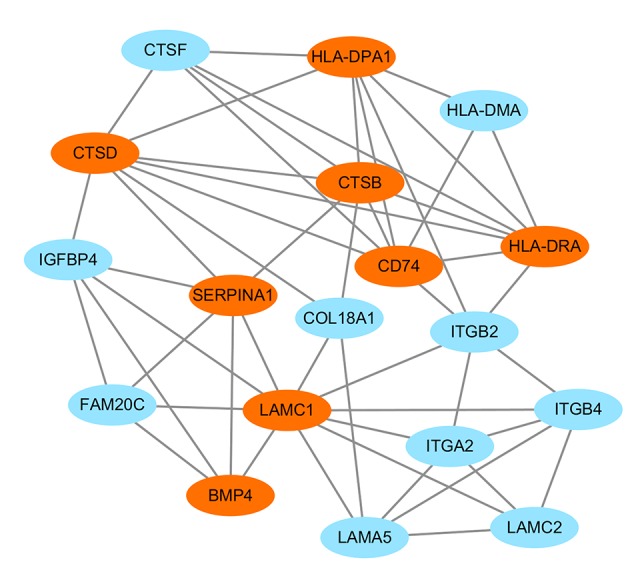
The significant module network analyzed by MCODE. The orange color represents hub genes.
Discussion
SETDB1 is involved in heterochromatin formation and gene expression through trimethylation of H3K9 (H3K9me3). Gene amplification of SETDB1 is observed in various cancer cell types, suggesting the role of SETDB1 in carcinogenesis. However, the clinical performance of SETDB1 expression is not fully characterized, and the potential mechanism(s) of SETDB1 contributing to breast tumorigenesis remain unexplored. Here, we initially explored SETDB1 expression in BC by integrating the public online databases UALCAN and ONCOMINE. Both databases showed that the levels of SETDB1 transcription in BC were significantly higher than in normal tissues. Consistent with the public datasets, our IHC results showed the levels of SETDB1 protein were significantly elevated and high levels were strongly associated with poor clinical prognosis. To the best of our knowledge, our study is the first to investigate the clinical characteristics of SETDB1 protein by IHC in a relatively large cohort of BC patients. To this end, we conducted different bioinformatics using the GEO microarray dataset to compare the expression profiles between SETDB1-silenced BC cells and control. Our results showed SETDB1 mainly participates in regulating antigen processing and presentation, as well as the immune network in BC. Moreover, our results indicted the function of SETDB1 in BC could be associated with the hub genes IL-6, BMP4, CD74, PECAM1, HLA-DPA1, and HLA-DRA. Taken together, our results indicated that SETDB1 overexpression was correlated with poor prognosis in BC patients and SETDB1 might be involved in BC development by its regulation of immune response.
SETDB1 is an important histone methyltransferase (HMT) specific for lysine 9 position on histone H3 and is involved in transcription repression through H3K9me3 [4,23]. The SETDB1 gene was amplified in these cancers. The SETDB1 gene exhibited increased amplification frequency in basal-like BC conditions compared with HER2 and Luminal-A and -B cancer subtypes [15]. In agreement with the public transcriptome data, a recent study reported that SETDB1 protein was significantly increased in 43 BC tissues [14]. To extend these findings, we performed IHC assay in a cohort of 159 patients with BC and showed that SETDB1 expression was associated with tumor size (P=0.028), lymph node metastasis (P<0.001), histological grading (P=0.012), and clinical stage (P<0.001). Furthermore, SETDB1 was shown to be a prognostic biomarker for BC in subsequent survival analyses. Therefore, it appears that SETDB1 is involved in the BC progression, but its molecular mechanism needs further investigation.
According to functional enrichment analysis, SETDB1 was mainly involved in the response to external stimulus, and its closely related pathway was associated with antigen processing and presentation as well as the immune network. Consistent with these results, Adoue et al. demonstrated that SETDB1 resulted in H3K9me3 deposition at a cell-type-specific set and ensured Th cell lineage integrity by inhibiting a repertoire of endogenous retroviruses [24]. Moreover, a recent observation showed that SEDB1 significantly prevented the expression of the proinflammatory cytokine (IL-6) through its methyltransferase activity in macrophages, and macrophage-specific Setdb1-knockout mice had higher serum interleukin-6 concentrations [25]. Additionally, the knockdown of SETDB1 interfered with the interaction between PIWIL4 and HP1 proteins, indicating SETDB1 is important for the differentiation of monocytes [26]. Thus, our results, together with the above-mentioned observations, indicate SETDB1 regulates the innate immune cells during environmental and intrinsic stress.
In addition to function enrichment, our bioinformatics analysis also showed SETDB1 was significantly associated with 10 hub genes: IL-6, BMP4, CD74, PECAM1, HLA-DPA1, HLA-DRA, LAMC1, CTSB, SERPINA1, and CTSD. Among the hub genes, IL-6, BMP4, CD74, PECAM1, HLA-DPA1, and HLA-DRA were shown to play a role in the immune response. IL-6 plays an important role in the development and progression of inflammatory responses. Our results suggest that specific knockdown of SETDB1 induced the expression of IL-6. In line with the above phenomena, Hachiva et al. reported Setdb1 induced TLR4-mediated IL-6 expression in macrophages and macrophage-specific knockout mice [25], suggesting SETDB1 is involved in IL-6 transcription and the inflammatory response in BC. Except for IL-6, the other 9 hub genes have not been shown to be linked to SETDB1. For example, CD74 is widely expressed in human immune cells, including B cells, activated T cell subsets, monocytes, macrophages, and dendritic cells [27]. Although CD74 was originally identified as an MHC class II chaperone, accumulating evidence shows that CD74 has diverse roles in immune responses [28]. Given CD74 as a hub gene in our study, we hypothesized that the interplay between SETDB1 and CD74 has a crucial role in immune responses and thus regulates the development of BC.
Our study has certain limitations. First, we only detected the expression of SETDB1 in BC by IHC. Further validation using PCR and Western blotting should be performed in the future. Second, the biological functions of SETDB1 in BC should be investigated. Based on the biological mechanism of SETDB1 in immune response, we will focus on the SETDB1-mediated IL-6 expression in BC, which needs to be confirmed.
Conclusions
In summary, our study showed that the elevated SETDB1 expression was strongly correlated with poor prognosis in BC, and SETDB1 expression could be a promising biomarker for the prognosis of BC patients. Our future works will concentrate on identification of the hub gene that is regulated by SETDB1. By exploring the functional aspects of SETDB1 and its hub genes, we will aim to evaluate its eligibility as a potential target in BC therapy.
Supplementary Data
ONCOMINE database showed SETDB1 expression in various types of tumors.
Acknowledgements
We thank our friends for providing help and encouragement.
Footnotes
Conflicts of interests
None.
Source of support: Departmental sources
References
- 1.Colozza M, Azambuja E, Cardoso F, et al. Proliferative markers as prognostic and predictive tools in early breast cancer: Where are we now? Ann Oncol. 2005;16(11):1723–39. doi: 10.1093/annonc/mdi352. [DOI] [PubMed] [Google Scholar]
- 2.Lin H, Huang JF, Qiu JR, et al. Significantly upregulated TACSTD2 and Cyclin D1 correlate with poor prognosis of invasive ductal breast cancer. Exp Mol Pathol. 2013;94(1):73–78. doi: 10.1016/j.yexmp.2012.08.004. [DOI] [PubMed] [Google Scholar]
- 3.Xu X, Tang X, Lu M, et al. Overexpression of MAGE-A9 predicts unfavorable outcome in breast cancer. Exp Mol Pathol. 2014;97(3):579–84. doi: 10.1016/j.yexmp.2014.11.001. [DOI] [PubMed] [Google Scholar]
- 4.Karanth AV, Maniswami RR, Prashanth S, et al. Emerging role of SETDB1 as a therapeutic target. Expert Opin Ther Targets. 2017;21(3):319–31. doi: 10.1080/14728222.2017.1279604. [DOI] [PubMed] [Google Scholar]
- 5.Yahiro K, Higashihori N, Moriyama K. Histone methyltransferase Setdb1 is indispensable for Meckel’s cartilage development. Biochem Biophys Res Commun. 2017;482(4):883–88. doi: 10.1016/j.bbrc.2016.11.128. [DOI] [PubMed] [Google Scholar]
- 6.Gauchier M, Kan S, Barral A, et al. SETDB1-dependent heterochromatin stimulates alternative lengthening of telomeres. Sci Adv. 2019;5(5) doi: 10.1126/sciadv.aav3673. pii: eaav3673. [DOI] [PMC free article] [PubMed] [Google Scholar]
- 7.Cruz-Tapias P, Robin P, Pontis J, et al. The H3K9 methylation writer SETDB1 and its reader MPP8 cooperate to silence satellite DNA repeats in mouse embryonic stem cells. Genes (Basel) 2019;10(10):750–66. doi: 10.3390/genes10100750. [DOI] [PMC free article] [PubMed] [Google Scholar]
- 8.Matsui T, Leung D, Miyashita H, et al. Proviral silencing in embryonic stem cells requires the histone methyltransferase ESET. Nature. 2010;464(7290):927–31. doi: 10.1038/nature08858. [DOI] [PubMed] [Google Scholar]
- 9.Sepsa A, Levidou G, Gargalionis A, et al. Emerging role of linker histone variant H1x as a biomarker with prognostic value in astrocytic gliomas. A multivariate analysis including trimethylation of H3K9 and H4K20. PLoS One. 2015;10(1):e0115101. doi: 10.1371/journal.pone.0115101. [DOI] [PMC free article] [PubMed] [Google Scholar]
- 10.Lee S, Lee C, Hwang CY, et al. Network inference analysis identifies SETDB1 as a key regulator for reverting colorectal cancer cells into differentiated normal-like cells. Mol Cancer Res. 2020;18(1):118–29. doi: 10.1158/1541-7786.MCR-19-0450. [DOI] [PubMed] [Google Scholar]
- 11.Cruz-Tapias P, Zakharova V, Perez-Fernandez OM, et al. Expression of the major and pro-oncogenic H3K9 lysine methyltransferase SETDB1 in non-small cell lung cancer. Cancers (Basel) 2019;11(8):1134–37. doi: 10.3390/cancers11081134. [DOI] [PMC free article] [PubMed] [Google Scholar]
- 12.Orouji E, Federico A, Larribere L, et al. Histone methyltransferase SETDB1 contributes to melanoma tumorigenesis and serves as a new potential therapeutic target. Int J Cancer. 2019;145(12):3462–77. doi: 10.1002/ijc.32432. [DOI] [PubMed] [Google Scholar]
- 13.Xiao JF, Sun QY, Ding LW, et al. The c-MYC-BMI1 axis is essential for SETDB1-mediated breast tumourigenesis. J Pathol. 2018;246:89–102. doi: 10.1002/path.5126. [DOI] [PubMed] [Google Scholar]
- 14.Liu L, Kimball S, Liu H, et al. Genetic alterations of histone lysine methyltransferases and their significance in breast cancer. Oncotarget. 2015;6(4):2466–82. doi: 10.18632/oncotarget.2967. [DOI] [PMC free article] [PubMed] [Google Scholar]
- 15.Ryu TY, Kim K, Kim SK, et al. SETDB1 regulates SMAD7 expression for breast cancer metastasis. BMB Rep. 2019;52(2):139–44. doi: 10.5483/BMBRep.2019.52.2.235. [DOI] [PMC free article] [PubMed] [Google Scholar]
- 16.Chandrashekar DS, Bashel B, Balasubramanya SAH, et al. UALCAN: A portal for facilitating tumor subgroup gene expression and survival analyses. Neoplasia. 2017;19(8):649–58. doi: 10.1016/j.neo.2017.05.002. [DOI] [PMC free article] [PubMed] [Google Scholar]
- 17.Rhodes DR, Kalyana-Sundaram S, Mahavisno V, et al. Oncomine 3.0: Genes, pathways, and networks in a collection of 18,000 cancer gene expression profiles. Neoplasia. 2007;9(2):166–80. doi: 10.1593/neo.07112. [DOI] [PMC free article] [PubMed] [Google Scholar]
- 18.Cao XX, Xu JD, Liu XL, et al. RACK1: A superior independent predictor for poor clinical outcome in breast cancer. Int J Cancer. 2010;127(5):1172–79. doi: 10.1002/ijc.25120. [DOI] [PubMed] [Google Scholar]
- 19.Giuliano AE, Connolly JL, Edge SB, et al. Breast cancer-major changes in the American Joint Committee on Cancer eighth edition cancer staging manual. Cancer J Clin. 2017;67(4):290–303. doi: 10.3322/caac.21393. [DOI] [PubMed] [Google Scholar]
- 20.Ruan GT, Gong YZ, Liao XW, et al. Diagnostic and prognostic values of CXC motif chemokine ligand 3 in patients with colon cancer. Oncol Rep. 2019;42(5):1996–2008. doi: 10.3892/or.2019.7326. [DOI] [PMC free article] [PubMed] [Google Scholar]
- 21.Tan A, Luo R, Liang H, et al. Bioinformatics approach reveals the key role of CXC motif chemokine receptor 2 in endometriosis development. Mol Med Rep. 2018;18(3):2841–49. doi: 10.3892/mmr.2018.9275. [DOI] [PMC free article] [PubMed] [Google Scholar]
- 22.Xu Q, Ge Q, Zhou Y, et al. MELK promotes endometrial carcinoma progression via activating mTOR signaling pathway. EBioMedicine. 2020;51:102609. doi: 10.1016/j.ebiom.2019.102609. [DOI] [PMC free article] [PubMed] [Google Scholar]
- 23.Torrano J, Al Emran A, Hammerlindl H, et al. Emerging roles of H3K9me3, SETDB1 and SETDB2 in therapy-induced cellular reprogramming. Clin Epigenetics. 2019;11(1):43. doi: 10.1186/s13148-019-0644-y. [DOI] [PMC free article] [PubMed] [Google Scholar]
- 24.Adoue V, Binet B, Malbec A, et al. The histone methyltransferase SETDB1 controls T helper cell lineage integrity by repressing endogenous retroviruses. Immunity. 2019;50(3):629–44.e8. doi: 10.1016/j.immuni.2019.01.003. [DOI] [PubMed] [Google Scholar]
- 25.Hachiya R, Shiihashi T, Shirakawa I, et al. The H3K9 methyltransferase Setdb1 regulates TLR4-mediated inflammatory responses in macrophages. Sci Rep. 2016;6:28845. doi: 10.1038/srep28845. [DOI] [PMC free article] [PubMed] [Google Scholar]
- 26.Zhang X, He X, Liu C, et al. IL-4 inhibits the biogenesis of an epigenetically suppressive PIWI-interacting RNA to upregulate CD1a molecules on monocytes/dendritic cells. J Immunol. 2016;196(4):1591–603. doi: 10.4049/jimmunol.1500805. [DOI] [PubMed] [Google Scholar]
- 27.Stein R, Mattes MJ, Cardillo TM, et al. CD74: A new candidate target for the immunotherapy of B-cell neoplasms. Clin Cancer Res. 2007;13(18):5556s–63s. doi: 10.1158/1078-0432.CCR-07-1167. [DOI] [PubMed] [Google Scholar]
- 28.Zhao S, Molina A, Yu A, et al. High frequency of CD74 expression in lymphomas: Implications for targeted therapy using a novel anti-CD74-drug conjugate. J Pathol Clin Res. 2019;5(1):12–24. doi: 10.1002/cjp2.114. [DOI] [PMC free article] [PubMed] [Google Scholar]
Associated Data
This section collects any data citations, data availability statements, or supplementary materials included in this article.
Supplementary Materials
ONCOMINE database showed SETDB1 expression in various types of tumors.


