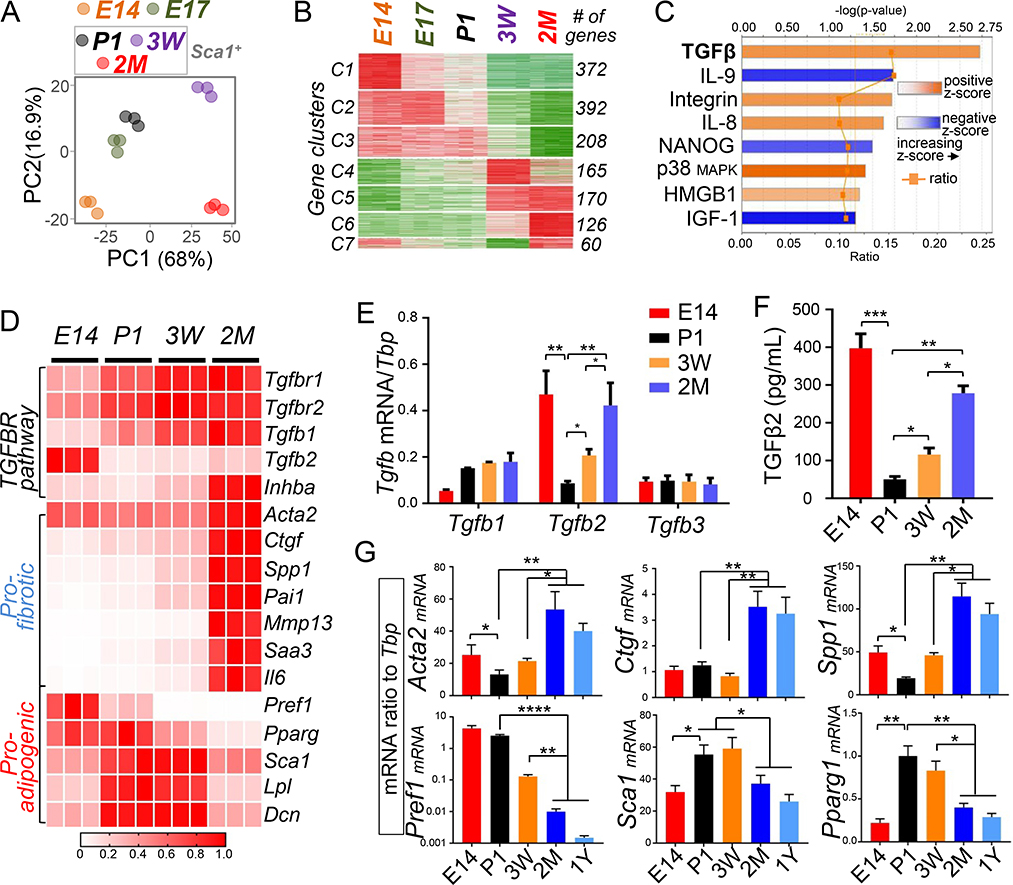
Figure 3. Activation of the TGFβ pathway is associated with the loss of antimicrobial function of dFB.
(A). Principle component analysis plot for RNA-seq showing differential clustering of E14, E17 or Sca1+ sorted P1, 3 week and 2 month dFB. Dots with the same color represent biological replicates in indicated age group (n=3/age group). (B). Time course analyses by maSigPro identified 7 gene clusters with distinct expression dynamics in dFB from E14 ~ 2 month as indicated. # of genes in each cluster is indicated on the right. (C). Ingenuity Pathway Analysis (IPA) identified several signaling pathways that were activated (orange) or inhibited (blue) in 2 month Sca1+ dFB compared to P1 Sca1+ dFB. Respective –log(p-value), z-score and ratio is shown for each pathway. The calculated z-score indicates a pathway with genes exhibiting overall increased mRNA (orange bars) or decreased mRNA expression (blue bars). The ratio (orange dots connected by a line) indicates the ratio of genes from the dataset that map to the pathway divided by the total number of genes that map to the same pathway, e.g. >15% for TGFβ signaling. (D). Heatmap showing relative mRNA expression (based on RNA-seq derived RPKM values) of a panel of TGFBR pathway gene, pro-fibrotic genes or pro-adipogenic genes in primary dFB (average of n=3/group). (E). RTqPCR analyses showing mRNA expression of TGFβ family genes (ratio to Tbp) in dFB at indicated ages (n=3/group). (F). TGFβ2 protein secretion (pg/mL) in the conditioned medium of dFB was quantified by ELISA (n=3/group). (G). RTqPCR analyses validating age-dependent changes of mRNA expression of pro-adipogenic genes (Pref1, Sca1 and Pparg1) or pro-fibrotic genes (Acta2, Ctgf and Spp1) (n=3/group). All error bars indicate mean ± s.e.m. * P<0.05, ** P<0.01, *** P<0.001 (one way Anova). Please see also Figure S3.

