Abstract
Cisplatin and other metal-based drugs often display side effects and tumor resistance after prolonged use. Because rhenium-based anticancer complexes are often less toxic, a novel series of organorhenium complexes were synthesized of the types: XRe(CO)3Z (X = α-diimines and Z = p-toluenesulfonate, 1-naphthalenesulfonate, 2-naphthalenesulfonate, picolinate, nicotinate, aspirinate, naproxenate, flufenamate, ibuprofenate, mefenamate, tolfenamate, N-acetyl-tryptophanate), and their biological properties were examined. Specifically, in hormone-dependent MCF-7 and hormone-independent triple-negative MDA-MB-231 breast cancer cells, the p-toluenesulfonato, 1-naphthalenesulfonato, 2-naphthalenesulfonato, picolinato, nicotinato, acetylsalicylato, flufenamato, ibuprofenato, mefenamato, and N-acetyl-tryptophanato complexes were found to be far more potent than conventional drug cisplatin. DNA-binding studies were performed in each case via UV–Vis titrations, cyclic voltammetry, gel electrophoresis, and viscosity, which suggest DNA partial intercalation interaction, and the structure–activity relationship studies suggest that the anticancer activities increase with the increasing lipophilicities of the compounds, roughly consistent with their DNA-binding activities.
Keywords: Organorhenium, Sulfonate, Carboxylate, MCF-7, MDA-MB-231, Breast cancers
Introduction
More than four decades ago, Professor Mark Wrighton at MIT discovered the luminescent properties of (N⁀N)(CO)3ReCl (N⁀N = α – diimines) [1]. Since then countless papers have been published describing their uses as luminescent sensors [2], in optical switching [3], as molecular materials for nonlinear optics [4], in monitoring polymerizations [5], in labeling DNA or nucleobases [6, 7], etc. In 2000, Yan and coworkers [8] first described the cytotoxic properties of related rhenium (I) hydroxo and alkoxo carbonyl complexes. Now these and similar organorhenium (I) complexes have been established as strong anticancer agents. In a recent review article in the journal “ACS Chemical Biology,” Professor Gasser at the University of Zurich described the “Underestimated Potential of Organometallic Rhenium Complexes as Anticancer Agents” [9]. We embarked on our study on the cytotoxicity of (N⁀N)(CO)3ReZ (where Z represents sulfonates such as p-toluenesulfonates (a.k.a., tosylates) and naphthalenesulfonates, and carboxylates such as picolinates, nicotinates, tryptophanates, carboxylates from nonsteroidal anti-inflammatory drugs (NSAIDs), etc.) many years ago, primarily due to the facile access of these sulfonates and carboxylates from Mandal’s Synthesis [10, 11]. We have observed that many of these complexes are strong anticancer agents (IC50 < 2.0 μM) against U-937 lymphoma and BxPC-3 pancreatic cancer cell lines.
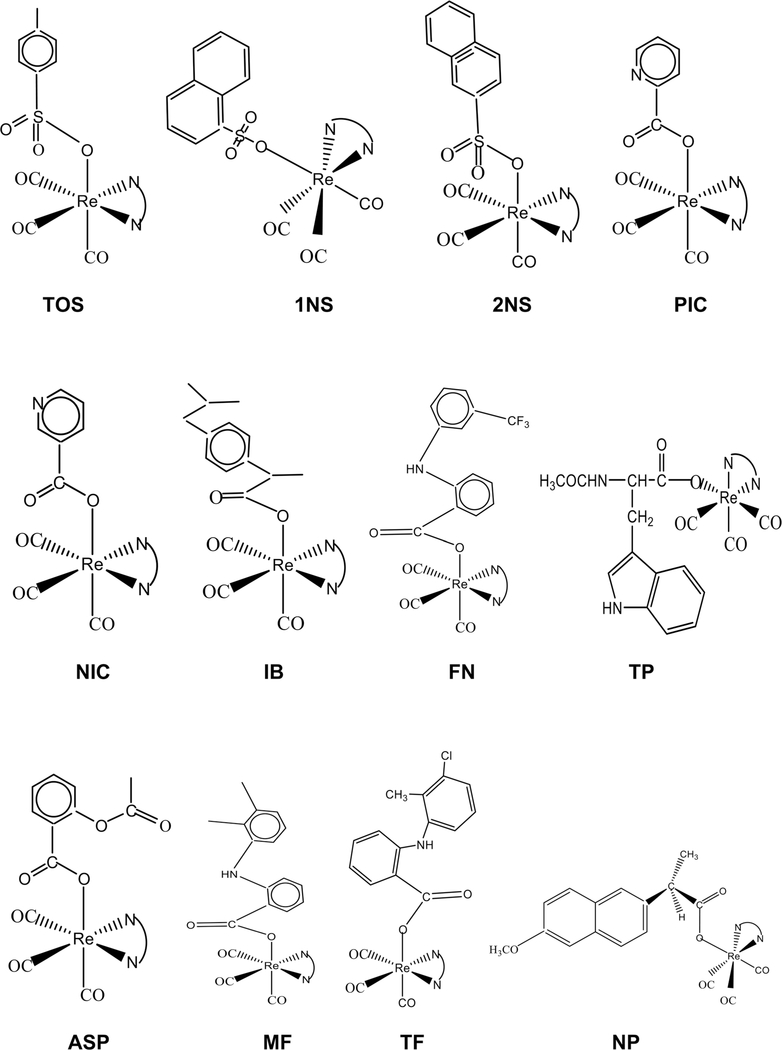
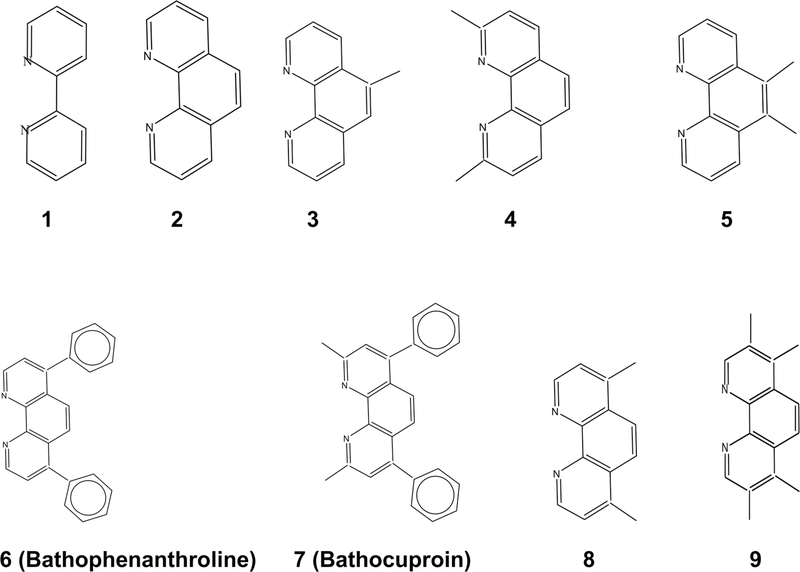
Almost half of all patients who receive chemotherapy are treated with cisplatin and other platinum drugs. Despite their tremendous successes, platinum drugs suffer from two drawbacks. They often display severe side effects, and the development of drug resistance often occurs. Likewise, the antiestrogen drug, tamoxifen, is used for patients suffering from ER(+) breast cancer. This drug causes endometrial cancer, and the tumor develops drug resistance upon prolonged usages. Ferrocene is an organometallic compound. Jaouen lab at Ecole Nationale Supérieure de Chimie de Paris synthesized numerous ferrocene derivatives of tamoxifen known as ferrocifens to avoid drug resistance [12]. It was observed that the ferrocifens are not only active on ER(+) breast cancer, but they work on aggressive ER(−) breast cancer as well. However, there is a possibility of liver damage due to iron overload [13]. Thus, the exploration of other metal centers should be considered via organometallic syntheses methods. One such metal center is the organorhenium scaffold, which is particularly promising because low IC50 values can also be achieved (<0.5 μM) and because we [14] and others [15–19] have demonstrated that organorhenium complexes exhibit very low toxicity on normal cells. For these reasons, we have synthesized a variety of organorhenium sulfonato and carboxylato complexes, which include p-toluenesulfonato (TOS), 1-naphthalenesulfonato (1NS), 2-naphthalenesulfonato (2NS), picolinato (PIC), nicotinato (NIC), N-acetyltryptophanato (TP), acetylsalicylato (ASP), flufenamato (FN), ibuprofenato (IB), mefenamato (MF), tolfenamato (TF), and naproxenato (NP) complexes. The structural formulas for 12 series of compounds are shown in Fig. 1, and those for the nitrogen-containing polypyridine ligands N⁀N are shown in Fig. 2.
Fig. 1.
Structural formulas for 12 series of organorhenium compounds
Fig. 2.
Structural formulas for the nitrogen-containing ligands N⁀N
Materials and methods
The starting materials, pentylcarbonato complexes, fac-(CO)3(N⁀N)ReOC(O)OC5H11; were synthesized through procedures described in the literature [10, 11]. The sulfonic and carboxylic acids were commercially available. The cell lines MCF-7, MCF-10A, and MDA-MB-231 were obtained directly from ATCC, and their catalog numbers are HTB-22, CRL-10317, and CRM-HTB-26, respectively. The UV–Vis spectra were recorded at room temperature using a Varian Cary 50 Scan UV–Vis spectrophotometer. FT-IR spectra were recorded using Perkin-Elmer spectrometer Spectrum Two, and FT-NMR spectra were recorded using Bruker Top Spin 400 MHz spectrometer.
Synthesis of the carboxylato and sulfonato complexes, (N⁀N)(CO)3ReZ
The complexes were obtained through Mandal’s Synthesis which involves the treatment of a pentylcarbonato complex [10, 11] with a corresponding sulfonic or carboxylic acid. The sulfonic acids used were p-toluenesulfonic acid, 1-naphthalenesulfonic acid, and 2-naphthalenesulfonic acid; the carboxylic acids used were picolinic acid, nicotinic acid, N-acetyl-L-tryptophan, acetylsalicylic acid, flufenamic acid, ibuprofen, mefenamic acid, tolfenamic acid, and naproxen. Typically, an equimolar mixture of a pentylcarbonato complex (100 mg) and a sulfonic or carboxylic acid in 15 mL of dichloromethane was allowed to be stirred for several hours. The reaction was monitored through IR spectroscopy. When the reaction was complete, the solution was concentrated on a rotary evaporator. Hexane was added and cooled −5 °C. The yellow–orange crystals were obtained through filtration. The yields range from 90 to 100%. The synthetic procedures havebeen presented at the American Chemical Society National Meetings [10, 11]. The complexes were characterized spectroscopically and in many cases crystallographically. The spectroscopic characterizations of the few highly potent compounds (TOS7, TOS6, NIC7, 1NS7, 2NS6, PIC7, IB6, PIC6, and 1NS6) are presented here. Data for TOS7: FT-IR (cm−1, CH2Cl2, ν(C≡O)) 2028 (s), 1923 (s), 1903 (s). 1H NMR (400 MHz, CDCl3) δ 7.86 (s, 2H), 7.67 (s, 2H), 7.61–7.56 (m, 6H), 7.52 (dt, J = 6.6, 2.0 Hz, 4H), 7.45–7.41 (m, 2H), 7.08–7.03 (m, 2H), 3.31 (s, 6H), 2.30 (s, 3H). 13C NMR (101 MHz, CDCl3) δ 195.77 (2C≡O), 192.01 (C≡O), 163.42, 151.38, 148.88, 140.63, 139.55, 135.79, 129.67, 129.44, 129.05, 128.73, 127.21, 126.49, 126.30, 124.35, 31.19, 21.36. Data for TOS6: FT-IR (cm−1, CH2Cl2, ν(C≡O)) 2029 (s), 1927 (s), 1905 (s). 1H NMR (400 MHz, CDCl3) d 9.39 (d, J = 5.3 Hz, 2H), 8.04 (s, 2H), 7.78 (d, J = 5.3 Hz, 2H), 7.65–7.55 (m, 12H), 7.14–7.09 (m, 2H), 2.34 (s, 3H). 13C NMR (101 MHz, CDCl3) δ 196.34, 192.24, 153.29, 151.74, 147.87, 140.72, 139.73, 135.45, 129.98, 129.55, 129.25, 128.77, 128.76, 126.51, 126.00, 125.56, 21.41. Data for NIC7: FT-IR (cm−1, CH2Cl2) ν(C≡O) 2020 (s), 1915 (s), 1893 (s), ν(C=O) 1628 (m). 1H NMR (400 MHz, CD2Cl2) δ 8.39 (dd, J = 4.8, 1.8 Hz, 1H), 8.18 (dd, J = 2.1, 0.9 Hz, 1H), 7.94 (s, 2H), 7.77 (s, 2H), 7.64–7.60 (m, 7H), 7.60–7.56 (m, 4H), 7.03 (ddd, J = 7.8, 4.8, 0.9 Hz, 1H), 3.47 (s, 6H). 13C NMR (101 MHz, CD2Cl2) d 198.40 (2C≡O), 194.55 (C≡O), 169.39 (C=O), 163.63 151.44, 150.90, 150.89, 149.37, 136.65, 136.37, 130.98, 129.96, 129.92, 129.39, 127.40, 126.47, 124.57, 122.73, 31.16 (CH3). Data for 1NS7: FT-IR (cm−1, CH2Cl2, ν(C≡O)) 2029 (s), 1923 (s), 1904 (s). 1H NMR (400 MHz, CD2Cl2) δ 7.86 (dd, J = 7.2, 1.3 Hz, 1H), 7.72–7.62 (m, 4H), 7.61–7.57 (m, 1H), 7.57–7.50 (m, 6H), 7.47 (s, 2H), 7.46–7.41 (m, 4H), 7.25 (dd, J = 8.2, 7.2 Hz, 1H), 7.17 (ddd, J = 8.1, 6.8, 1.2 Hz, 1H), 6.88 (ddd, J = 8.4, 6.8, 1.4 Hz, 1H), 3.06 (s, 6H). 13C NMR (101 MHz, CD2Cl2) δ 196.47 (2C≡O), 192.24 (C≡O), 163.66, 151.59, 148.94, 138.79, 136.19, 134.04, 131.85, 130.00, 129.94, 129.34, 128.59, 128.34, 127.32, 126.94, 126.84, 126.58, 126.11, 126.06, 124.67, 124.50, 31.56. Data for 2NS6: FT-IR (cm−1, CH2Cl2, ν(C≡O)) 2029 (s), 1926 (s), 1905 (s). 1H NMR (400 MHz, CD2Cl2) d 9.20 (d, J = 5.3 Hz, 2H), 7.82 (d, J = 9.1 Hz, 3H), 7.64–7.56 (m, 4H), 7.54–7.48 (m, 6H), 7.44 (d, J = 8.7 Hz, 1H), 7.42–7.31 (m, 6H), 7.16, J = 8.6, 1.8 Hz, 1H). 13C NMR (101 MHz, CD2Cl2) δ 197.22 (2C≡O), 192.62 (C≡O), 153.68, 152.21, 148.07, 140.92, 135.78, 134.01, 132.49, 130.36, 130.07, 129.55, 129.19, 129.04, 128.25, 127.94, 127.91, 127.20, 126.43, 126.30, 125.84, 123.03. Data for PIC7: FT-IR (cm−1, CH2Cl2) ν(C≡O) 2020 (s), 1913 (s), 1892 (s), ν(C=O) 1627 (m). 1H NMR (400 MHz, CDCl3) δ 8.37 (dd, J = 4.9, 1.8 Hz, 1H), 7.97–7.95 (m, 1H), 7.88 (s, 2H), 7.76 (dt, J = 7.8, 1.9 Hz, 1H), 7.68 (s, 2H), 7.58–7.54 (m, 6H), 7.51–7.46 (m, 4H), 7.03 (ddd, J = 7.9, 4.8, 0.9 Hz, 1H), 3.45 (s, 6H). 13C NMR (101 MHz, CDCl3) δ 197.51 (2C≡O), 194.08 (C≡O), 169.49, 163.21, 150.96, 150.41, 150.31, 149.01, 136.80, 135.78, 130.66, 129.62, 129.42, 129.03, 126.95, 125.94, 124.20, 122.52, 30.96. Data for IB6: FT-IR (cm−1, CH2Cl2) ν(C≡O) 2018 (s), 1915 (s), 1889 (s), ν(C=O) 1625 (m). 1H NMR (400 MHz, CD2Cl2) δ 9.32 (t, J = 5.3 Hz, 2H), 7.90 (s, 2H), 7.66 (dd, J = 15.3, 5.3 Hz, 2H), 7.61–7.47 (m, 10H), 6.33 (d, J = 8.1 Hz, 2H), 6.23 (d, J = 8.1 Hz, 2H), 2.96 (q, J = 7.1 Hz, 1H), 1.96 (d, J = 7.1 Hz, 2H), 1.48 (sep, 1H), 0.84 (d, J = 7.1 Hz, 3H), 0.62 (d, J = 6.6 Hz, 6H). δ 13C NMR (101 MHz, CD2Cl2) d 199.14 (C≡O), 198.95 (C≡O), 194.69 (C≡O), 179.02 (C=O), 153.79, 153.27, 151.38, 151.37, 151.27, 147.93, 147.88, 141.53, 141.52, 138.43, 136.14, 136.11, 130.17, 130.12, 130.05, 129.50, 128.82, 128.70, 128.30, 126.52, 126.00, 125.81, 125.68, 125.46, 47.10, 45.23, 30.37, 22.42, 19.10. Data for PIC6: FT-IR (cm−1, CH2Cl2) ν(C≡O) 2929 (s), 1917 (s), 1892 (s), ν (C=O) 1625 (m). 1H NMR (400 MHz, CD2Cl2) d 9.54 (d, J = 5.3 Hz, 2H), 8.27 (ddd, J = 4.8, 1.8, 1.0 Hz, 1H), 7.96 (s, 2H), 7.76 (d, J = 5.3 Hz, 2H), 7.55–7.49 (m, 10H), 7.40–7.32 (m, 2H), 6.99 (ddd, J = 7.2, 4.7, 1.6 Hz, 1H). 13C NMR (101 MHz, CD2Cl2) δ 198.79 (2C≡O), 194.40 (C≡O), 170.60 (C=O), 153.99, 153.81, 153.77, 151.71, 148.91, 148.15, 136.10, 130.18, 130.10, 129.50, 129.07, 126.33, 125.86, 124.53, 124.51. Data for 1NS6: FT-IR (cm−1, CH2Cl2, ν(C≡O)) 2029 (s), 1927 (s), 1904 (s). 1H NMR (400 MHz, CD2Cl2) δ 9.03 (d, J = 5.3 Hz, 2H), 7.87 (dd, J = 7.2, 1.3 Hz, 1H), 7.76 (s, 2H), 7.69–7.43 (m, 15H), 7.25 (dd, J = 8.2, 7.2 Hz, 1H), 7.11 (ddd, J = 8.1, 6.8, 1.2 Hz, 1H), 6.77 (ddd, J = 8.4, 6.8, 1.4 Hz, 1H). 13C NMR (101 MHz, CD2Cl2) δ 197.08 (2C≡O), 192.62(C≡O), 153.27, 151.82, 147.83, 139.48, 135.78, 133.87, 131.68, 130.31, 130.12, 129.52, 128.67, 128.32, 128.25, 126.71, 126.33, 126.18, 126.08, 125.99, 125.61, 124.70.
DNA-binding studies
UV–Vis titrations
The interactions of TOS7, TOS6, NIC7, 1NS7, 2NS6, PIC7, IB6, PIC6, and 1NS6 with CT-DNA (Calf Thymus DNA) have been studied via UV–Vis spectroscopy in order to investigate the possible binding modes to CT-DNA and to calculate the binding constants to CT-DNA (Kb). DMSO stock solution of each complex was diluted with Tris buffer saline at pH 7.2 (5 mM Tris–HCl, 50 mM NaCl), and absorption spectra were recorded in the range of 225–700 nm. Titrations were performed according to the method described earlier [20]. Except for a 75 μM solution of 1NS7, in all other cases, a 25 μM solution of each complex was titrated with varied amounts of DNA stock solution.
Initially, 3000 μL of the buffer in the reference cuvette and 3000 μL of the buffer in the sample cuvette were diluted with equal amounts of neat DMSO and a DMSO solution of the complex, respectively. During the titrations, a measured amount of DNA was added to each cuvette from the DNA stocksolutionof1693 μM to achieve a desired concentration of the DNA solution in each cuvette. The solutions were mixed thoroughly by repeated inversion and were allowed to incubate for 10 min before the absorption spectra were recorded. The change in concentration of the complexes due to each titration was negligible.
Cyclic voltammetry (CV) studies
The interactions of the complexes with CT-DNA have been also investigated by monitoring the changes observed in the cyclic voltammogram of the complexes upon addition of CT-DNA. All electrochemical studies were performed using a CH Instrument Electrochemical analyzer in a single compartmental cell with a three-electrode configuration comprising a Pt wire as the auxiliary electrode, a glassy carbon electrode as the working electrode, and Ag/AgCl as the reference electrode. A 1:1 mixture of acetonitrile and Tris buffer (pH 7.2) was used as the solvent, and 0.05 M tetrabutylammonium perchlorate as the supporting electrolyte.
Agarose gel electrophoresis
Given that these compounds are fluorescent, potential binding to DNA could be investigated through their ability to stain DNA in agarose gels. The compounds were incubated with lambda bacteriophage HindIII DNA ladder generated at room temperature for 1 h prior to the addition of 0.1× gel loading buffer (65% sucrose, 10 mM Tris–HCl, pH 7.5, 10 mM EDTA, 0.3% bromophenol blue). Electrophoresis was conducted in TAE buffer as follows. The gels were cast in TAE buffer, pH 8.0 (40 mmM Tris.HCl, pH 8.0, 20 mM acetic acid, and 1 mM EDTA). Electrophoresis was carried at 8 volts/cm constant voltage for 2 h. The gels were preimaged using a VersaDoc molecular imager (BioRad) and then stained with ethidium bromide (EB) and imaged.
Viscosity
The interaction of CT-DNA with the complexes has been also studied by measuring the change in viscosity upon addition of CT-DNA to the complexes. CT-DNA was quantitated using a NanoVue UV spectrophotometer at 260 nm. A stock solution of DNA in 5 mM KH2PO4 and 4 mM NaCl at pH 7.2 was sheared using a sonicating water bath (Branson) for pulses of—120 s on/30 s off—for a total of 60 min. For binding studies, a constant concentration of 200 lM of DNA was used. Binding to EB or compounds were tested using 4, 8, 12, 16, 20, 24, 48, 96, and 200 μM solutions after 30 min of incubation at room temperature. Viscosities of DNA/compound or DNA/EB were measured in the same manner using a 3156 viscometer (Q Glass Company Inc). Flow time was measured using a digital stop watch. The flow rate of buffer alone and the flow rate of buffer plus DNA solution were measured as control. Each measurement was done in triplicate, and the average flow rate was calculated. Relative viscosities for the CT-DNA in the presence and absence of the organorhenium complexes were calculated from the relation: η ∝ (t − to), where t is the observed flow time of DNA solutions and to is that of phosphate buffer alone. Data are presented as (η/η0)1/3 versus [complex]/[DNA], where η is the viscosity of DNA in the presence of the organorhenium complexes and ηo is the viscosity of DNA alone.
Cytotoxicity assay
The ER(?) MCF-7 breast cancer cell lines (ATCC) were maintained in MEM (Cellgro) supplemented with 0.01 ng/mL insulin (Sigma; human insulin), 10% fetal bovine serum (Gemini Bio-products), and 1% Pen/Strep (Gemini Bioproducts).TheER(−)MDA-MB-231breastcancercelllines (ATCC)were maintained in DMEM (Cellgro)supplemented with 10% fetal bovine serum (Gemini Bio-products) and 1% Pen/Strep (Gemini Bio-products). The ER(−) MCF-10A breast cell lines (ATCC) were maintained in DMEM/F12 (Gibco) supplemented with 5% horse serum (Invitrogen), 20 ng/mL EGF (Sigma), 500 ng/mL Hydrocortisone (Sigma), 100 ng/mL Cholera Toxin (Sigma), 10 mg/mL Insulin (Sigma; human insulin), and 1% Pen/Strep (Gemini Bio-products). On day 1, the cell lines were trypsinized, suspended in their respective media to 25,000 cells/mL, and 40lLwerealiquotedinto384-wellcleartissuecultureplates for 1000 cells per well. On day 2, 0.5 lL of compound serial diluted in DMSO was added using a Beckman Coulter Biomek FX equipped with a 96-pin V&P Scientific Pin Tool with an equivalent amount of DMSO being added for the “DMSO control.” The cells were incubated at 37 °C and 5% CO2 until day 5, or 72-h post drug addition, at which time 4 μL of Alamar Blue reagent (Thermo Scientific) was added to each well including top the “DMSO control” wells. The plates were incubated for an additional 2 hat37 °C, and then the fluorescence read withanexcitationof540 ± 10 nm and anemissionof590 ± 10 nm on a PHERAstar FS multimode microplate reader (BMG Labtech). The “percent fluorescence intensity of the DMSO control” was determined from the measured relative fluorescence units (RFUs) as follows: (CMPD RFU/DMSO Control RFU) × 100. The IC50 was determined by nonlinear curve fitting to the dose–response curve using Origin 6.1 (OriginLab Corp).
Results and discussion
Synthesis and characterizations
The sulfonato and carboxylato complexes were easily obtained from Mandal’s Synthesis which involves the conversion of the parent Re2(CO)10 in the presence of α-Diimine, 1-pentanol and CO2 to the corresponding pentylcarbonato complex, A (Eq. 1):
| (1) |
and subsequent reactions of A with sulfonic or carboxylic acids to afford the corresponding sulfonato or carboxylato complexes (see reference 11) (Eq. 2):
| (2) |
(Z represents p-toluenesulfonates, naphthalenesulfonates, picolinates, acetylsalicylates, etc.)
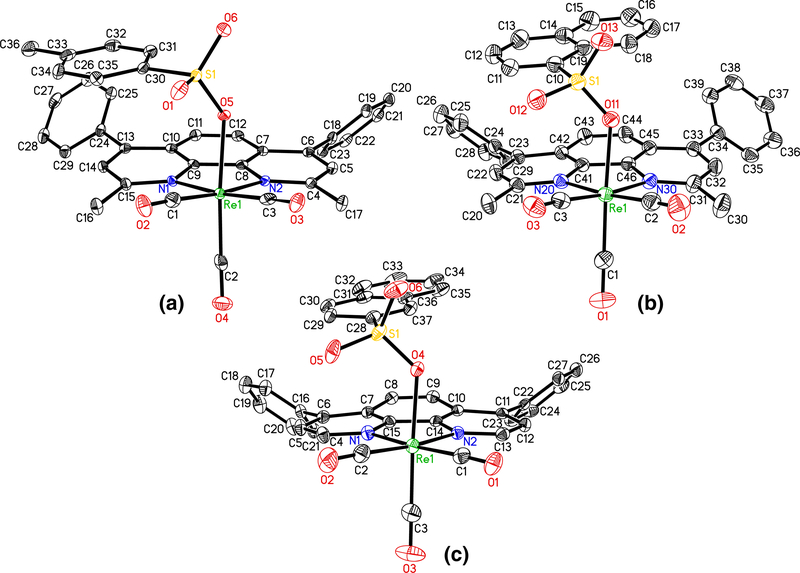
The complexes were characterized through FT-IR and FT-NMR spectroscopic techniques and in some cases through X-ray crystallography. The spectroscopic characterizations of a few lead compounds (TOS7, TOS6, NIC7, 1NS7, 2NS6, PIC7, IB6, PIC6, and 1NS6) are described here. All these compounds have facial (fac) geometry. Therefore, the IR spectrum of each exhibits three strong m(C:O)’s in the region of 2030–1890 cm−1 (Figs. S1–S9). As expected, each of NIC7, PIC7, IB6, and PIC6 shows a medium intensity ν(C≡O) at ~1630 cm−1. The 1H NMR spectrum of each complex shows the expected number of protons. 13C NMR data acquisition for each compound was done over a period of 48 h. It seems IB6 was not stable in CD2Cl2 during that long period of time. Except IB6, each complex exhibits the expected numbers of C≡O, C=O, aromatic, and aliphatic carbon peaks (Figs. S10–S27). The complexes TOS7, 1NS7, and 2NS-6 were also characterized crystallographically (Fig. 3).
Fig. 3.
X-ray structures of TOS7 (a), 1NS7 (b), and 2NS6 (c) showing planarity of the polypyridyl ligands
DNA-binding studies
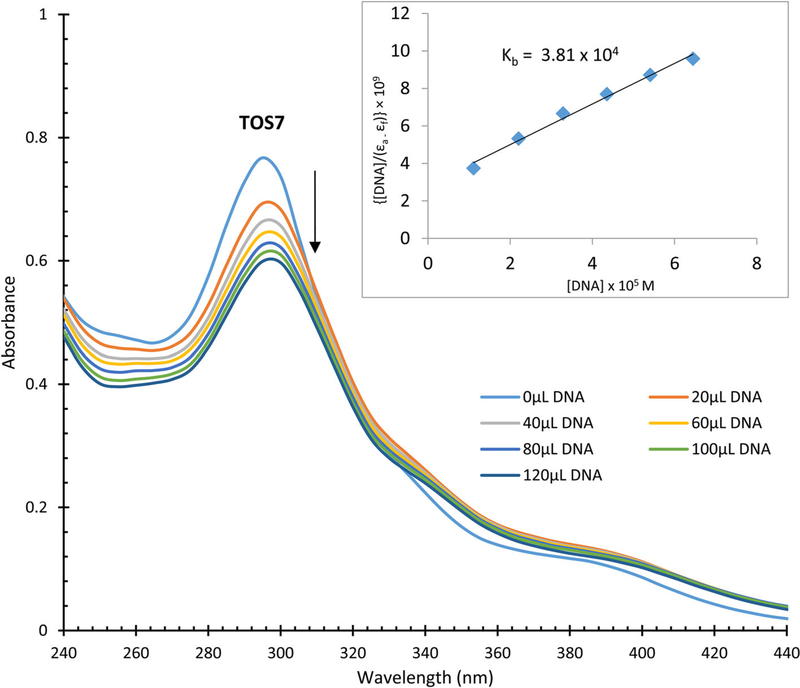
UV–Vis absorption titrations can be used to observe the interaction of transition metal complexes with DNA. When a metal complex binds to DNA by coordination, hyperchromicity is observed. When intercalation takes place between a complex and DNA base pairs, hypochromism and bathochromic shift are observed due to the stacking interaction of the π-orbital of the base pairs and π*-antibonding orbital of the aromatic chromophore. The titration graph for TOS7 is shown in Fig. 4, and the titration graphs for TOS6, NIC7, 1NS7, 2NS6, PIC7, IB6, PIC6, and 1NS6 are shown in Figs. S28–S35, respectively. Hypochromic effect is observed for each compound. Similar hypochromic effect was also reported for TOS5 [21]. The DNA-binding constants (Kb) were determined through the method, which was reported earlier [20]. The Kb values are in the range of 104–105 M−1, which are significantly lower than that of the classical DNA intercalator EB (Kb = 1.4 × 10⁶ M−1) [22]. Because of the relatively low Kb values, it is possible that the compounds follow moderate intercalation interactions with DNA. On the other hand, in the absence of red shifts in the titrations, DNA groove-binding mechanism is another possibility.
Fig. 4.
Absorption spectra for the titration of 25 μM of TOS7 in the absence and presence of varied amounts of DNA. Stock [DNA] = 1693 μM
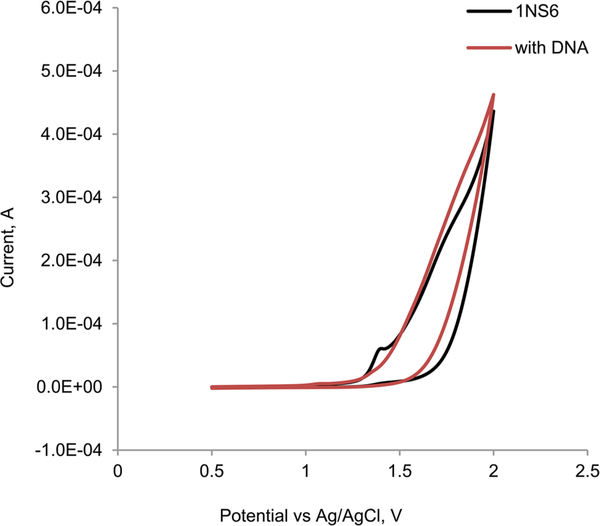
Electrochemical investigation on the interaction between a redox compound and a biomolecule provides a useful complement to UV–Visible and other related spectroscopic methods and gives information on the mechanism of formation of the compound–biomolecule adduct. A decrease in the peak current of the redox process suggests the formation of an adduct of the electroactive compound with the biomolecule. In addition, a negative shift of the cathodic potential suggests an external binding of the compound to DNA. Figure 5 depicts the cyclic voltammogram of 1NS6, and Figs. S36–S43 show the cyclic voltammograms of 2NS6, TOS7, 1NS7, TOS6, PIC7, PIC6, IB6, and NIC7, respectively, in the absence and presence of DNA. All complexes have an irreversible oxidation peak between 1.3 and 1.4 V, which is ascribed to the metal-centered one-electron oxidation [23]. Additions of 0.1 mM DNA to TOS7, 1NS7, TOS6, PIC7, PIC6, and IB6 show virtually no change to the oxidation peak, indicating that there is no or little interactions between the complexes and DNA. To 1NS6 and 2NS6, addition of DNA significantly reduces the peak intensity suggesting interactions between the complexes and DNA; it is worth noting that addition of DNA to 1NS6 causes cloudiness/precipitate suggesting strong interactions between the compound and DNA. It is interesting to note that addition of DNA to NIC-7 causes the oxidation peak to increase rather than decrease. The reason for such increase is not clear to us at this moment.
Fig. 5.
Cyclic voltammogram of 0.7 mM 1NS6 in the absence and presence of 0.1 mM DNA
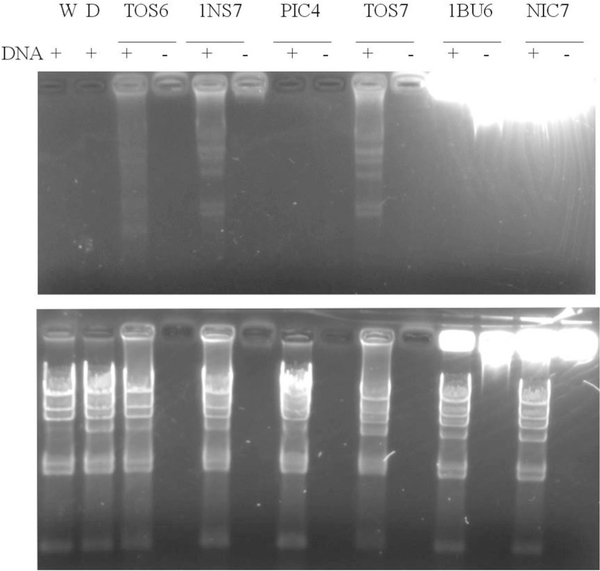
The results of gel electrophoresis DNA-binding assays are shown in Fig. 6. In the experiments, lambda HindIII DNA markers, which give a characteristic laddering pattern in agarose DNA electrophoresis gels, were mixed with the selected compounds or with DMSO, the vehicle for the compounds. DNA by itself is not fluorescent, but it can be visualized in gels through staining with fluorescent dyes. The results indicate that a subset of these compounds (TOS6, TOS7, and 1NS7) bind to DNA to produce the laddering pattern when imaged under a broad band UV lamp. These results suggest that in some cases, the cytotoxicity may be mediated through DNA binding although other mechanisms cannot be ruled out.
Fig. 6.
Gel electrophoresis DNA-binding assay. The compounds dissolved in DMSO/water in the presence or absence of lambda HindIII DNA markers and incubated at room temperature for 1 h. The samples electrophoresed and imaged under broad band UV light prior to (top panel) and after counterstaining with EB (bottom panel)
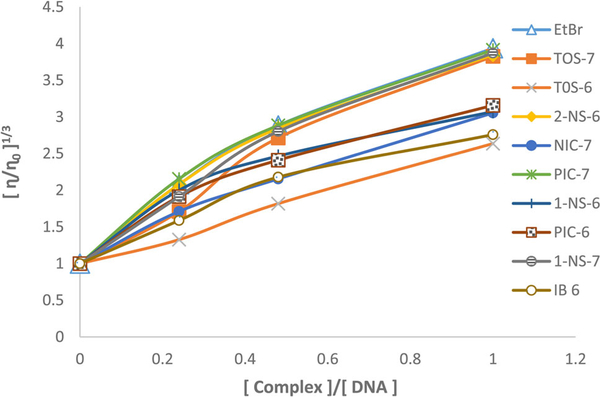
Photophysical and optical probes provide sufficient clues to confirm the binding mode. However, viscosity amounts to hydrodynamic measurements and is considered to be the least ambiguous and the most critical means of studying the DNA-binding mode of metal complexes. Thus, viscosity measurement provides a stronger argument for intercalative binding mode. The effects of the organorhenium complexes and EB on the viscosity of CT-DNA are shown in Fig. 7. As illustrated in this figure, upon increasing the concentrations of the organorhenium complexes, the relative viscosities of complexes increase steadily similar to the behavior of EB. The increase is attributed to the elongation of DNA polymer by effecting separation of DNA base pairs, which amounts to an increase in overall DNA length to accommodate the bound ligand. The increased degree of viscosity which depends on the binding affinity to DNA is according to the following order: EB ~PIC7 ~ 2NS6 ~ 1NS7 ~ TOS7> 1NS6 ~ PIC6> NIC7> IB6> TOS6. These results suggest that the complexes intercalate between the base pairs of DNA. However, a ligand that binds in the DNA grooves causes less-pronounced changes or no change in viscosity of a DNA solution.
Fig. 7.
Relative viscosity (η/ηo)1/3 of CT-DNA (0.2 mM) in buffer solution (5 mM KH2PO4 and 4 mM NaCl at pH 7.2) in the presence of increasing amount of complexes and EB (r = [complex]/[DNA])
It may be suggested from the UV titrations that the complexes either bind to DNA intercalatively or follow DNA groove binding [24]. The CV studies and gel electrophoresis experiments lead us to believe that a few complexes bind to DNA.
Also we have observed that the relative viscosity of DNA increases with the increasing concentration of the organorhenium complexes, and the increase is comparable to the classical intercalator EB. We conclude that the organorhenium complexes intercalate to DNA. Because the DNA-binding constant (Kb) values are much lower than that of EB, other modes of binding are also operative. We have solved the crystal structures of numerous tosylato, naphthalenesulfonato, picolinato, nicotinato, acetylsalicylato, flufenamato, mefenamato, and naproxenato complexes. The phenanthroline ligand in each complex is planar as evidenced from the X-ray structures of TOS2, ASP2, and NIC4 (Fig. S44 ) and optimized structures of NIC7, PIC7, PIC6, and TOS6 (Fig. S45) obtained from DFT calculations. In addition, the X-ray structures of the highly potent compounds such as TOS7, 1NS7, and 2NS6 (Fig. 3) also confirm the planarity of the polypyridyl rings. These facts reinforce the DNA intercalative binding of the rhenium complexes. It is worthwhile to mention here that many rhenium complexes like those observed in our cases bearing planar polypyridyl rings exhibit no intercalation interaction with DNA [25–27].
Cytotoxicity assay
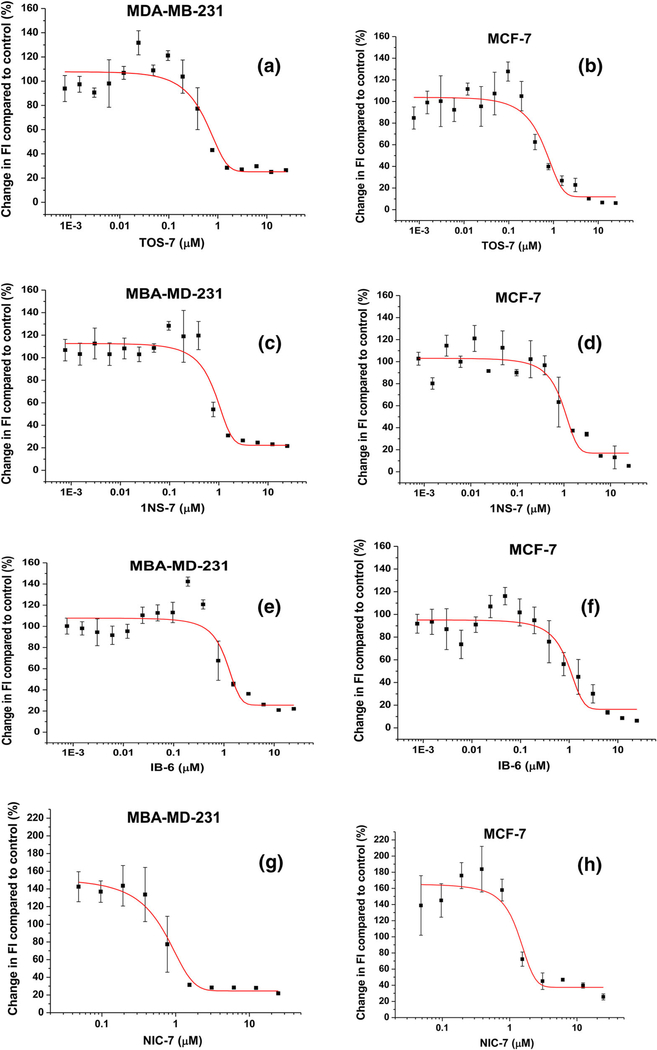
We have studied the cytotoxicity of 12 series of new organorhenium compounds. Each series contains at least 5–6 different compounds. Cell viability assays were carried out through Alamar Blue assay. The fluorescence graphs for each compound on MCF-7A, MCF-10A, and MDAMB-231 are compiled in Table S1. For a few lead compounds, some of the graphs are shown in Fig. 8. As seen from the graphs above, a few of these compounds are highly cytotoxic against breast cancer cells (IC50 < 0.500 μM). For convenience, the IC50 values of very active compounds on MCF-7, MCF-10A, and MDAMB-231 are compiled in Table 1. Data for all compounds can be found in Tables S2 and S3. Table 1 reveals that except for the IB series, the organorhenium complexes of NSAIDs are not very active on breast cancer cells. We have observed that the DNA-binding data are completely unrelated to the cytotoxicity results. We did not find any correlation between the DNA-binding constants (Kb), viscosity graphs, or other experiments (in vitro studies) with the IC50 values (in cell—cytotoxicity data).
Fig. 8.
Changes in fluorescence intensity after 72-h treatment of MCF-7 and MDA-MB-231 breast cancer cells with various concentrations of four compounds—graphs for TOS7: a, b, 1NS7: c, d, IB6: e, f, NIC7: g, h
Table 1.
The IC50 values (in μM) of potent organorhenium complexes on breast cancer cells
| Compound IC50 |
MCF-7A error (±) |
MCF-10A IC50 |
Error (±) | Compound IC50 |
MDA-MB-231 error (±) |
||
|---|---|---|---|---|---|---|---|
| TOS7 | 0.337 | 0.303 | 1.78 | 0.173 | TOS7 | 0.248 | 0.336 |
| PIC4 | 0.425 | 0.226 | 0.023 | 0.002 | NIC7 | 0.591 | 0.145 |
| 1NS7 | 0.849 | 0.255 | 2.51 | 0.187 | 1NS7 | 0.716 | 0.242 |
| IB6 | 0.958 | 0.261 | 1.47 | 0.177 | PIC7 | 1.03 | 0.181 |
| 1B4 | 1.25 | 0.607 | 12.1 | 0.554 | IB6 | 1.06 | 0.375 |
| TOS6 | 1.27 | 0.228 | 3.46 | 0.186 | 2NS6 | 1.08 | 0.198 |
| 2NS6 | 1.31 | 0.297 | 2.79 | 0.250 | PIC6 | 1.23 | 0.197 |
| NIC7 | 1.33 | 0.29 | 6.38 | 0.316 | TOS6 | 1.27 | 0.361 |
| PIC6 | 1.51 | 0.243 | 3.02 | 0.133 | 1NS6 | 1.53 | 0.143 |
| 1NS4 | 1.54 | 0.179 | 1.59 | 0.351 | FN4 | 1.7 | 0.314 |
| TOS4 | 1.55 | 0.285 | 5.7 | 0.337 | TP7 | 1.74 | 0.140 |
| FN4 | 1.56 | 0.420 | 2.65 | 0.253 | 2NS4 | 1.86 | 0.318 |
| 2NS4 | 1.58 | 0.263 | 1.66 | 0.229 | TP6 | 1.99 | 0.341 |
| PIC7 | 1.65 | 0.171 | 6.31 | 0.240 | ASP7 | 2.41 | 0.328 |
| 1NS6 | 1.7 | 0.226 | 3.63 | 0.403 | TP4 | 2.59 | 0.472 |
| FNS | 1.89 | 0.313 | 11.1 | 1.88 | 1NS4 | 2.78 | 0.373 |
| 2NS5 | 2.11 | 0.267 | 6.32 | 0.157 | NIC4 | 2.97 | 0.172 |
| IB5 | 2.55 | 0.673 | 3.37 | 0.406 | ASP4 | 3.01 | 0.252 |
| MF4 | 2.61 | 0.496 | NA | TOS4 | 3.09 | 0.284 | |
| 1B2 | 2.69 | 0.334 | 12.1 | 0.298 | FN6 | 3.27 | 0.212 |
| FN6 | 2.75 | 0.315 | 3.68 | 0.299 | TOSS | 3.55 | 0.537 |
| FN5 | 2.8 | 0.267 | 6.09 | 0.397 | NIC8 | 3.58 | 0.331 |
| 2N58 | 2.83 | 0.516 | 1.51 | 0.201 | NIC3 | 3.64 | 0.625 |
| NIC4 | 2.93 | 0.363 | 5.83 | 0.264 | NIC6 | 4.24 | 0.212 |
| MF2 | 2.95 | 0.314 | 12.1 | 0.287 | 2N58 | 5.4 | 1.02 |
| NIC8 | 2.98 | 0.535 | 5.62 | 0.248 | ASPS | 5.76 | 0.271 |
| TP7 | 2.98 | 0.292 | 3.04 | 0.431 | ASP9 | 6.02 | 0.289 |
| 1N52 | 3.09 | 0.528 | 11.6 | 0.872 | 2N55 | 6.04 | 0.204 |
| ASP9 | 3.11 | 0.403 | 6.48 | 0.318 | TF6 | 6.08 | 0.357 |
| TP8 | 3.11 | 0.376 | 12.3 | 0.368 | 1NS3 | 6.11 | 0.601 |
| TOSS | 3.12 | 0.399 | 6.08 | 0.143 | IB4 | 6.17 | 0.767 |
| IB3 | 3.16 | 0.406 | 12.1 | 0.263 | PIC8 | 6.18 | 0.164 |
| TOS2 | 3.24 | 0.557 | 6.75 | 0.444 | FN3 | 6.33 | 0.494 |
| NIC8 | 3.25 | 0.482 | 6.08 | 0.160 | 2N57 | 6.34 | 0.486 |
| MF1 | 3.27 | 0.473 | 12.9 | 0.514 | TP5 | 6.39 | 0.505 |
| 1NS3 | 3.29 | 0.517 | 6.08 | 0.357 | PIC4 | 6.39 | 0.362 |
| NIC1 | 3.37 | 0.992 | >24 | ASPS | 6.41 | 0.261 | |
| PIC8 | 3.39 | 0.353 | 6.36 | 0.135 | TF8 | 6.44 | 0.388 |
| PIC2 | 3.51 | 0.410 | 11.7 | 0.347 | IBS | 6.47 | 0.736 |
| ASP2 | 3.54 | 0.487 | 12.2 | 0.237 | NP6 | 6.48 | 0.577 |
| NIC6 | 3.57 | 0.988 | 7.16 | 1.29 | NIC8 | 6.48 | 0.187 |
| TOS8 | 3.61 | 0.418 | 6.27 | 0.186 | NP7 | 6.52 | 0.384 |
| TF8 | 3.7 | 0.383 | 12.1 | 0.453 | PIC8 | 6.53 | 0.467 |
| MF3 | 4.17 | 1.45 | 12 | 0.374 | TOS8 | 6.54 | 0.269 |
NA: not active
Conclusion and perspective
In this study, we have observed that the organorhenium complexes interact with DNA intercalatively at least partially. Several compounds are highly cytotoxic against MCF-7A and MDA-MB-231 breast cancer cells. The IC50 values in the nM range and low activity on normal cells make these compounds highly attractive for possible applications as anticancer drugs.
At the World Cancer Congress in Paris on November 1, 2016, the reports from the American Cancer Society and Lancet medical journal warned of an explosion in cancer deaths among women, mainly from breast cancer, with a toll of around 5.5 million a year by 2030 [28, 29]. Therefore, it is an urgent necessity to discover breast cancer drugs that exhibit no side effects and are drug resistance free. The organorhenium compounds, TOS7, PIC4, NIC7, 1NS7, and IB6, easily obtained from Mandal’s Synthesis are highly active on MCF-7 and MDA-MB-231 breast cancer cells (IC50 in the range of 0.250–1.00 μM). The IC50 values of TOS-7 and NIC-7 on MDA-MB-231 are 0.248 ± 0.336 and 0.591 ± 0.145 μM, respectively. It is worthwhile to mention here that there is no cure at present for patients suffering from this breast cancer. Besides Jaouen’s ferrocifens [16–18], Lippard lab at MIT has synthesized a Re(V) complex bearing a bathophenanthroline ligand that is ligand 6 in this study. This compound exhibits an IC50 value of 0.475 ± 0.161 [27]. In the present study, we have explored the structure–activity relationship (SAR) studies for 12 new series of compounds. It is very clear that the rhenium compounds bearing bathophenanthroline (ligand 6) and bathocuproin (ligand 7) are remarkably active on breast cancer cells possibly due to the increased lipophilic character of the organorhenium compounds. It is very likely that the lipophilicities of the polypyridyl ligands (N⁀N) in Fig. 2 roughly follow the trend: 7 > 6 > 4 ~ 5 ~ 8 > 3 > 2. It is, therefore, expected that the lipophilicities of the organorhenium compounds follow similar trend. In fact, Table 1 indicates that the IC50 values for several series of compounds decrease with the increasing lipophilicities. For example, the IC50 values of the TOS series of compounds on MDAMB-231 breast cancer cells follow the trend: TOS7 < TOS6 < TOS4 ~ TOS5 < TOS3 < TOS2 < TOS1. Likewise, the IC50 values of the 1NS series of compounds on MDA-MB-231 follow the trends: 1NS7 < 1NS6 < 1NS4 < 1NS2 < 1NS1. Similarly, the IC50 values of the TP and NIC series of compounds on MCF-7 follow the trends: TP7 < TP6 < TP4 < TP3 < TP2 and NIC7 < NIC4 ~ NIC5 < NIC3 < NIC2 < NIC1. To the best of our knowledge, examples of such an exhaustive study with organometallic or coordination complexes against MCF-7 and MDA-MB-231 breast cancer cells are scarce.
Supplementary Material
Acknowledgements
This research was partially supported by the NCI disability supplement, and the NIH Grant No. T34 GM100831 to HNB and the NIH Grant No. G11HD038439; and Nuclear Regulatory Commission Grant No. NRC-HQ-12-G-27–0086 to SKM. The work was also supported, in part, with funds from the Center for Biomolecular Therapeutics (CBT) at the University of Maryland, School of Medicine (from DJW).
Footnotes
Compliance with ethical standards
Conflict of interest The authors have no conflicts of interest to declare in this research.
Electronic supplementary material The online version of this article (doi:10.1007/s11010-017-3181-z) contains supplementary material, which is available to authorized users.
References
- 1.Wrighton M, Morse DL (1974) The nature of the lowest excited state in tricarbonyl-chloro-1,10-phenanthrolinerhenium(I) and related complexes. J Am Chem Soc 96(4):998–1003 [Google Scholar]
- 2.Sacksteder L, Lee M, Demas JN, DeGraff BA (1993) Long-lived, highly luminescent rhenium(I) complexes as molecular probes: intra and intermolecular excited-state interactions. J A Chem Soc. 115:8230–8238 [Google Scholar]
- 3.Yam VWW, Lau VCY, Cheung KK (1995) Synthesis, photophysics and photo-chemistry of novel luminescent rhenium (I) photoswitchable materials. J Chem Soc Chem Commun 2:259–261 [Google Scholar]
- 4.Ehler TT, Malmberg N, Carron K, Sullivan BP, Noe LJ (1997) Studies of organometallic self-assembled monolayers on Ag and Au using surface Plasmon spectroscopy. J Phys Chem B. 101:3174–3180 [Google Scholar]
- 5.Kotch TG, Lees AJ, Fuerniss SJ, Papathomas K, Snyder IRW (1993) Luminescence rigidochromism of fac-tricar-bonylchloro(4,7-diphenyl-1,10-phenanthroline)rhenium as a spectroscopic robe in monitoring polymerization of photosensitive thin films. Inorg Chem 32:2570–2575 [Google Scholar]
- 6.Stoeffler HD, Thornton NB, Temkin SL, Schanze KS (1995) Unusual photophysics of a rhenium(I) dipyridophenazine complex in homogeneous solution and bound to DNA. J Am Chem Soc 117:7119–7128 [Google Scholar]
- 7.Oriskovich TA, White PS, Thorp HH (1995) Luminescent labels for purine nucleobases: electronic properties of guanine bound to rhenium(I). Inorg Chem 34:1629–1631 [Google Scholar]
- 8.Yan YK, Cho SE, Shaffer KA, Rowell JE, Barnes BJ, Hall IH (2000) Cytotoxicity of rhenium(I) alkoxo and hydroxo carbonyl complexes in murine and human tumor cells. Pharmazie 55:307–313 [PubMed] [Google Scholar]
- 9.Leonidova A, Gasser G (2014) Underestimated potential of organometallic rhenium complexes as anticancer agents. ACS Chem Biol 9:2180–2193 [DOI] [PubMed] [Google Scholar]
- 10.Mbagu MK, Kebulu DN, Winstead A, Pramanik SK, Banerjee HN, Iwunze MO, Wachira JM, Greco GE, Haynes GK, Sehmer A, Sarkar FH, Ho DM, Pike RD, Mandal SK (2012) Fac-Tricarbonyl(pentylcarbonato)(a-diimine)rhenium complexes: one-pot synthesis, characterization, fluorescence studies, and cytotoxic activity against human MDA-MB-231 breast, CCl-227 colon and BxPC-3 pancreatic carcinoma cell lines. Inorg Chem Commun 21:35–38 [Google Scholar]
- 11.The synthetic procedure has been presented at the American Chemical Society National Meetings and can be accessed through the Technical Programming Archive: Past National Meetings (2004-present) and the link is: http://www.acs.org/content/acs/en/meetings/nationalmeetings/programarchive.html?_ga=1.29689146.464482569.1442729062
- 12.Parson C, Smith V, Krauss C, Banerjee HN, Reilly C, Krause JA, Wachira JM, Giri D, Winstead A, Mandal SK (2013) The effect of novel rhenium compounds on lymphosarcoma, PC-3 prostate and myeloid leukemia cancer cell lines and an Investigation on the DNA binding properties of one of these compounds through electronic spectroscopy. J Bioproces Biotechniq. 4:1–5 [DOI] [PMC free article] [PubMed] [Google Scholar]
- 13.Wang W, Yan YK, Andy Hor TS, Vittal JJ, Wheaton JR, Hall IH (2002) Synthesis, X-ray structures, and cytotoxicity of rhenium(I) carbonyl 2-(dimethylamino)-ethoxide complexes. Polyhedron 21:1991–1999 [Google Scholar]
- 14.Kumar CA, Carthikeyan S, Varghese B, Veena V, Sakthivel N, Manimaran B (2014) Synthesis, characterization and cytotoxicity evaluation of rhenium(I) based ester functionalized dinuclear metallacyclophanes. J Organomet Chem 766:86–94 [Google Scholar]
- 15.Ye R-R, Tan C-P, Chen MH, Hao L, Ji LN, Mao Z-W (2016) Mono- and dinuclear phosphorescent rhenium(I) complexes: impact of subcellular localization on anticancer mechanisms. Chem Eur J 22:7800–7809 [DOI] [PubMed] [Google Scholar]
- 16.Dallagi T, Saidi M, Vessieres A, Huche M, Jaouen G, Top S (2013) Synthesis and antiproliferative evaluation of ferrocenyl and cymantrenyl triaryl butene on breast cancer cells. biodistribution study of the corresponding technetium-99 m tamoxifen conjugate. J Organomet Chem 734:69–77 [Google Scholar]
- 17.Cazares-Marinero JJ, Top S, Vessieres A, Jaouen G (2013) Synthesis and antiproliferative activity of hydroxyferrocifen hybrids against triple-negative breast cancer cells. Dalton Trans 43:817–830 [DOI] [PubMed] [Google Scholar]
- 18.Cázares-Marinero JJ, Buriez O, Labbe E, Top S, Amatore C, Jaouen G (2013) Synthesis, characterization, and antiproliferative activities of novel ferrocenophanic suberamides against human triple-negative MDA-MB-231 and hormone-dependent MCF-7 breast cancer cells. Organometallics 32:5926–5934 [Google Scholar]
- 19.Medley J, Payne G, Banerjee HN, Giri D, Winstead A, Wachira JM, Krause JA, Shaw R, Pramanik SK, Mandal SK (2015) DNA-binding and cytotoxic efficacy studies of organorhenium pentylcarbonate compound. Mol Cell Biochem 398:21–30 [DOI] [PubMed] [Google Scholar]
- 20.Banerjee HN, Boston A, Barfield A, Stevenson M, Sarkar FH, Giri D, Winstead A, Krause JA, Mandal SK (2016) A study of the effects of novel rhenium compounds on pancreatic and prostate cancer cell lines. Int J Sci Res. 5(7):481–483 [PMC free article] [PubMed] [Google Scholar]
- 21.Dimitrakopoulou A, Dendrinou-Samara C, Pantazaki AA, Alexiou M, Nordlander E, Kessissoglou DP (2008) Synthesis, structure and interactions with DNA of novel tetranuclear, [Mn4(II/II/II/IV)] mixed valence complexes. J Inorg Biochem 102(4):618–628 [DOI] [PubMed] [Google Scholar]
- 22.Waring MJ (1965) Complex formation between ethidium bromide and nucleic acids. J Mol Biol 13:269–282 [DOI] [PubMed] [Google Scholar]
- 23.Bullock JP, Carter E, Johnson R, Kennedy AT, Key SE, Kraft BJ, Saxon D, Underwood P (2008) Reactivity of electrochemically generated rhenium (II) tricarbonyl a-diimine complexes: a reinvestigation of the oxidation of luminescent Re(CO)3(α-diimine)Cl and related compounds. Inorg Chem 47(17):7880–7887 [DOI] [PubMed] [Google Scholar]
- 24.Kaplanis M, Stamatakis G, Papakonstantinou VD, ParavatouPetsotas M, Demopoulos CA, Mitsopoulou CA (2014) Re(I) tricarbonyl complex of 1,10-phenanthroline-5,6-dione: DNA binding, cytotoxicity, anti-inflammatory and anti-coagulant effects towards platelet activating factor. J Inorg Biochem 135:1–9 [DOI] [PubMed] [Google Scholar]
- 25.Ma D-L, Che C-M, Siu F-M, Yang M, Wong K-Y (2007) DNA binding and cytotoxicity of ruthenium(II) and rhenium(I) complexes of 2-amino-4-phenylamino-6-(2-pyridyl)-1,3,5-triazine. Inorg Chem 46:740–749 [DOI] [PubMed] [Google Scholar]
- 26.Mitsopoulou CA, Dagas C (2010) Synthesis, characterization, DNA binding, and photocleavage activity of oxorhenium (V) complexes with a-diimine and quinoxaline ligands. Bioinorg Chem Appl. doi: 10.1155/2010/973742 [DOI] [PMC free article] [PubMed] [Google Scholar]
- 27.Suntharalingam K, Awuah SG, Bruno PM, Johnstone TC, Wang F, Lin W, Zheng Y-R, Page JE, Hemann MT, Lippard SJ (2015) Necroptosis-inducing rhenium(V) oxo complexes. J Am Chem Soc 137:2967–2974 [DOI] [PMC free article] [PubMed] [Google Scholar]
- 28.Ginsburg O, Bray F, Coleman MP, Vanderpuye V, Eniu A, Kotha SR, Sarker M, Huong TT, Allemani C, Dvaladze A, Gralow J, Yeates K, Taylor C, Oomman N, Krishnan S, Sullivan R, Kombe D, Blas MM, Parham G, Kassami N, Conteh L. The global burden of women’s cancers: a grand challenge in global health (www.thelancet.com Published online November 1, 2016). 10.1016/S0140-6736(16)31392-7. [DOI] [PMC free article] [PubMed] [Google Scholar]
- 29.Cancer deaths among women to rise 60% by 2030, new reports warn. The Guardian, November 1, 2016
Associated Data
This section collects any data citations, data availability statements, or supplementary materials included in this article.


