

Abstract
CCD photometric observations of three Hilda asteroids were made at the Center for Solar System Studies (CS3) in 2019 September. Analysis of the 2019 data for 4495 Dassanowsky, a reported binary (Warner and Stephens, 2019), found three periods, one being very long (431 h). The long period and a secondary one made it a potential member of the very wide binary asteroids but, for the first time for a member of this class, a third period seems to be present. A review of the 2018 data set using comparison star magnitudes from the ATLAS catalog (Tonry et al., 2018) found the previously unnoticed very long period. The secondary and tertiary periods were still in good agreement with the original two-period solution found in 2018. Though the odds are remote and considerable more data are required, the new results from the 2018 data are encouraging in the on-going effort to find evidence that validates claims of the existence of the very wide binary asteroid class.
CCD photometric observations of three Hilda asteroids were made at the Center for Solar System Studies (CS3) in 2019 September. This is another installment of an on-going series of papers on this group of asteroids, which is located between the outer main-belt and Jupiter Trojans in a 3:2 orbital resonance with Jupiter. The goal is to determine the spin rate statistics of the group and find pole and shape models when possible. We also look to examine the degree of influence that the YORP (Yarkovsky–O’Keefe–Radzievskii–Paddack) effect (Rubincam, 2000) has on distant objects and to compare the spin rate distribution against the Jupiter Trojans, which can provide evidence that the Hildas are more “comet-like” than main-belt asteroids.
Table I lists the telescopes and CCD cameras that are combined to make observations. Up to nine telescopes can be used for the campaign, although seven is more common. All the cameras use CCD chips from the KAF blue-enhanced family and so have essentially the same response. The pixel scales ranged from 1.24–1.60 arcsec/pixel. All lightcurve observations were unfiltered since a clear filter can result in a 0.1–0.3 magnitude loss. The exposures varied depending on the asteroid’s brightness and sky motion.
Table I.
List of available telescopes and CCD cameras at CS3. The exact combination for each telescope/camera pair can vary due to maintenance or specific needs.
| Telescopes | Cameras |
|---|---|
| 0.30-m f/6.3 Schmidt-Cass | FLI Microline 1001E |
| 0.35-m f/9.1 Schmidt-Cass | FLI Proline 1001E |
| 0.35-m f/11 Schmidt-Cass | SBIG STL-1001E |
| 0.40-m f/10 Schmidt-Cass | |
| 0.50-m f/8.1 Ritchey-Chrétien |
Measurements were made using MPO Canopus. The Comp Star Selector utility in MPO Canopus found up to five comparison stars of near solar-color for differential photometry. Comp star magnitudes were taken from ATLAS catalog (Tonry et al., 2018), which has Sloan griz magnitudes that were derived from the GAIA and Pan-STARR catalogs, among others. The authors state that systematic errors are generally no larger than 0.005 mag, although they can reach 0.02 mag in small areas near the Galactic plane. BVRI magnitudes were derived by Warner using formulae from Kostov and Bonev (2017). The overall errors for the BVRI magnitudes, when combining those in the ATLAS catalog and the conversion formulae, are on the order of 0.04–0.05.
Even so, we found in most cases that nightly zero point adjustments on the order of only 0.02–0.03 mag were required during period analysis. There were occasional exceptions that required up to 0.10 mag. These may have been related in part to using unfiltered observations, poor centroiding of the reference stars, and not correcting for second-order extinction terms. Regardless, the systematic errors seem to be considerably less than other catalogs, which reduces the uncertainty in the results when analysis involves data from extended periods or the asteroid is tumbling.
Period analysis was done with MPO Canopus, which implements the FALC algorithm by Harris (Harris et al., 1989). The same algorithm is used in an iterative fashion when it appears there is more than one period. This works well for binary but not for tumbling asteroids.
In the plots below, the Y-axis gives the Johnson V sky (catalog) magnitude of the asteroid. For plots of additional periods, the zero point is the average magnitude of the primary lightcurve. The magnitudes were normalized to the phase angle in parentheses using G = 0.15. The X-axis is the rotational phase ranging from −0.05 to 1.05. If the plot includes an amplitude, it is for the peak-to-peak Fourier model curve and not necessarily the adopted amplitude for the lightcurve.
Our initial search for previous results started with the asteroid lightcurve database (LCDB; Warner et al., 2009), which is on-line at http://www.minorplanet.info/lightcurvedatabase.html. Readers are strongly encouraged to obtain, when possible, the original references listed in the LCDB.
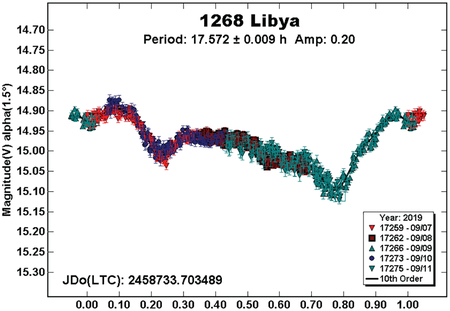
1268 Libya.
The only previously reported period for this 94 km Hilda was from Dahlgren et al. (1998), who found a period of 14.05 h.

The period spectrum based on our data from 2019 shows a very shallow local minimum at about 14.5 h. Considerably stronger solutions are near 10 h, 17.5 h, and 20.2 h with the one near 17.5 h being the most favored.
The lightcurve has an unusual shape. However with the amplitude about 0.20 mag and the very low phase angle, it’s not unreasonable (Harris et al., 2014). Not even significant nightly zero point shifts allowed finding a plausible alternate solution.
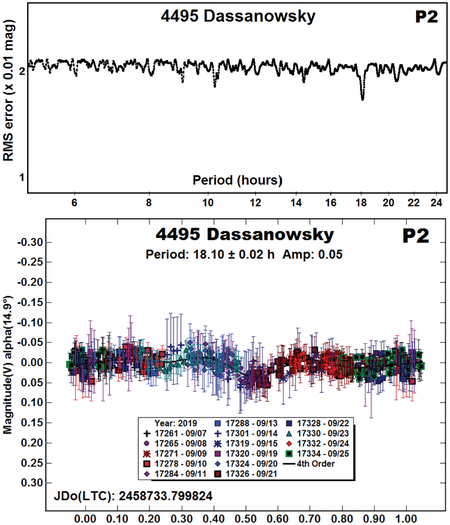
4495 Dassanowsky.
The estimated diameter of this Hilda is 24 km (Mainzer et al., 2016). We first observed it in 2018 Sept-Oct and found it to be a binary candidate (Warner and Stephens, 2019) with a primary period of P1 = 2.6314 h and PORB = 18.516 h. The primary period solution was not unique. The double period at 5.263 h was also possible. Revised lightcurves of these solutions are given below.
Analysis of the 2019 Data
Not long after our observations in 2018, the ATLAS catalog (Tonry et al., 2018) became available. As noted previously, this reduced nightly zero shift points considerably; this raised confidence significantly in solutions where a very long period was involved.
A raw plot of the 2019 data clearly showed a long period component with a period on the order of 400 h. The lower RMS solution in the period spectrum near 200 h is for a monomodal lightcurve. Given the amplitude and phase angle, this was unlikely (Harris et al., 2014).


After almost three weeks of observations, the data set was sufficient to find a 4th order Fourier fit for the long period; earlier attempts were limited to a 2nd order fit to the half-period.
Once the long period was subtracted, a weak secondary period of 18.1 h was found. This was close to the previous solution at 18.5 h. Although less prominent that in 2018, the P2 lightcurve had a similar shape to the one in 2018 that appeared to show distinct mutual events (occultations/eclipses) that would be due to a satellite of the “primary” body (secondary body in the newly proposed model).
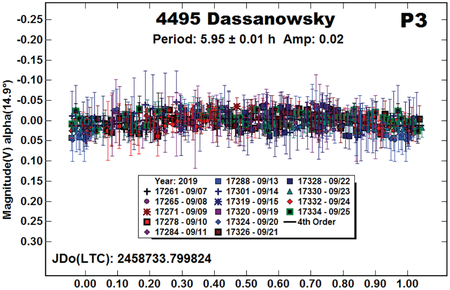
The back-and-forth iterative process of subtracting the two periods from the data found a third, also weak tertiary period of P3 = 5.95 h. Here again, it was somewhat similar to the short, bimodal solution found in 2018. A possible reason for the discrepancies is discussed below.
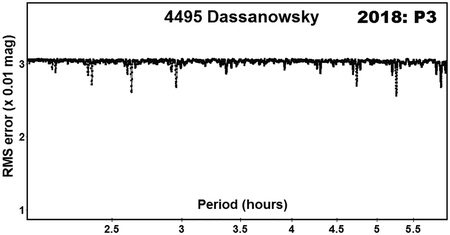
Another Look at the 2018 Data
With a long period clearly seen in the 2019 data, we went back to the 2018 data set, removed all zero-point adjustments, and used values from the ATLAS catalog for the comparison stars instead of the APASS catalog values (Henden et al., 2009).
The initial raw plot of the data using the new comp star magnitudes immediately showed a long-period component. Apparently, the nightly zero point adjustments used in 2018 slowly but surely removed the long-period component, which is a cautionary tale of “trusting the data” until there’s a reason not to.
The 2018 data set was nearly double the density of that in 2019 but the overall quality was less in terms of SNR. This was a case where “overwhelming the noise with data” worked. Sometimes, however, adding more noisy data just makes matters worse.

The coverage of P1 in 2018 was not as good as in 2019, but it was still sufficient to use a 4th order Fourier fit to find a solution. Subtracting the long period eventually lead to a purported PORB (P2 lightcurve) of 18.523 h, or about 0.007 h longer than we initially reported. Once again, there appear to be mutual events in the lightcurve with depths 0.06–0.08 mag. Assuming the validity of a trinary system, this leads to an estimated effective diameter ratio Ds/Dp ≥ 0.24 ± 0.03 between the primary satellite and a third body orbiting around the primary satellite, not the main body producing the long period lightcurve. Such evidence has not been seen before among candidates of the very wide binary asteroids class.

We then moved to subtracting P1 and P2 to see if the short period originally reported in Warner and Stephens (2019) could be found. The period spectrum for P3 shows several good candidates, some being integral multiples of shorter periods. For our analysis, we assumed that the tertiary lightcurve would be monomodal or bimodal. The results are shown in the two P3 lightcurves.
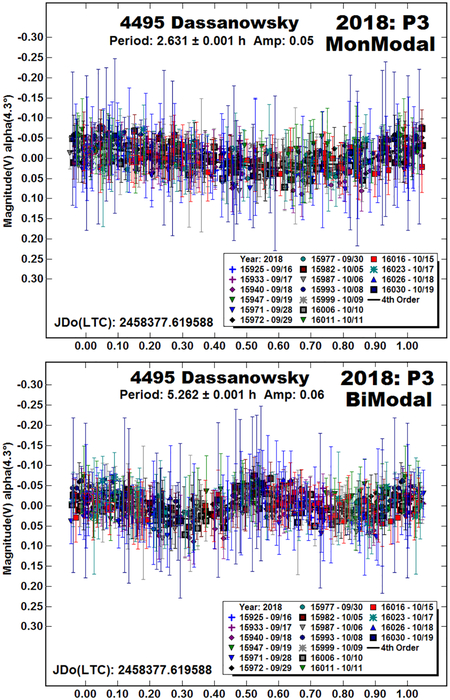
The two P3 periods are essentially identical to those we reported in our initial analysis of the 2018 data (Warner and Stephens, 2019). We note that either one fits well within previous two-period solutions for the secondary body in the very wide binary asteroids class. For this paper, we are adopting the shorter P3 = 2.631 h but, as before, cannot formally exclude the double period.
More Data!
As noted above, the discrepancies in the periods using the 2018 and 2019 data sets are significant but the results are still “similar.” Two contributing factors come to mind: 1) the much higher density of the 2018 data set and, 2) a difference in the viewing aspect between the two apparitions. In 2018 LPAB was ~340° while in 2019 LPAB was ~40°, or about 60° separation. It’s plausible that this is a sufficient difference to account for the differences amplitudes.
The larger amplitude in 2019 might imply a more equatorial view for the primary body. On the other hand, the amplitudes for the secondary and tertiary periods were considerably smaller.
We have not worked out the required densities and other values to say if a trinary system with the reported periods is even physically probable. Assuming so, the new results from the 2018 data set are encouraging in the attempt to establish the existence of members of the very wide binary asteroid class.
There are favorable apparitions (V < 17.5) in almost every year from 2020 to 2050. We encourage observing campaigns involving observers at well-spread longitudes and being able to calibrate all data to a common system (even an internal one) to 0.02 mag or better.
The ultimate victory would be to observe mutual events between the long-period primary and the suggested binary satellite. Unfortunately, the general model for the very wide binary asteroids has a very long orbital period for the (main) satellite and so the chances of seeing those events are extremely remote. This puts further emphasis on having a campaign of several observers each of who produces a dense data set each night. Short, sporadic runs will not find the shorter periods in this system.
(15373) 1996 WV1.
This appears to be the first reported rotation period for 1996 WV1, which has an approximate diameter of 13 km (Mainzer et al., 2016). The almost exactly Earth-day commensurate period was overcome by being able to observe the asteroid just a little more or less than the adopted period and doing so on four consecutive nights.
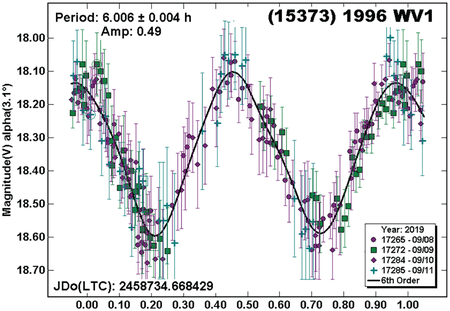
Table II.
Observing circumstances. The phase angle (α) is given at the start and end of each date range. LPAB and BPAB are the average phase angle bisector longitude and latitude (see Harris et al., 1984). The P2/P3 lines for 4495 Dassanowsky are for a secondary and tertiary period.
| Number | Name | 20xx/mm/dd | Phase | LPAB | BPAB | Period(h) | P.E. | Amp | A.E. |
|---|---|---|---|---|---|---|---|---|---|
| 1268 | Libya | 19/09/07–09/11 | 1.5,0.4 | 350 | 0 | 17.572 | 0.009 | 0.20 | 0.01 |
| 2018 September-October | |||||||||
| 4495 | Dassanowsky | 18/09/16–10/19 | 4.3,5.9 | 327 | 3 | 502 | 3 | 0.21 | 0.02 |
| P2 | 18.523 | 0.004 | 0.13 | 0.02 | |||||
| P3 (Monomodal) | 2.631 | 0.001 | 0.05 | 0.01 | |||||
| P3 (Bimodal) | 5.262 | 0.001 | 0.06 | 0.01 | |||||
| 2019 September | |||||||||
| 4495 | Dassanowsky | 19/09/07–09/25 | 14.9,11.9 | 41 | 1 | 431 | 3 | 0.32 | 0.02 |
| P2 | 18.10 | 0.02 | 0.05 | 0.01 | |||||
| P3 | 5.95 | 0.01 | 0.02 | 0.01 | |||||
| 15373 | 1996 WV1 | 19/09/08–09/11 | 3.1,2.5 | 352 | 7 | 6.006 | 0.004 | 0.49 | 0.05 |
Acknowledgements
Funding for observations at CS3 and work on the asteroid lightcurve database (Warner et al., 2009) and ALCDEF database (alcdef.org) are supported by NASA grant 80NSSC18K0851.
This work includes data from the Asteroid Terrestrial-impact Last Alert System (ATLAS) project. ATLAS is primarily funded to search for near earth asteroids through NASA grants NN12AR55G, 80NSSC18K0284, and 80NSSC18K1575; byproducts of the NEO search include images and catalogs from the survey area. The ATLAS science products have been made possible through the contributions of the University of Hawaii Institute for Astronomy, the Queen’s University Belfast, the Space Telescope Science Institute, and the South African Astronomical Observatory.
The authors gratefully acknowledge Shoemaker NEO Grants from the Planetary Society (2007, 2013). These were used to purchase some of the telescopes and CCD cameras used in this research.
Contributor Information
Brian D. Warner, Center for Solar System Studies / MoreData!, 446 Sycamore Ave., Eaton, CO 80615 USA
Robert D. Stephens, Center for Solar System Studies / MoreData!, Rancho Cucamonga, CA
References
- Dahlgren M; Lahulla JF; Lagerkvist C-I; Lagerros J; Mottola S; Erikson A; Gonano-Beurer M; Di Martino M (1998). “A Study of Hilda Asteroids. V. Lightcurves of 47 Hilda Asteroids.” Icarus 133, 247–285. [Google Scholar]
- Harris AW; Young JW; Scaltriti F; Zappala V (1984). “Lightcurves and phase relations of the asteroids 82 Alkmene and 444 Gyptis.” Icarus 57, 251–258. [Google Scholar]
- Harris AW; Young JW; Bowell E; Martin LJ; Millis RL; Poutanen M; Scaltriti F; Zappala V; Schober HJ; Debehogne H; Zeigler KW (1989). “Photoelectric Observations of Asteroids 3, 24, 60, 261, and 863.” Icarus 77, 171–186. [Google Scholar]
- Harris AW; Pravec P; Galad A; Skiff BA; Warner BD; Vilagi J; Gajdos S; Carbognani A; Hornoch K; Kusnirak P; Cooney WR; Gross J; Terrell D; Higgins D; Bowell E; Koehn BW (2014). “On the maximum amplitude of harmonics on an asteroid lightcurve.” Icarus 235, 55–59. [Google Scholar]
- Henden AA; Terrell D; Levine SE; Templeton M; Smith TC; Welch DL (2009). http://www.aavso.org/apass
- Kostov A; Bonev T (2017). “Transformation of Pan-STARRS1 gri to Stetson BVRI magnitudes. Photometry of small bodies observations.” Bulgarian Astron. J 28, 3 (AriXiv:1706.06147v2). [Google Scholar]
- Mainzer AK; Bauer JM; Cutri RM; Grav T; Kramer EA; Masiero JR; Nugent CR; Sonnett SM; Stevenson RA; Wright EL (2016). “NEOWISE Diameters and Albedos V1.0.” NASA Planetary Data System. EAR-A-COMPIL-5-NEOWISEDIAM-V1.0. [Google Scholar]
- Rubincam DP (2000). “Relative Spin-up and Spin-down of Small Asteroids.” Icarus 148, 2–11. [Google Scholar]
- Tonry JL; Denneau L; Flewelling H; Heinze AN; Onken CA; Smartt SJ; Stalder B; Weiland HJ; Wolf C (2018). “The ATLAS All-Sky Stellar Reference Catalog.” Astrophys. J 867, A105. [Google Scholar]
- Warner BD; Harris AW; Pravec P (2009). “The Asteroid Lightcurve Database.” Icarus 202, 134–146. Updated 2019 July. http://www.minorplanet.info/lightcurvedatabase.html [Google Scholar]
- Warner BD; Stephens RD (2019). “Lightcurve Analysis of Hilda Asteroids at the Center for Solar System Studies: 2018 September-December.” Minor Planet Bull. 46, 161–163. [PMC free article] [PubMed] [Google Scholar]