

Abstract
CCD photometric observations of seven Hilda asteroids were made at the Center for Solar System Studies (CS3) from 2019 April and June. Analysis of data for 1269 Rollandia and 3843 OISCA based on 2019 data led to review of our earlier results. For both objects, this resulted not in solving but deepening the mystery of the their true rotation periods.
CCD photometric observations of three Hilda asteroids were made at the Center for Solar System Studies (CS3) from 2019 April-June. This is another installment of an on-going series of papers on this group of asteroids, which is located between the outer main-belt and Jupiter Trojans in a 3:2 orbital resonance with Jupiter. The goal is to determine the spin rate statistics of the group and find pole and shape models when possible. We also look to examine the degree of influence that the YORP (Yarkovsky–O’Keefe–Radzievskii–Paddack) effect (Rubincam, 2000) has on distant objects and to compare the spin rate distribution against the Jupiter Trojans, which can provide evidence that the Hildas are more “comet-like” than main-belt asteroids.
Table I lists the telescopes and CCD cameras that are combined to make observations. Up to nine telescopes can be used for the campaign, although seven is more common. All the cameras use CCD chips from the KAF blue-enhanced family and so have essentially the same response. The pixel scales ranged from 1.24–1.60 arcsec/pixel. All lightcurve observations were unfiltered since a clear filter can result in a 0.1–0.3 magnitude loss. The exposures varied depending on the asteroid’s brightness and sky motion.
Table I.
List of available telescopes and CCD cameras at CS3. The exact combination for each telescope/camera pair can vary due to maintenance or specific needs.
| Telescopes | Cameras |
|---|---|
| 0.30-m f/6.3 Schmidt-Cass | FLI Microline 1001E |
| 0.35-m f/9.1 Schmidt-Cass | FLI Proline 1001E |
| 0.35-m f/11 Schmidt-Cass | SBIG STL-1001E |
| 0.40-m f/10 Schmidt-Cass | |
| 0.50-m f/8.1 Ritchey-Chrétien |
Measurements were made using MPO Canopus. The Comp Star Selector utility in MPO Canopus found up to five comparison stars of near solar-color for differential photometry. Comp star magnitudes were taken from ATLAS catalog (Tonry et al., 2018), which has Sloan griz magnitudes that were derived from the GAIA and Pan-STARR catalogs, among others. The authors state that systematic errors are generally no larger than 0.005 mag, although they can reach 0.02 mag in small areas near the Galactic plane. BVRI magnitudes were derived by Warner using formulae from Kostov and Bonev (2017). The overall errors for the BVRI magnitudes, when combining those in the ATLAS catalog and the conversion formulae, are on the order of 0.04–0.05.
Even so, we found in most cases that nightly zero point adjustments on the order of only 0.02–0.03 mag were required during period analysis. There were occasional exceptions that required up to 0.10 mag. These may have been related in part to using unfiltered observations, poor centroiding of the reference stars, and not correcting for second-order extinction terms. Regardless, the systematic errors seem to be considerably less than other catalogs, which reduces the uncertainty in the results when analysis involves data from extended periods or the asteroid is tumbling.
Period analysis was done with MPO Canopus, which implements the FALC algorithm by Harris (Harris et al., 1989). The same algorithm is used in an iterative fashion when it appears there is more than one period. This works well for binary but not for tumbling asteroids.
In the plots below, the “Reduced Magnitude” is Johnson V. These have been converted from sky magnitudes to unity distance by applying –5*log (rΔ) with r and Δ being, respectively, the Sun-asteroid and Earth-asteroid distances in AU. The magnitudes were normalized to the phase angle in parentheses using G = 0.15. The X-axis is the rotational phase ranging from –0.05 to 1.05. If the plot includes an amplitude, it is for the Fourier model curve and not necessarily the adopted amplitude for the lightcurve.
Our initial search for previous results started with the asteroid lightcurve database (LCDB; Warner et al., 2009) found on-line at http://www.minorplanet.info/lightcurvedatabase.html. Readers are strongly encouraged to obtain, when possible, the original references listed in the LCDB.
1269 Rollandia.
Finding a definitive period for this 105-km Hilda has been difficult over the years. Franco (2012) reported a period of 15.4 h. This was based on data obtained on three nights in 2012 March. The data set was noisy and the lightcurve was mostly flat except for a 0.08 mag “bump” from 0.3–0.8 rotation phase. Slyusarev et al. (2012) reported a period of 31 h and amplitude of 0.02 mag. No lightcurve was published in their ACM poster. Fauvaud and Fauvaud (2013), who observed almost the same time as Franco, determined P = 15.32 h, A = 0.13 mag. Their lightcurve was monomodal but had a gap between 0.1–0.3 rotation phase.
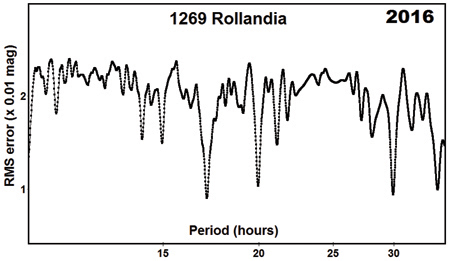
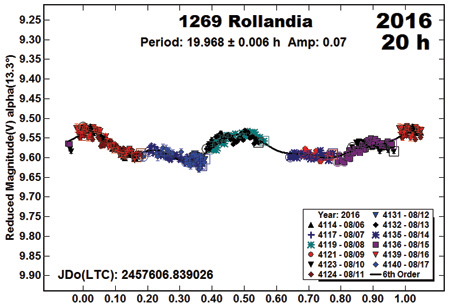
We observed Rollandia in 2016 August and found P = 19.98, A = 0.06 mag. Our hope was that new data in 2019 would resolve the ambiguities or at least reduce them. This would not be the case. The period spectrum was not helpful, showing several possible solutions and favoring an entirely new period.


Looking at the plots from 2019 individually, the solution at 13.84 h is almost monomodal, but the disjoint in the slopes between 0.2 to 0.5 rotation phase was concerning. A solution near 19 hours produced a trimodal curve, which is not improbable given the low amplitude (Harris et al., 2014). The apparently bimodal lightcurve at P = 27.49 h was rejected because of the slight asymmetry, i.e., the maximums or minimums were not 0.5 rotation apart. This does not automatically preclude the solution, but it close to the double period of 13.84 h, which we eventually put aside. The fit to near 32 hours has an unusual shape. In addition, the slopes of some of the individual nights don’t quite fit the model curve.
This left us with a solution of P = 17.36 h, which we have adopted for this paper because the curve is bimodal and more symmetrical than at 27 h and fits the model curve the best. This leaves a half-period solution of 8.68 h as another possibility. We returned to the data from 2016 to see if they could be fit to the new result or one of the other possibilities.


If nothing else, a period near 14 hours was eliminated. The best fit was again for a period of about 17 hours, but it is significantly different from the 2019 result. A definitive solution for 1269 Roliandia still proves elusive.
1902 Shaposhnikov.
There are numerous results in the LCDB for the 97-km Shaposnikov. Early results include Dahlgren et al (1998; 21.2 h). We observed it twice in recent years: Warner and Stephens (2017b, 20.987 h; 2018b, 20.988 h). The latest results are in good agreement with our previous periods.

3577 Putilin.
Previous results include Dahlgren et al. (1998, 29.0 h) and Warner and Stephens (2017b, 14.30 h). Brinsfield (2011) found yet another period: 18.270 h. Analysis of our data from the observations in 2019 April found P = 18.239 h. The solution is not fully secure but the period spectrum showed few alternate solutions of note. We turned to half-period plots. The only one that worked was near 9 hours, confirming the final result of 18.239 h. Our reanalysis of the 2016 data was able to find a similar period, 18.324 h.


3843 OISCA.
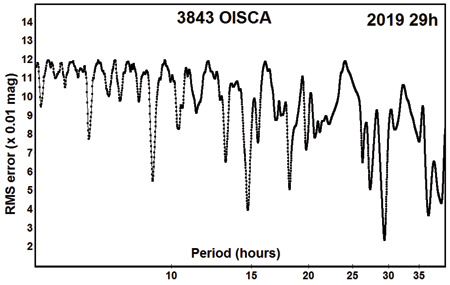
This is a 40-km member of the Hilda group. De Sanctis et al. (1994) found only lower limits of P > 16 h and A > 0.2 mag. Dalhgren et al. (1998) followed up with P = 19.078 and A = 0.28 mag. Our results from 2016 data (Warner and Stephens, 2018a) were P = 19.089 h and A = 0.32 mag, in good agreement with Dahlgren et al. Our analysis of data from 2019 turned an effort to refine the period and obtain more data for modeling into an effort just to find any period to which our 2016 and 2019 data sets would have a reasonable fit. It was not entirely successful. An unusual number of lightcurves are presented here to show the conundrum that was encountered more clearly.
Initial analysis of the full 2019 data set using as small of zero point adjustments as possible found a period of 29.41 h, or some 10 hours longer than previously reported (“2019 29h Full Data Set”). The “2019 29h” period spectrum was generated using the original zero points.

We then forced a period of 19.09 hours and adjusted zero points until we were able to get a match. The only way that this was possible was to use a subset of the 2019 data, eliminating the nights of 2019 April 22 and 23, which could not be fit no matter how severe the zero point adjustments. The period spectrum “2019 19h” shows the results of search after finding a fit using the subset. It is noticeably different from the previous one.
The period search range was narrowed and allowed to float instead of remain a fixed value. This produced a lightcurve with a period of 19.137 h that has a reasonable bimodal shape, albeit with significant gaps in coverage (“2019 19h Partial Data Set”).


The next step was to try to force the full set to the 19-hour solution. This was futile (“2019 19h Full Data Set”). No amount of zero point adjustments could get the data to fit a trimodal lightcurve, let alone bimodal, which would be more likely given the low phase angle and amplitude (Harris et al., 2014).
We revisited our 2016 data to force the data to see if they would fit with the new, longer period. The period spectrum using the original zero points, with very minor adjustments, showed a strong preference for a period of 19.075 h (“2016 19h”). This is slightly shorter than previously found with the same data. The two are statistically the same and so there was no concern about the very minor difference. The “2016 28h” plot shows the results of trying to force the data to near 29 h. Here again, no amount of zero point shifts would allow a fit to a bimodal or trimodal lightcurve.


We considered the possibility that the asteroid might be tumbling but the diameter and periods make tumbling highly unlikely (Pravec et al., 2014; 2005), but not impossible.
Because there is no reasonable fit to be found near 29 h using the 2016 data and because we can find a 19-h period using a subset of the 2019 data, we are adopting the revised 2016 period of P = 19.075 h for this paper. We have no explanation at this time for why two consecutive nights, 2019 Aug 22–23, deviated so much from the fit to a period near previous results.
(36274) 2000 AV107, (39266) 2001 AT2.
This appears to be the first reported rotation period for either asteroid. 2000 AV107 has a diameter of 18.38 km (Mainzer et al., 2016). The estimated diameter for 2001 AT2 is 17-km. The noisy data set makes the solution less than fully secure for the latter asteroid.

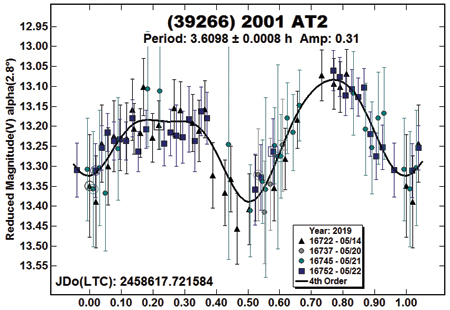
Table II.
Observing circumstances. The phase angle (&) is given at the start and end of each date range. LPAB and B PAB are the average phase angle bisector longitude and latitude (see Harris et al., 1984). When there is more than one line for an asteroid, the one in bold text gives the period adopted for this work.
| Number | Name | 20xx/mm/dd | Phase | LPAB | BPAB | Period(h) | P.E. | Amp | A.E. |
|---|---|---|---|---|---|---|---|---|---|
| 1269 | Rollandia | 19/04/17–04/25 | 16.3,16.6 | 136 | 0 | 17.36 | 0.01 | 0.06 | 0.01 |
| 1269 | Rollandia | 16/08/06–08/17 | 1.5,2.2 | 137 | 4 | 17.12 | 0.02 | 0.08 | 0.01 |
| 1902 | Shaposhnikov | 19/04/17–04/28 | 2.3,4.1 | 204 | 8 | 20.977 | 0.003 | 0.35 | 0.02 |
|
| |||||||||
| 3577 | Putilin | 19/04/17–04/28 | 16.8,17.3 | 141 | −3 | 18.239 | 0.007 | 0.27 | 0.02 |
| 3577 | Putilin | 16/07/14–08/01 | 13.0,10.7 | 351 | 4 | 18.324 | 0.007 | 0.13 | 0.01 |
|
| |||||||||
| 3843 | OISCA | 19/04/17–04/28 | 12.4,13.5 | 153 | 3 | 19.137 | 0.007 | 0.25 | 0.02 |
| Alternate | 29.41 | 0.02 | 0.38 | 0.03 | |||||
| 3843 | OISCA | 16/08/03–08/12 | 16.1,15.3 | 19 | −1 | 19.075 | 0.005 | 0.32 | 0.02 |
|
| |||||||||
| 36274 | 2000 AV107 | 19/06/08–06/25 | 9.2,12.6 | 231 | 14 | 5.9469 | 0.0004 | 0.35 | 0.03 |
| 39266 | 2001 AT2 | 19/05/14–05/21 | 2.8,4.5 | 229 | 7 | 3.6098 | 0.0008 | 0.31 | 0.03 |
Acknowledgements
Funding for observations at CS3 and work on the asteroid lightcurve database (Warner et al., 2009) and ALCDEF database (alcdef.org) are supported by NASA grant 80NSSC18K0851.
This work includes data from the Asteroid Terrestrial-impact Last Alert System (ATLAS) project. ATLAS is primarily funded to search for near earth asteroids through NASA grants NN12AR55G, 80NSSC18K0284, and 80NSSC18K1575; byproducts of the NEO search include images and catalogs from the survey area. The ATLAS science products have been made possible through the contributions of the University of Hawaii Institute for Astronomy, the Queen’s University Belfast, the Space Telescope Science Institute, and the South African Astronomical Observatory.
The authors gratefully acknowledge Shoemaker NEO Grants from the Planetary Society (2007, 2013). These were used to purchase some of the telescopes and CCD cameras used in this research.
Contributor Information
Brian D. Warner, Center for Solar System Studies / MoreData!, 446 Sycamore Ave., Eaton, CO 80615 USA
Robert D. Stephens, Center for Solar System Studies / MoreData!, Rancho Cucamonga, CA
References
- Brinsfield JW (2011). “Asteroid Lightcurve Analysis at the Via Capote Observatory: 1st Quarter 2011.” Minor Planet Bull 38, 154–155. [Google Scholar]
- Dahlgren M; Lahulla JF; Lagerkvist C-I; Lagerros J; Mottola S; Erikson A; Gonano-Beurer M; Di Martino M (1998). “A Study of Hilda Asteroids. V. Lightcurves of 47 Hilda Asteroids.” Icarus 133, 247–285. [Google Scholar]
- De Sanctis MC; Barucci MA; Angeli CA; Fulchignoni M; Burchi R; Angelini P (1994). “Photoelectric and CCD observations of 10 asteroids.” Planet. Space Sci 42, 859–864. [Google Scholar]
- Fauvaud S; Fauvaud M (2013). “Photometry of Minor Planets. I. Rotation Periods from Lightcurve Analysis for Seven Main-belt Asteroids.” Minor Planet Bull 40, 224–229. [Google Scholar]
- Franco L (2012). Balzaretto Observatory web site. https://digilander.libero.it/A81_Observatory/4435/index.html
- Harris AW; Young JW; Scaltriti F; Zappala V (1984). “Lightcurves and phase relations of the asteroids 82 Alkmene and 444 Gyptis.” Icarus 57, 251–258. [Google Scholar]
- Harris AW; Young JW; Bowell E; Martin LJ; Millis RL; Poutanen M; Scaltriti F; Zappala V; Schober HJ; Debehogne H; Zeigler KW (1989). “Photoelectric Observations of Asteroids 3, 24, 60, 261, and 863.” Icarus 77, 171–186. [Google Scholar]
- Harris AW; Pravec P; Galad A; Skiff BA; Warner BD; Vilagi J; Gajdos S; Carbognani A; Hornoch K; Kusnirak P; Cooney WR; Gross J; Terrell D; Higgins D; Bowell E; Koehn BW (2014). “On the maximum amplitude of harmonics on an asteroid lightcurve.” Icarus 235, 55–59. [Google Scholar]
- Kostov A; Bonev T (2017). “Transformation of Pan-STARRS1 gri to Stetson BVRI magnitudes. Photometry of small bodies observations.” Bulgarian Astron. J 28, 3 (AriXiv:1706.06147v2). [Google Scholar]
- Mainzer AK; Bauer JM; Cutri RM; Grav T; Kramer EA; Masiero JR; Nugent CR; Sonnett SM; Stevenson RA; Wright EL (2016). “NEOWISE Diameters and Albedos V1.0.” NASA PDS. EAR-A-COMPIL-5-NEOWISEDIAM-V1.0.
- Pravec P; Harris AW; Scheirich P; Kušnirák P; Šarounová L; Hergenrother CW; Mottola S; Hicks MD; Masi G; Krugly, Yu N; Shevchenko VG; Nolan MC; Howell ES; Kaasalainen M; Galád A; Brown P; Degraff DR; Lambert JV; Cooney WR; Foglia S (2005). “Tumbling asteroids.” Icarus 173, 108–131. [Google Scholar]
- Pravec P; Scheirich P; Durech J; Pollock J; Kusnirak P; Hornoch K; Galad A; Vokrouhlicky D; Harris AW; Jehin E; Manfroid J; Opitom C; Gillon M; Colas F; Oey J; Vrastil J; Reichart D; Ivarsen K; Haislip J; LaCluyze A (2014). “The tumbling state of (99942) Apophis.” Icarus 233, 48–60. [Google Scholar]
- Rubincam DP (2000). “Relative Spin-up and Spin-down of Small Asteroids.” Icarus 148, 2–11. [Google Scholar]
- Slyusarev IG; Shevchenko VG; Belskaya IN; Krugly, Yu N; Chiorny VG (2012). ACM 2012, #6398.
- Tonry JL; Denneau L; Flewelling H; Heinze AN; Onken CA; Smartt SJ; Stalder B; Weiland HJ; Wolf C (2018). “The ATLAS All-Sky Stellar Reference Catalog.” Astrophys. J 867, A105. [Google Scholar]
- Warner BD; Harris AW; Pravec P (2009). “The Asteroid Lightcurve Database.” Icarus 202, 134–146. Updated 2018 June. http://www.minorplanet.info/lightcurvedatabase.html [Google Scholar]
- Warner BD; Stephens RD (2017a). “Lightcurve Analysis of Hilda Asteroids at the Center for Solar System Studies: 2016 June-September.” Minor Planet Bull 44, 36–41. [PMC free article] [PubMed] [Google Scholar]
- Warner BD; Stephens RD (2017b). “Lightcurve Analysis of Hilda Asteroids at the Center for Solar System Studies: 2016 December thru 2017 April.” Minor Planet Bull 44, 220–222. [PMC free article] [PubMed] [Google Scholar]
- Warner BD; Stephens RD; Coley DR (2017). “Lightcurve Analysis of Hilda Asteroids at the Center for Solar System Studies: 2016 September-December.” Minor Planet Bull 44, 130–137. [PMC free article] [PubMed] [Google Scholar]
- Warner BD; Stephens RD (2018a). “Lightcurve Analysis of Hilda Asteroids at the Center for Solar System Studies: 2017 July Through September.” Minor Planet Bull 45, 35–39. [PMC free article] [PubMed] [Google Scholar]
- Warner BD; Stephens RD (2018b). “Lightcurve Analysis of Hilda Asteroids at the Center for Solar System Studies: 2018 January-April.” Minor Planet Bull 45, 262–265. [PMC free article] [PubMed] [Google Scholar]