

Abstract
CCD photometric observations of three Hilda asteroids were made at the Center for Solar System Studies (CS3) from 2019 January-March. For 1038 Tuckia, the period solution was ambiguous at either P = 18.020 h, amplitude 0.22 mag or P = 14.401 h, amplitude 0.20 mag. For 2246 Bowell, the analysis found P = 4.997 and amplitude 0.46 mag. For 4317 Garibaldi, we found a dual-period solution with P1 = 17.843 or 8.92 h and P2 = 11.426 h. The shorter value for P1 is similar to previously reported results but this is the first time a true dual-period solution, i.e., not an ambiguous single period solution, has been reported.
CCD photometric observations of three Hilda asteroids were made at the Center for Solar System Studies (CS3) from 2019 January-March. This is another installment of an on-going series of papers on this group of asteroids, which is located between the outer main-belt and Jupiter Trojans in a 3:2 orbital resonance with Jupiter. The goal is to determine the spin rate statistics of the group and find pole and shape models when possible. We also look to examine the degree of influence that the YORP (Yarkovsky–O'Keefe–Radzievskii–Paddack) effect (Rubincam, 2000) has on distant objects and to compare the spin rate distribution against the Jupiter Trojans, which can provide evidence that the Hildas are more “comet-like” than main-belt asteroids.
Table I lists the telescopes and CCD cameras that are combined to make observations. Up to nine telescopes can be used for the campaign, although seven is more common. All the cameras use CCD chips from the KAF blue-enhanced family and so have essentially the same response. The pixel scales ranged from 1.24-1.60 arcsec/pixel. All lightcurve observations were unfiltered since a clear filter can result in a 0.1-0.3 magnitude loss. The exposures varied depending on the asteroid’s brightness and sky motion.
Table I.
List of available telescopes and CCD cameras at CS3. The exact combination for each telescope/camera pair can vary due to maintenance or specific needs.
| Telescopes | Cameras |
|---|---|
| 0.30-m f/6.3 Schmidt-Cass | FLI Microline 1001E |
| 0.35-m f/9.1 Schmidt-Cass | FLI Proline 1001E |
| 0.35-m f/11 Schmidt-Cass | SBIG STL-1001E |
| 0.40-m f/10 Schmidt-Cass | |
| 0.50-m f/8.1 Ritchey-Chretien |
Measurements were made using MPO Canopus. The Comp Star Selector utility in MPO Canopus found up to five comparison stars of near solar-color for differential photometry. Comp star magnitudes were taken from ATLAS catalog (Tonry et al., 2018), which has Sloan griz magnitudes that were derived from the GAIA and Pan-STARR catalogs, among others. The authors state that systematic errors are generally no larger than 0.005 mag, although they can reach 0.02 mag in small areas near the Galactic plane. BVRI magnitudes were derived by Warner using formulae from Kostov and Bonev (2017). The overall errors for the BVRI magnitudes, when combining those in the ATLAS catalog and the conversion formulae, are on the order of 0.04-0.05.
Even so, we found in most cases that nightly zero point adjustments on the order of only 0.02-0.03 mag were required during period analysis. There were occasional exceptions that required up to 0.10 mag. These may have been related in part to using unfiltered observations, poor centroid fitting of the reference stars, and not correcting for second-order extinction terms. Regardless, the systematic errors seem to be considerably less than other catalogs, which reduces the uncertainty in the results when analysis involves data from extended periods or the asteroid is tumbling.
Period analysis was done with MPO Canopus, which implements the FALC algorithm by Harris (Harris et al., 1989). The same algorithm is used in an iterative fashion when it appears there is more than one period. This works well for binary but not for tumbling asteroids.
In the plots below, the “Reduced Magnitude” is Johnson V as indicated in the Y-axis title. These are values that have been converted from sky magnitudes to unity distance by applying −5*log (rΔ) with r and Δ being, respectively, the Sun-asteroid and Earth-asteroid distances in AU. The magnitudes were normalized to the phase angle in parentheses using G = 0.15. The X-axis is the rotational phase ranging from −0.05 to 1.05.If the plot includes an amplitude, e.g., “Amp: 0.65”, this is the amplitude of the Fourier model curve and not necessarily the adopted amplitude for the lightcurve.
Our initial search for previous results started with the asteroid lightcurve database (LCDB; Warner et al., 2009) found on-line at http://www.minorplanet.info/lightcurvedatabase.html. Readers are strongly encouraged to obtain, when possible, the original references listed in the LCDB.
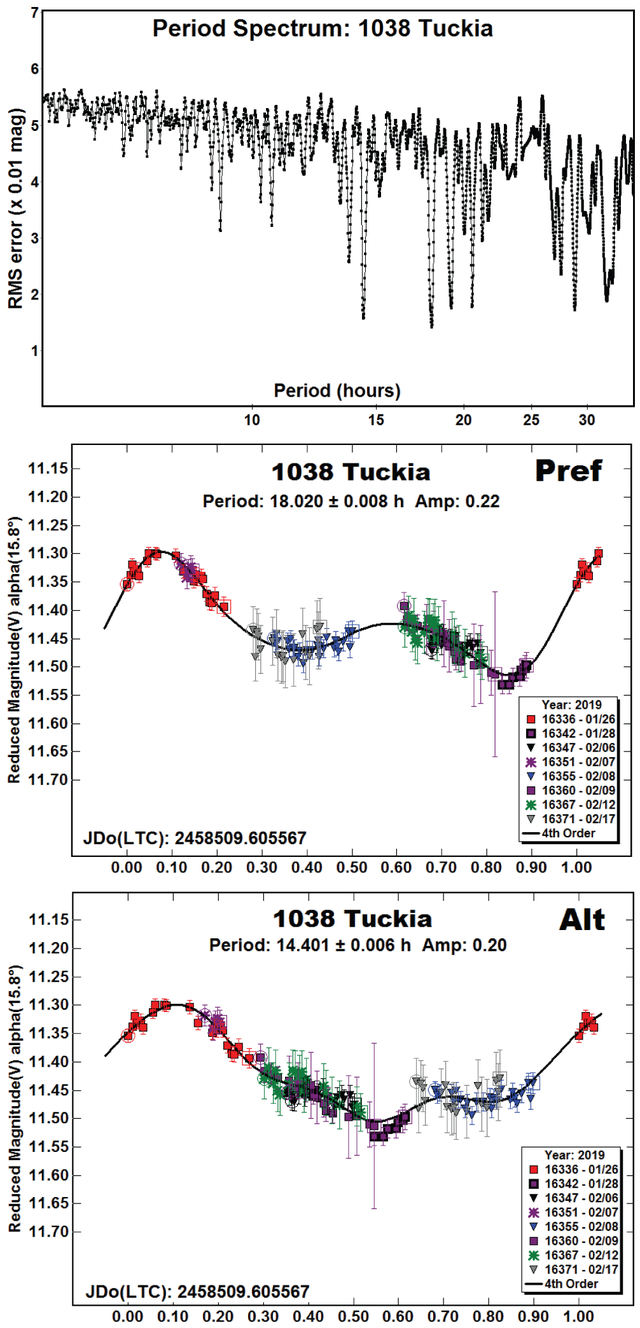
1038 Tuckia.
The only previous result in the LCDB was from Dahlgren et al. (1998). They reported a period of 23.2 h and amplitude of only 0.1 mag. They stressed, however, that a different bimodal and even monomodal solution could not be ruled out. Analysis of our 2019 data found two possible periods, P = 18.020 h or 14.401h, with the period spectrum slightly favoring the longer period. Despite the “Pref” and “Alt” labels in the lightcurves, either one – or even something else – is possible.
2246 Bowell.
Previous results by the authors include 4.993 h (Warner and Stephens, 2017) and 4.990 h (Warner and Stephens, 2018). The results from the 2019 observations are in good agreement. The phase angle bisector longitude distribution covers a range of nearly 100°. With sparse data from surveys, it should be possible to find a first good estimate for the spin axis ecliptic coordinates and sidereal period.

4317 Garibaldi.
Dahlgren et al. (1998) found a period of 28.5 h for this 38-km Hilda (Maizner et al., 2016). However, it’s rated U = 1 in the LCDB, meaning the solution is “probably wrong.” Warner and Stephens (2018) found a P = 8.959 h when using data from 2016 and P = 8.917 h using data from 2017. While very similar, the periods are about 5 sigma apart using the stated errors.
The initial analysis of the 2019 data set with 277 observations led to a less than ideal P = 17.83 h when assuming a single period. The “No Sub” lightcurve showed indications of a dual-period solution, which we explored using MPO Canopus.

The period spectrum for P1 favors 8.92 h (monomodal) or 17.84 h (bimodal). With an amplitude only 0.19 mag, Harris et al. (2014) showed that either solution is possible. We’ve adopted the “half” period solution of 8.92 h since it’s close to the one from 2017.

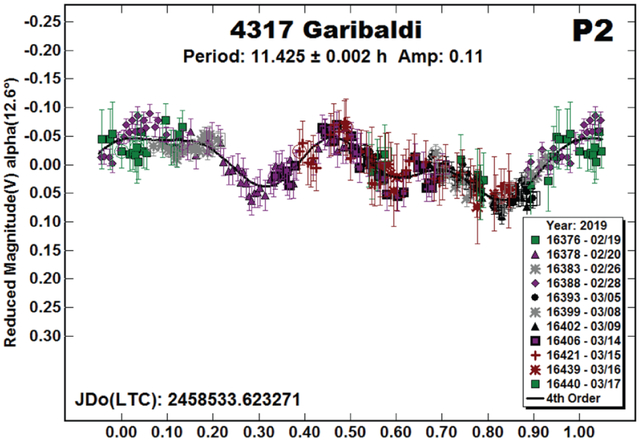
Regardless of which period was used for P1, the dual-period analysis found a strong solution (see the “P2” period spectrum) at 11.425 h. The shape of the curve is not one expected for the rotation of a satellite that is tidally locked to its orbital period. The phase angle is not large enough to allow deep-shadowing effects to affect the shape. The two periods are close to, but not overly so, a 3:2 ratio. Assuming a true physical reason for the second period, tumbling seems to be the remaining possibility.
MPO Canopus cannot properly analyze tumbling asteroid lightcurves but, on occasion, it can find two suspect periods that are reasonably well-defined or a single “beat frequency” period that produces a lightcurve for a body that is physically improbable, if not impossible. We suspect that this may be the case here but considerably more data are needed to find the true solution.
Table II.
Observing circumstances. The phase angle (α) is given at the start and end of each date range. LPAB and BPAB are the average phase angle bisector longitude and latitude (see Harris et al., 1984). The two lines for 1038 Tuckia give the preferred and alternate periods for an ambiguous solution. The lines for 4317 Garibaldi show the two periods of a dual-period solution (see text for additional information).
| Number | Name | 2019/mm/dd | Pts | Phase | LPAB | BPAB | Period(h) | P.E. | Amp | A.E. |
|---|---|---|---|---|---|---|---|---|---|---|
| 1038 | Tuckia | 01/26-02/17 | 141 | 15.8,16.3 | 62 | 2 | 18.020 | 0.008 | 0.22 | 0.01 |
| 14.401 | 0.006 | 0.20 | 0.01 | |||||||
| 2246 | Bowell | 03/22-03/24 | 130 | 14.8,14.9 | 117 | −4 | 4.997 | 0.001 | 0.46 | 0.02 |
| 4317 | Garibaldi | 02/19-03/17 | 277 | 12.6,16.4 | 111 | 11 | 17.843 | 0.003 | 0.19 | 0.02 |
| 11.426 | 0.002 | 0.11 | 0.02 |
Acknowledgements
Funding for observations at CS3 and work on the asteroid lightcurve database (Warner et al., 2009) and ALCDEF database (alcdef.org) are supported by NASA grant 80NSSC18K0851. This work includes data from the Asteroid Terrestrial-impact Last Alert System (ATLAS) project. ATLAS is primarily funded to search for near earth asteroids through NASA grants NN12AR55G, 80NSSC18K0284, and 80NSSC18K1575; byproducts of the NEO search include images and catalogs from the survey area. The ATLAS science products have been made possible through the contributions of the University of Hawaii Institute for Astronomy, the Queen's University Belfast, the Space Telescope Science Institute, and the South African Astronomical Observatory. The authors gratefully acknowledge Shoemaker NEO Grants from the Planetary Society (2007, 2013). These were used to purchase some of the telescopes and CCD cameras used in this research.
Contributor Information
Brian D. Warner, Center for Solar System Studies / MoreData! 446 Sycamore Ave., Eaton, CO 80615 USA
Robert D. Stephens, Center for Solar System Studies / MoreData! Rancho Cucamonga, CA
References
- Dahlgren M, Lahulla JF, Lagerkvist C-I, Lagerros J, Mottola S, Erikson A, Gonano-Beurer M, Di Martino M (1998). “A Study of Hilda Asteroids. V. Lightcurves of 47 Hilda Asteroids.” Icarus 133, 247–285. [Google Scholar]
- Harris AW, Young JW, Scaltriti F, Zappala V (1984). “Lightcurves and phase relations of the asteroids 82 Alkmene and 444 Gyptis.” Icarus 57, 251–258. [Google Scholar]
- Harris AW, Young JW, Bowell E, Martin LJ, Millis RL, Poutanen M, Scaltriti F, Zappala V, Schober HJ, Debehogne H, Zeigler KW (1989). “Photoelectric Observations of Asteroids 3, 24, 60, 261, and 863.” Icarus 77, 171–186. [Google Scholar]
- Harris AW, Pravec P, Galad A, Skiff BA, Warner BD, Vilagi J, Gajdos S, Carbognani A, Hornoch K, Kusnirak P, Cooney WR, Gross J, Terrell D, Higgins D, Bowell E, Koehn BW (2014). “On the maximum amplitude of harmonics on an asteroid lightcurve.” Icarus 235, 55–59. [Google Scholar]
- Kostov A, Bonev T (2017). “Transformation of Pan-STARRS1 gri to Stetson BVRI magnitudes. Photometry of small bodies observations.” Bulgarian Astron. J 28, 3 (AriXiv:1706.06147v2). [Google Scholar]
- Mainzer AK, Bauer JM, Cutri RM, Grav T, Kramer EA, Masiero JR, Nugent CR, Sonnett SM, Stevenson RA, Wright EL (2016). “NEOWISE Diameters and Albedos V1.0.” NASA Planetary Data System. EAR-A-COMPIL-5-NEOWISEDIAM-V1.0. [Google Scholar]
- Rubincam DP (2000). “Relative Spin-up and Spin-down of Small Asteroids.” Icarus 148, 2–11. [Google Scholar]
- Warner BD, Harris AW, Pravec P (2009). “The Asteroid Lightcurve Database.” Icarus 202, 134–146. Updated 2018 June. http://www.minorplanet.info/lightcurvedatabase.html [Google Scholar]
- Tonry JL, Denneau L, Flewelling H, Heinze AN, Onken CA, Smartt SJ, Stalder B, Weiland HJ, Wolf C (2018). “The ATLAS All-Sky Stellar Reference Catalog.” Astrophys. J 867, A105. [Google Scholar]
- Warner BD, Stephens RD, Coley DR (2017). “Lightcurve Analysis of Hilda Asteroids at the Center for Solar System Studies: 2016 September-December.” Minor Planet Bull. 44, 130–137. [PMC free article] [PubMed] [Google Scholar]
- Warner BD, Stephens RD (2018). “Lightcurve Analysis of Hilda Asteroids at the Center for Solar System Studies: 2017 July Through September.” Minor Planet Bull. 45, 35–39. [PMC free article] [PubMed] [Google Scholar]