

Summary
The inflammatory response to SARS-coronavirus-2 (SARS-CoV-2) infection is thought to underpin COVID-19 pathogenesis. We conducted daily transcriptomic profiling of three COVID-19 cases and found that the early immune response in COVID-19 patients is highly dynamic. Patient throat swabs were tested daily for SARS-CoV-2, with the virus persisting for 3 to 4 weeks in all three patients. Cytokine analyses of whole blood revealed increased cytokine expression in the single most severe case. However, most inflammatory gene expression peaked after respiratory function nadir, except expression in the IL1 pathway. Parallel analyses of CD4 and CD8 expression suggested that the pro-inflammatory response may be intertwined with T cell activation that could exacerbate disease or prolong the infection. Collectively, these findings hint at the possibility that IL1 and related pro-inflammatory pathways may be prognostic and serve as therapeutic targets for COVID-19. This work may also guide future studies to illuminate COVID-19 pathogenesis and develop host-directed therapies.
Keywords: COVID-19, SARS-CoV-2, transcriptomic profiling, early immune response, cytokine, IL1, T-cells
Graphical Abstract
Highlights
-
•
Early immune response in COVID-19 patients is highly dynamic
-
•
Most pro-inflammatory genes, except IL1, were induced after respiratory function nadir
-
•
Reduced T cell activation in mild cases may contribute to prolonged RNAemia
Through daily transcriptomic profiling of whole blood from SARS-CoV-2 patients, Ong et al. reveal that the early immune response is highly dynamic in COVID-19 patients. Aside from IL-1, peak cytokine expression occurs after the lowest point in respiratory function. These findings underscore the need for systematic sampling of COVID-19 patients.
Main Text
The emergence of the SARS-coronavirus-2 (SARS-CoV-2) that causes coronavirus disease 2019, or COVID-19, has now spread pandemically, resulting in a global health crisis. With autochthonous transmission in many countries, there is a high possibility that SARS-CoV-2 will become entrenched in humans. This possibility is now accentuated by large number of COVID-19 cases in which the source of transmission could not be traced. Until an effective vaccine is available to prevent infection and transmission, understanding the biology of SARS-CoV-2 infection in order to devise therapeutic strategies to reduce the risk of severe COVID-19 and the overall ∼2% mortality rate is thus urgently needed.
COVID-19 consists of a spectrum of clinical syndromes ranging from mild, flu-like illness to severe pneumonia. Inflammation is thought to underpin severe COVID-19, as laboratory investigations have also found elevated plasma levels of pro-inflammatory cytokines such as interleukin-1 beta (IL-1β), interleukin-8 (IL-8), and tumor necrosis factor alpha (TNFα) in severe COVID-19 patients (Huang et al., 2020). These findings bear resemblance to Severe Acute Respiratory Syndrome (SARS)—caused by the SARS CoV, another closely related coronavirus—where cytokine storm and other dysregulated immune responses have been associated with disease pathogenesis (Perlman and Dandekar, 2005). While efforts are now focused on identifying antiviral drugs against SARS-CoV-2, calls have been made to explore host-directed approaches to reduce the inflammatory response that is associated with severe COVID-19 (Zumla et al., 2020). However, the inflammatory response is dynamic and can fluctuate extensively from one day to another. Whether such dynamism is important to COVID-19 pathogenesis remains unknown; all studies thus far have analyzed blood collected over a range of time points from illness onset and combined into one phase of illness. If indeed the inflammatory and immune responses to SARS-CoV-2 are dynamic, time from illness onset will need to be accurately controlled for informative analysis.
Our goal in this study is to ask whether the inflammatory and immune responses to SARS-CoV-2 infection, especially in the early phase of illness, are indeed dynamic in order to guide hypotheses generation and design of studies to address disease pathogenesis and therapeutic interventions. We profiled the transcriptional changes in a panel of immune genes in three COVID-19 patients and ten healthy volunteers. We found a highly dynamic expression of pro-inflammatory genes. Expression of most of these genes peaked after the nadir of respiratory function, which calls into question the cytokine storm hypothesis. Instead, our data hints at the possibility that the IL1 pathway may be a more suitable correlate of severe respiratory disease. In addition, the attenuated cytokine expression associated with mild infection could also delay T cell immunity against SARS-CoV-2, which prolongs infection; this suggests the possibility that afebrile and undifferentiated COVID-19 cases may drive virus spread in the community.
Our index case—Case 1 (66-year old man from Wuhan, China) —presented on January 22, 2020 with a 2-day history of fever (38.1°C) and cough (Figure 1 A). Chest radiograph showed bilateral, patchy, ill-defined lung infiltrates (Figure 1B). Throat swab was positive for SARS-CoV-2 by RT-PCR (Corman et al., 2020). He progressively became more dependent on supplemental oxygen (Figure 1A), with worsening lung infiltrates on chest radiograph. His respiratory function reached a nadir on day 5 post illness onset, as evidenced by the oxygen saturation (Figure 1C) and tachycardia (Figure 1D) despite 4L of supplemental oxygen. He was initiated on oral lopinavir-ritonavir on the same day. After the first two positive SARS-CoV-2 RT-PCR findings, subsequent throat swabs from Case 1 were only positive intermittently until day 18 of illness (Figure 1A).
Figure 1.

Clinical Features of COVID-19 Cases
(A) Chronology of clinical findings for COVID-19 cases. For SARS-CoV-2 PCR, “+” indicates positive detection, “-” indicates negative detection, and “o” indicates not done. The initiation of lopinavir-ritonavir for Case 1 is noted by a diamond symbol. “∗” indicates when patient was fit for discharge. Dashed line on chronology denotes duration of hospital stay for Case 1 while awaiting travel documents from the Chinese embassy.
(B) Chest radiographs of Cases 1, 2, and 3 on admission, with presence of bilateral, patchy, ill-defined lung infiltrates in Case 1 but not in Cases 2 or 3.
(C) Relationship between oxygen saturation and supplemental oxygen in Case 1.
(D) Relationship between heart rate and supplemental oxygen in Case 1.
Case 2 (37 years old) was the son of Case 1. On January 23, he reported mild sore throat and cough that started 3 days earlier, even before onset of symptoms in the index case (Figure 1A). He also reported a one-day history of diarrhea on January 18. He was never febrile throughout this period. Chest radiographs were normal (Figure 1B). Nonetheless, throat swabs were consistently RT-PCR positive for SARS-CoV-2 in Case 2 until day 29 from illness onset (Figure 1A).
Case 3 was a 38-year-old businessman from Wuhan, China. He arrived in Singapore on January 22 and became unwell with fever, non-productive cough, lethargy, and myalgia a day later. He presented to the hospital on January 29 for persistent fever and was diagnosed with RT-PCR-confirmed COVID-19. He did not develop lower respiratory tract complications, but throat swabs were consistently RT-PCR positive for SARS-CoV-2 until 23 days post illness onset (Figure 1A). Chest radiograph was normal (Figure 1B).
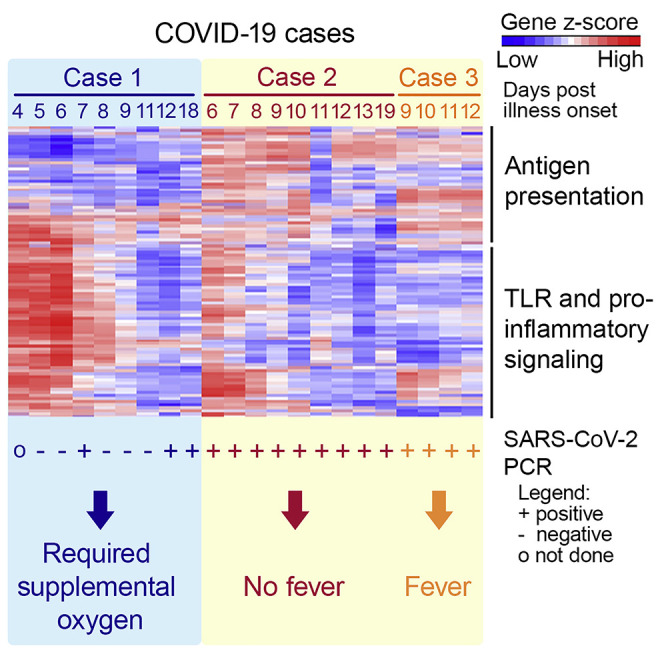
Analysis of RNA extracted from whole blood revealed a highly dynamic pro-inflammatory response in Case 1. Expression of pro-inflammatory genes in Case 1 (Figure 2 A), represented by cluster 4 and consisting of mostly genes driving the Toll-like receptor (TLR) and inflammatory response as well as cytokine signaling pathways (Figure S1), was notably higher than in healthy controls (Table S1). Expression of most of these genes peaked on day 6 of illness. This peak in pro-inflammatory gene expression thus lagged behind the nadir of respiratory function on day 5 of illness (Figures 1C and 1D). Indeed, cytokines such as IL2, IL6, TNF, and IFNA1/13 were either expressed within the range of healthy controls or were induced only after respiratory function nadir (Figure S1F). Only expression of the cytokines IL1A and IL1B preceded the nadir of respiratory function (Figure 2B). Correspondingly, expression of IL1 receptor (Figure 2B) and the associated downstream signaling molecules (Figure S1E) was also induced before respiratory function nadir. These findings, albeit from a single subject, raise the possibility that global cytokine expression is not the cause of compromised respiratory function in COVID-19 patients. Instead, the finding of increased expression of IL1 and its associated signaling pathway suggests that COVID-19 pathogenesis may be driven by this pathway. If this is proven correct, licensed IL1 or IL1 receptor antagonists—such as canakinumab and anakinra, respectively—could potentially be repurposed to treat COVID-19 patients to prevent respiratory dysfunction.
Figure 2.

IL1 and Related Pro-inflammatory Pathway Is Upregulated in Case 1
See also Figure S1 and Table S1.
(A) Unsupervised hierarchical clustering on genes profiled using the NanoString nCounter Human Immunology panel in healthy controls (n = 10) and COVID-19 cases. Gene clusters are annotated with a representative enriched pathway. Biological processes grouped under TLR and inflammatory signaling (1) include chronic inflammatory response and regulation of Toll-like receptor 4 signaling pathway, and those in TLR and inflammatory signaling (2) include lipopolysaccharide-mediated signaling pathway, regulation of MyD88-independent Toll-like receptor signaling pathway, I-kappaB phosphorylation and positive regulation of prostaglandin-E synthase activity.
(B) Gene expression for IL1A, IL1B, and IL1R1 is represented by normalized log2 counts.
(C) Gene expression for T cell markers CD4, CD8A, and CD8B is represented by normalized log2 counts. Dotted line and gray shaded areas indicate mean gene expression ± SD for healthy controls.
Another remarkable difference between Case 1 and Cases 2 and 3 as well as healthy controls were genes in cluster 3 (Figure 2A). In this cluster, mRNA of genes in the MHC class II—such as HLA-DRB1, HLA-DMA, and HLA-DMB—and T cell activation pathways—such as IL23A and CD74—were reduced in abundance in Case 1 compared to others (Figure S1). Accordingly, the CD4, CD8A, and CD8B mRNA transcript levels were the lowest among all the subjects (Figure 2C). Curiously, the expression of genes in these same pathways in Cases 2 and 3 were comparable with healthy controls (Table S1). These findings raise two possible explanations: first, Case 1 has reduced activation of adaptive immune genes, which unleashed the TLR-mediated pro-inflammatory response. Indeed, an experimental study has found that reduced T cell activation potentiates TLR-mediated inflammation in a positive feedback loop (Kim et al., 2007). Second and alternatively, increased expression of pro-inflammatory mediators in Case 1 could have led to recruitment of CD4+ and CD8+ T cells from the peripheral blood to sites of infection and the draining lymph nodes. That could have led to the mostly negative RT-PCR finding in the throat swabs from Case 1. In contrast, the lower pro-inflammatory responses in Cases 2 and 3 could have not only elicited mild symptoms but also led to a more attenuated T cell activation. Remarkably, Case 2 was afebrile throughout the period of isolation, and his cough resolved 10 days before SARS-CoV-2 RT-PCR became negative. However, with an attenuated T cell response, SARS CoV-2 became prolonged as shown by the consistent viral RT-PCR positivity that lasted for nearly a month. In either case, our data suggests an important role for T cells in COVID-19. Defining the role of T cells in either the pathogenesis of severe COVID-19 or prolonged SARS CoV-2 infection should thus be a priority, as the understanding of this would impact case management and virus transmission control, respectively.
We also did not observe any appreciable impact on pro-inflammatory gene expression, T cell responses, or viral clearance with lopinavir-ritonavir treatment. Indeed, pro-inflammatory gene expression continued to rise after treatment initiation, and SARS-CoV-2 RT-PCR was positive again 2 days after the start of treatment.
Finally, we believe that our data serve as a guide to design future investigations. Indeed, because of the prolonged course of illness, we quickly reached the ethical limit of blood volume that could be collected. We focused on measuring RNA, as we were able to isolate total RNA from whole blood collected directly into a denaturing guanidine-based lysis buffer that would inactivate any viremia. Moreover, the use of additional methods, such as flow cytometry and ELISPOT assay, would not be pragmatic for this initial characterization of the immune response; these methods require larger blood volumes and manipulation in a suitably equipped biosafety level 3 containment laboratory. Notwithstanding the small sample size, we believe our findings can serve to guide design of more detailed studies, especially in the choice of sampling time points to understand the pathogenesis of SARS-CoV-2 infection.
In conclusion, the acute immune response to SARS CoV-2 infection is dynamic, and this dynamism needs to be taken into consideration in COVID-19 pathogenesis studies.
STAR★Methods
Key Resources Table
| REAGENT or RESOURCE | SOURCE | IDENTIFIER |
|---|---|---|
| Biological Samples | ||
| Oropharyngeal swab samples from COVID-19 cases | This study | N.A. |
| Whole blood derived RNA samples from COVID-19 cases | This study | N.A. |
| Critical Commercial Assays | ||
| bioMerieux NucliSENS easyMAG | bioMerieux | N.A. |
| SuperScript III Platinum One-Step Quantitative RT-PCR system | Invitrogen | Cat# 11732-088 |
| Tempus™ Blood RNA Tube | Applied Biosystems | Cat# 4342792 |
| Tempus™ Spin RNA Isolation Kit | Invitrogen | Cat# 4380204 |
| nCounter® Human Immunology v2 Panel | NanoString Inc. | Cat# XT-CSO-HIM2-12 |
| Oligonucleotides | ||
| E_Sarbeco_F: 5′-ACAGGTACGTTAATAGTTAATAGCGT-3′ |
Corman et al., 2020; IDT | N.A. |
| E_Sarbeco_R: 5′-ATATTGCAGCAGTACGCACACA-3′ |
Corman et al., 2020; IDT | N.A. |
| E_Sarbeco_P1: 5′-FAM-ACACTAGCCATCCTTACTGCGCTTCG-BHQ1-3′ |
Corman et al., 2020; IDT | N.A. |
| RdRp_SARSr-F: 5′-GTGARATGGTCATGTGTGGCGG-3′ |
Corman et al., 2020; IDT | N.A. |
| RdRp_SARSr-R: 5′-CARATGTTAAASACACTATTAGCATA-3′ |
Corman et al., 2020; IDT | N.A. |
| RdRP_SARSr-P1: 5′-FAM-CCAGGTGGWACRTCATCMGGTGATGC-BHQ1-3′ |
Corman et al., 2020; IDT | N.A. |
| RdRp_SARSr-P2: 5′-FAM-CAGGTGGAACCTCATCAGGAGATGC-BHQ1-3′ |
Corman et al., 2020; IDT | N.A. |
| Deposited Data | ||
| Raw and analyzed data for NanoString profiling of healthy controls and COVID-19 cases | This paper | ArrayExpress: E-MTAB-8871 |
| Software and Algorithms | ||
| Philips Vue Picture Archiving and Communication System (PACS) version 12.2 | Philips | N.A. |
| Philips Vue Reporting Information System (RIS) version 11.2 | Philips | N.A. |
| GraphPad Prism version 8.3 | GraphPad Software | N.A. |
| Partek Genomics Suite version 7.18 | Partek Inc. | N.A. |
| nSolver version 4.0 | NanoString Inc. | N.A. |
Resource Availability
Lead Contact
Further information and requests for resources and reagents should be directed to and will be fulfilled by the Lead Contact, Jenny Guek Hong Low (jenny.low@singhealth.com.sg).
Materials Availability
This study did not generate new unique reagents.
Data and Code Availability
The raw data and normalized counts for NanoString profiling of immune responses is available at Array Express: E-MTAB-8871.
Experimental Model and Subject Details
Human Subjects
COVID-19 patients were all male and aged 66, 37 and 38 years old. All three patients gave informed consent and were recruited under the Novel Pathogen Study Protocol. This study has been approved by the SingHealth Combined Institutional Review Board (2013/397/F).
Healthy controls consisted of participants of a measles, mumps and rubella re-vaccination study (Ong et al., 2019). For healthy controls, 10 individuals were included (10 adults, average age of 44.1 years (SD: 11.8, range: 30-61 years), gender: 30% male, 70% female). All participants gave written informed consent. Study approval was obtained from the Central Institutional Review Board of the Singapore Health Services (CIRB 2017/2374).
Method Details
SARS-CoV-2 RT-PCR
Viral RNA was first isolated from patient’s oropharyngeal swab samples using bioMerieux NucliSENS easyMAG according to the manufacturer’s protocol. RT-PCR was performed using SuperScript III Platinum One-Step Quantitative RT-PCR system (Invitrogen Cat# 11732-088) with cycling conditions established by Corman et al. and the following primers and probes (Corman et al., 2020):
E_Sarbeco_F: 5′-ACAGGTACGTTAATAGTTAATAGCGT-3′
E_Sarbeco_R 5′-ATATTGCAGCAGTACGCACACA-3′
E_Sarbeco_P1 5′-FAM-ACACTAGCCATCCTTACTGCGCTTCG-BHQ1-3′
RdRp_SARSr-F 5′-GTGARATGGTCATGTGTGGCGG-3′
RdRp_SARSr-P2 5′-FAM-CAGGTGGAACCTCATCAGGAGATGC-BHQ1-3′
RdRP_SARSr-P1 5′-FAM-CCAGGTGGWACRTCATCMGGTGATGC-BHQ1-3′
RdRp_SARSr-R 5′-CARATGTTAAASACACTATTAGCATA-3′
E gene RT-PCR was used to screen samples, followed by confirmatory RT-PCR with the RdRp primers and probes, as previously described by Corman et al.
Chest Radiographs
The chest radiographic examinations were obtained using portable digital radiography equipment (Fujifilm Corporation, Tokyo, Japan). All the radiographs obtained were frontal AP projections in sitting posture. The acquired Digital Imaging and Communications in Medicine (DICOM) images were independently reviewed by a sub-specialty trained thoracic radiologist of 11 years experience using a 2048 × 2048-pixel monitor (Barco, Sunnyvale, CA, USA). The routine workflow involves archiving and reporting of images on integrated Philips Vue Picture Archiving and Communication System (PACS) v12.2 and Philips Vue Reporting Information System (RIS) v11.2.
NanoString nCounter Transcriptomic Profiling of Immune Response
Whole blood was collected from study subjects and stored in Tempus blood RNA tubes at −80°C. RNA isolation from whole blood was performed using the Tempus Spin RNA Isolation kit (Thermo Scientific) according to manufacturer’s instructions, eluted in 90 μL and stored at −80°C. Nanostring profiling of host response was performed using the nCounter Human Immunology v2 Panel. Total RNA (50ng) was hybridized to reporter and capture probe sets at 65°C for 24 h. Hybridized samples were loaded on the nCounter cartridge and post-hybridization steps and scanning was performed on the nCounter Sprint Profiler. RCC files were analyzed using nSolver analysis software (Version 4.0) as per the manufacturer’s protocols. Negative and positive controls included in probe sets were used for background thresholding, and normalizing samples for differences in hybridization or sample input respectively. Healthy controls consisted of participants of a measles, mumps and rubella re-vaccination study (Ong et al., 2019). Pre-vaccination whole blood was collected, processed and analyzed as described above. Hierarchical clustering was performed with Partek Genomics Suite 7.18 on z-score transformed normalized counts by Euclidean dissimilarity and average linkage.
Pathway Analysis
For pathway analysis, all genes in identified gene clusters were used as input data, and analyzed against the PANTHER classification system using Gene Ontology (GO) Enrichment Analysis for biological processes. To identify representative enriched GO terms, GO terms with > 40-fold enrichment following GO enrichment analysis were shortlisted. Due to the redundancy of enriched GO terms, GO terms and their p values were further summarized using REViGO. Enriched representative GO terms (FDR < 0.01) were plotted.
Quantification and Statistical Analysis
Details regarding number of healthy controls and error bars can be found in figure legends. Averages and standard deviations represented on graphs were calculated using GraphPad Prism (version 8.3). All graphs were generated using GraphPad Prism (version 8.3). No statistical comparison was made in this study.
Acknowledgments
We thank all doctors and nurses in the isolation facility in Singapore General Hospital. ViREMiCS was established through generous support from the Tanoto Foundation. EEO and JGL are funded by the National Medical Research Council of Singapore, through the Clinician Scientist Awards.
Author Contributions
E.Z.O., E.E.O., and J.G.H.L. conceptualized the study and wrote the manuscript. Y.F.Z.C., N.M.Y.L., S.K., S.M.H.M., K.S.C., and J.G.H.L. conducted the clinical investigations. E.Z.O. and W.Y.L. conducted the RNA extraction and Nanostring profiling. E.Z.O., A.T.T., A.B., E.E.O., and J.G.H.L. analyzed the Nanostring profiling data.
Declaration of Interests
The authors declare no competing interests.
Published: April 2, 2020
Footnotes
Supplemental Information can be found online at https://doi.org/10.1016/j.chom.2020.03.021.
Contributor Information
Eng Eong Ooi, Email: engeong.ooi@duke-nus.edu.sg.
Jenny Guek Hong Low, Email: jenny.low@singhealth.com.sg.
Supplemental Information
References
- Corman V.M., Landt O., Kaiser M., Molenkamp R., Meijer A., Chu D.K.W., Bleicker T., Brünink S., Schneider J., Schmidt M.L. Detection of 2019 novel coronavirus (2019-nCoV) by real-time RT-PCR. Euro Surveill. 2020;25 doi: 10.2807/1560-7917.ES.2020.25.3.2000045. [DOI] [PMC free article] [PubMed] [Google Scholar]
- Huang C., Wang Y., Li X., Ren L., Zhao J., Hu Y., Zhang L., Fan G., Xu J., Gu X. Clinical features of patients infected with 2019 novel coronavirus in Wuhan, China. Lancet. 2020;395:497–506. doi: 10.1016/S0140-6736(20)30183-5. [DOI] [PMC free article] [PubMed] [Google Scholar]
- Kim K.D., Zhao J., Auh S., Yang X., Du P., Tang H., Fu Y.X. Adaptive immune cells temper initial innate responses. Nat. Med. 2007;13:1248–1252. doi: 10.1038/nm1633. [DOI] [PMC free article] [PubMed] [Google Scholar]
- Ong E.Z., Gan E.S., de Alwis R., Wijaya L., Ong X.M., Zhang M., Wong A.W., Cheung Y.B., Zellweger R.M., Ooi E.E., Low J.G. Genomic signature of early T-cell response is associated with lower antibody titer threshold for sterilizing immunity. Antiviral Res. 2019;166:35–41. doi: 10.1016/j.antiviral.2019.03.013. [DOI] [PubMed] [Google Scholar]
- Perlman S., Dandekar A.A. Immunopathogenesis of coronavirus infections: implications for SARS. Nat. Rev. Immunol. 2005;5:917–927. doi: 10.1038/nri1732. [DOI] [PMC free article] [PubMed] [Google Scholar]
- Zumla A., Hui D.S., Azhar E.I., Memish Z.A., Maeurer M. Reducing mortality from 2019-nCoV: host-directed therapies should be an option. Lancet. 2020;395:e35–e36. doi: 10.1016/S0140-6736(20)30305-6. [DOI] [PMC free article] [PubMed] [Google Scholar]
Associated Data
This section collects any data citations, data availability statements, or supplementary materials included in this article.
Supplementary Materials
Data Availability Statement
The raw data and normalized counts for NanoString profiling of immune responses is available at Array Express: E-MTAB-8871.