

Summary
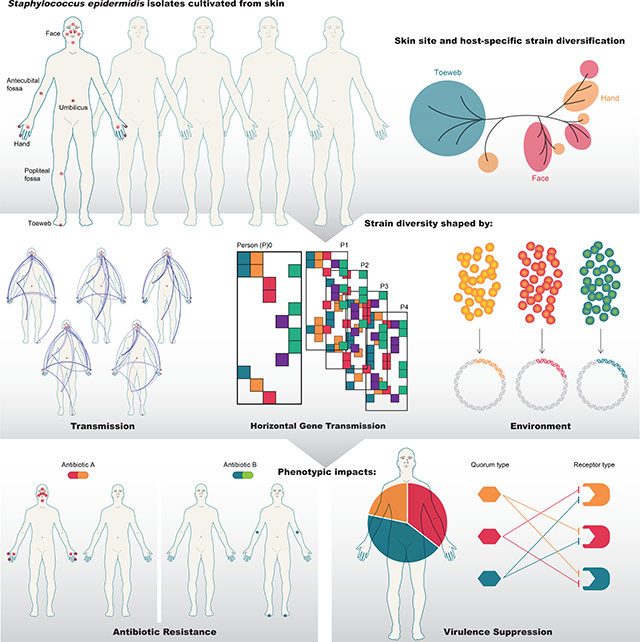
Metagenomic inferences of bacterial strain diversity and infectious disease transmission studies largely assume a dominant, within-individual haplotype. We hypothesize that within-individual bacterial population diversity is critical for homeostasis of a healthy microbiome and infection risk. We characterized the evolutionary trajectory and functional distribution of Staphylococcus epidermidis—a keystone skin microbe and opportunistic pathogen. Analyzing 1482 S. epidermidis genomes from 5 healthy individuals, we found that skin S. epidermidis isolates coalesce into multiple founder lineages rather than a single colonizer. Transmission events, natural selection, and pervasive horizontal gene transfer result in population admixture within skin sites and dissemination of antibiotic resistance genes within-individual. We provide experimental evidence for how admixture can modulate virulence and metabolism. Leveraging data on the contextual microbiome, we assess how interspecies interactions can shape genetic diversity and mobile gene elements. Our study provides insights into how within-individual evolution of human skin microbes shape their functional diversification.
Keywords: Staphylococcus epidermidis, metagenomics, strain diversity, microevolution, genomic variation, skin microbiome
In Brief
Matched isolate sequencing and shotgun metagenomics reconstructs Staphylococcus epidermidis spatiotemporal strain diversity, demonstrating how strain admixture can affect virulence, evolution, and metabolism within the human skin microbiome.
Graphical Abstract
Introduction
Microbial diversity is ultimately manifested at the finest taxonomic resolution: individual strains of a microbial species can exhibit widely diverse phenotypes. For example, most Escherichia (E.) coli strains are commensals in the human gastrointestinal tract, while some strains can cause severe disease (Leimbach et al., 2013). In human skin, commensal strains of Staphylococcus (S.) epidermidis, a ubiquitous skin colonizer (Oh et al., 2014, 2016), can protect against colonization by skin pathogens (Cogen et al., 2010a, 2010b; Lai et al., 2010), modulate the immune system (Lai et al., 2009; Linehan et al., 2018; Naik et al., 2012; Scharschmidt et al., 2015), and even prevent skin cancer (Nakatsuji et al., 2018). Simultaneously, S. epidermidis is a common cause of bloodstream and indwelling medical device infection (National Nosocomial Infections Surveillance System, 2004). Many clinical isolates of S. epidermidis moreover carry genes encoding antibiotic resistance or biofilm formation (reviewed in Otto, 2009), impeding treatment.
Our understanding of strain-level diversity is complicated by the observation that each human carries a distinct collection of microbial strains, as revealed by comparative metagenomic (Lloyd-Price et al., 2017; Oh et al., 2014) and culture-based studies (Nataro and Kaper, 1998). These strains can originate from our earliest days via maternal transmission (Asnicar et al., 2017; Ferretti et al., 2018; Yassour et al., 2018) and can be shaped by different host-specific factors, such as disease and health status (Duvallet et al., 2017; Greenblum et al., 2015; Tett et al., 2017; Zhang and Zhao, 2016). However, subsequent diversification of strains within an individual—one’s own intrinsic bacterial population diversity—is little understood, largely due to the limitations in the sequencing depth of metagenomic studies and sample sizes of culture-based studies. The most fundamental questions are how diverse are within-individual bacterial populations, what begets, then maintains this diversity (if exists), and what is the impact on human health?
We can further delineate the question of population diversity by asking if founding lineages, once established, further diverge within and between skin sites, or is there continual transmission and genetic exchange across the body and evolution over time? Are there functional consequences of genetic diversification, such as niche specialization or the dissemination of antibiotic resistance or virulence factors? How are they affected by horizontal gene transfer (HGT)? Finally, does the surrounding microbiota affect the diversity of a focal population or provide additional opportunities for genetic exchange by HGT? Addressing these questions requires high-quality whole genome sequences for tracking evolutionary processes, broad skin site representation with sufficient sampling depth to assess prevalence of microbial features at each site, and paired metagenomic data to interrogate the influence of environmental factors. To date, nearly all large-scale studies investigating microbial population diversity have done so using isolates obtained from different individuals, disease sites, or environments to identify interpersonal/environmental transmission events or identify virulence characteristics of infectious disease-associated isolates. Yet recent studies of gut microbes suggest the biological significance of within-host evolution (Zhao et al., 2019).
In this study, we present a detailed analysis on the within-individual spatio-temporal diversity of S. epidermidis. S. epidermidis is ubiquitous yet of low abundance in human skin (Oh et al., 2014), thus particularly intractable for metagenomic approaches for inferring strain diversity (Oh et al., 2014; Quince et al., 2017; Truong et al., 2017). In addition, its extensive genomic heterogeneity (Conlan et al., 2012) makes it strong candidate for HGT and ecological niche specialization. Indeed, the complexity of the human skin’s microenvironments, which encompass dry, moist, and oily sites and correspondingly different compositions of the contextual microbiota (Oh et al., 2014), provide unique opportunities for local S. epidermidis to functionally specialize. Moreover, host-specific behaviors can foster or curb microbial transmission, with frequent physical contacts between some skin sites and near-isolation from others (e.g., nares from foot).
We generated a whole genome shotgun (WGS) sequencing dataset of 1482 S. epidermidis isolates cultured from 16 skin sites from five healthy males and females at 2–4 time points over a month (Table S1, Figure S1). We paired the isolate sequencing data with 153 metagenomic whole-genome shotgun (mWGS) sequencing data samples collected from the same skin sites to explore how the contextual skin microbiome may shape S. epidermidis genetic diversity. Our study reveals a remarkable spatio-temporal diversity and genetic exchange of S. epidermidis within each individual. We experimentally show that this genetic admixture can suppress virulence and regulation of metabolic pathways, suggesting an evolutionary mechanism by which genetically diverse strains can co-exist in the skin. Broadly, we identified patterns of population-level diversity that are both skin-site-specific and subject-specific, and determined how such diversity patterns resulted from different evolutionary (e.g., point mutation, HGT) and demographic processes (e.g., transmission across skin sites).
Results
Data characteristics
1629 S. epidermidis clones were isolated from five healthy males and females from 16 defined anatomical skin sites (Table S1 for skin site nomenclatures, “_L” indicated the left side of the body and “_R” the right) at 2–4 time points (denoted as T1-T4) over a month, with ~10 isolates sampled at random and sequenced per site/timepoint/subject. After sequencing, assembly and quality filtering (Figure S1), 1482 S. epidermidis draft genomes (median genome size = 2.49 Mbp (range 2.20–2.78 Mbp) were reconstructed at median 101.6x coverage (17.7–794.9x), hereafter referred to as the “subject isolates”. In addition, total DNA was isolated from 153 matched skin swab specimens for metagenomic library preparation and sequencing (median reads after quality filtering and removal of human DNA=1,850,938 (377,256–26,290,470, Table S1).
Skin S. epidermidis population diversity is shaped by transmission and skin site specialization
Microbial populations on the human skin can be derived from a single founding member over one’s lifetime in the absence of major perturbations (a single colonizer hypothesis), or alternatively colonized by multiple founder lineages. These hypothetical processes are distinguishable depending on whether isolates sampled from different individuals have distinct most recent common ancestors (MRCAs) – suggesting a single colonization event in each individual, such as that observed for B. fragilis in the human gut (Zhao et al., 2019) – or not, suggesting the presence of multiple founder lineages (Figure 1A). Here, we reconstructed the molecular phylogeny based on SNPs in the core genome (regions conserved across all isolates) from our 1482 subject isolates (Table S1) and 50 publicly deposited, high-quality S. epidermidis genomes sampled from healthy and diseased individuals (Conlan et al., 2012 and the unpublished VCU collection, Table S2). Collectively, S. epidermidis isolates formed two major phylogenetic clades (Figure 1B), similar to previous observations (Conlan et al., 2012; Oh et al., 2014). Surprisingly, isolates from each subject, as well as the 50 public isolates, shared a MRCA, suggesting the presence of multiple founder lineages (Figure 1B and 1C). This observation revealed that unlike B. fragilis, diversity within founder lineages is maintained in S. epidermidis, resulting in broad phylogenetic representation within a single host.
Figure 1.

Phylogenetic variation of the individualized S. epidermidis isolates. A, two alternative scenarios of within-individual evolution. Each circle represents a cluster of isolates diverged from a single founder lineage colonizing a given host. In the first scenario (left), all isolates from a given host diverged from a single founder lineage; in the second scenario (right), isolates from each host diverged from multiple distinct founder lineages. B, core-genome phylogeny (midpoint rooted) based on 58498 core-genome SNP loci for the 1482 isolates sampled in this study and 50 previously sequenced isolates from multiple diseased and healthy individuals. Skin site of each isolate is indicated in green. C, individualized S. epidermidis isolates evolved from multiple founder lineages. Each founder lineage is represented by a circle and is defined as the highest node from which at least 95% of the derived isolates (i.e. tip nodes) were either found in the same subject or public strains. The size of the circle represents the number of isolates derived from that lineage. D, pairwise cophenetic distances of the 1482 isolates. Note that the distribution of ‘between-subject’ distances depends on the sample size per subject, with p0, who had the most isolates cultivated, having the largest contribution. The toeweb is highlighted to illustrate its unusual between-subject similarity.
Moreover, subject isolates exhibited subject- and skin site-specific phylogenetic structuring (Figure 1D, PERMANOVA based on cophenetic distances, p=0.001 for skin sites, subjects, and their interaction term). Strikingly, all toeweb isolates spanned a limited phylogenetic space not only within each of the five subjects, but also between subjects (Figure 1D). Such uniformity in phylogenetic similarity of toeweb isolates was unlikely due to stochastic mechanisms (e.g., population bottleneck), suggesting a stronger purifying selection favoring the growth of a particular genetic configuration.
An evolutionary process particularly relevant to skin microbes is transmission of bacteria across environmental barriers, which can further modulate the genetic diversity landscape (Brito and Alm, 2016; Mideo et al., 2008; Niehus et al., 2015). Indeed, sister isolates—isolates with 0 core-genome nucleotide differences, likely representing recent descendants of the same lineage—were observed at different skin sites (Figure 2A). Although the number of shared sister isolates could be skewed due to sampling depth and the overall frequency of sister isolates within a population, it is highly unlikely for isolates observed at different skin sites to accumulate exactly the same alleles at all core-genome SNP loci (n=58498). Therefore, the presence of shared sister isolates heuristically supports the presence of recent transmission events. However, shared sister isolates cannot be used to infer historical transmissions nor provide quantitative estimates of transmission rate. To quantitatively estimate and compare transmission between skin sites, we inferred transmission events along a phylogenetic tree using Bayesian evolutionary analysis by sampling trees (BEAST) (Suchard et al., 2018). BEAST represented transmission events as switches in node states (for an example, see Figure S2A), and estimated transmission probability by sampling many time-calibrated phylogenetic trees (n=2000 in this study). Based on the time calibration, isolates from each subject diverged from multiple ancestral nodes that were older than the subject (Figure S2B) and suggested that the S. epidermidis population on a given subject was likely established by at least 12–20 founder strains (Figure S2B). The diverse founder strains then further diverged into the isolates observed in this study, at least partially explaining their broad phylogenetic representation (Figure 1B).
Figure 2.

Subject-specific transmission patterns of S. epidermidis isolates. A, proportion of sister isolates shared between two skin sites. B, transmission map summarizing the BEAST analysis. Colors of the lines connecting skin sites show the posterior probability that the transmission rate between the two sites was not 0. Lines with posterior probabilities < 0.3 were removed for better visualization. See also Figure S2.
We then estimated the probability of transmission between each pair of skin sites, resulting in a probabilistic transmission map of within-individual S. epidermidis on the human skin (Figure 2B). Both the transmission map and the previous heuristic method (Figure 2A) revealed that 1) transmission occurs frequently between facial sites and hand sites, which are relatively exposed, 2) transmission patterns are subject-specific, and 3) the umbilicus and toeweb were relatively isolated from the rest of the skin sites. For the toeweb and umbilicus, the lack of transmission can result in distinct S. epidermidis gene contents in these subpopulations (Figure S2C). Interestingly, in subject p3, which had relatively few shared sister isolates (Figure 2A), transmission between facial and hand sites was still frequent (Figure 2B), consistent with the presence of closely related isolates with few (but not 0) SNPs at different skin sites (Figure 1D). Biologically, this could be due to larger effective population sizes in p3, which decreased the probability of observing sister isolates shared between skin sites. Note that the heuristic method (Figure 2A) and the probabilistic transmission map (Figure 2B) showed some incongruencies for a subset of skin sites; this is because the heuristic method reports sharing of sister isolates “as it is”, while the probabilistic transmission analyses additionally infers the transmission rates that are necessary to explain the data through variable selection (see STAR Methods). Altogether, these findings suggested that topography is an important determinant of S. epidermidis population diversity in the skin and is further shaped by transmission between sites such as the hand and the face, or geographic isolation, as for the umbilicus and toeweb.
Individualized, skin-site-dependent, and dynamic evolution of S. epidermidis gene content
Gene content diversification—likely driven both by transmission and natural selection—is important because it indicates the functional capacity of a given isolate, and also how that capacity is constrained within a host, is associated with skin sites, and fluctuates over time. Previous metagenomic studies have suggested host- and skin-site-specificity of strain-specific gene content (Tett et al., 2017); here, we leveraged our large isolate dataset to test these hypotheses.
Isolates sampled from each subject constituted relatively closed pan-genomes with comparable sizes across the subjects (Figure 3A), suggesting a limited repertoire of within-individual gene content. Conversely, this gene content showed considerable subject-specificity. Only 55.4%−65.1% of the S. epidermidis gene clusters observed in a given subject (i.e., the subject-specific pan-genome) and 58.0%−80.5% of the gene clusters observed in all isolates of a given subject (i.e., the subject-specific core-genome) were shared between all five subjects, and 9.5%−15.6% of gene clusters were entirely unique to a subject (Figure 3B). These findings suggested a personalization of gene content at the population-level: while the S. epidermidis population found in a single host retains the inherent diversity from multiple founder lineages, further evolution of the S. epidermidis gene repertoire occurred in a host-specific manner. Consistent with this observation was the much greater size of the collective pan-genome of the 50 publicly available genomes (Figure 3A) and additional 17.4% of the gene clusters unique to the public strains (Figure 3B). Put together, our results showed that, despite their wide distribution in the SNP-based phylogeny (Figure 1B), S. epidermidis within a single host had constrained gene content diversity.
Figure 3.

Gene content diversity of the subject isolates. A, gene accumulation curves for the subject-specific pan-genomes (5476–6436 gene clusters) and core-genomes (954–1325 gene clusters), or that of the 50 public isolates, as a function of the number of sequenced isolates. Error bars show the standard deviation for 10 simulations. B, shared vs. unique subject-specific pan- and core-genes in the subject isolates and public strains. C, diversity of the subject isolates based on presence and absence of accessory genes. Leaf nodes are colored by the skin site of origin; the background color indicates the subject. A cluster containing toeweb isolates from all five subjects is highlighted in purple. D, the distribution of S. epidermidis genes in p0 with respect to their variability across skin sites (see Figure S3D for other subjects). An example cluster of genes with high variability is highlighted with a red box (boundaries arbitrarily selected), and their prevalence shown in the heatmap. Each row in the heatmap represents a unique S. epidermidis gene, and the row and column hierarchical clusters were generated based on Euclidean distances. E, the COG functional categories of representative toeweb genes (i.e. present in >40% of the toeweb isolates but <10% in any of the other skin sites, n=28). See also Figure S3 and Table S3.
Next, we sought to further dissect the spatio-temporal variation in this individualized gene repertoire. In addition to moderate yet potentially significant temporal fluctuations (Figure S3A–C), S. epidermidis gene content showed structuring by skin site: toeweb isolates consistently contained distinct gene contents compared to isolates from other skin sites, as revealed by hierarchical clustering of the subject isolates based on the presence and absence of accessory genes (Figure 3C). Genes that were specifically present or absent in the toeweb isolates consistently constituted a substantial fraction of the site-specific accessory genes (i.e., a relatively large standard deviation of prevalence across skin sites, Figure 3D and S3D). This suggested a strong specialization of gene content to the toeweb via both entirely unique genes as well as a lack of many genes common to other skin sites (Figure 3D and S3D). Lack of transmission also likely contributed to the distinct S. epidermidis gene contents in these subpopulations, which was also observed in the umbilicus (Figure 3D and S2C). Yet the biological functions of the toeweb-specific genes were largely obscure (Figure 3E and Table S3), underscoring the need for additional tools to study strain-specific gene functions. Other annotatable biological functions, including KEGG modules, lantibiotics, and other biosynthetic gene clusters (BGCs), also showed host-specificity and skin site-heterogeneity (Table S3) in both prevalence (Figure S3E–F) and sequence variation (Figure S3G–J).
Given this extensive gene-level diversity, we anticipated that isolates with the closest vertical evolutionary history (as assessed by core-genome SNP differences, Duchene et al., 2016) would have the most similar gene content. However, we found a significant incongruence in SNP differences and gene content heterogeneity (Figure 4A, linear regression R2=0.503): 5.0%±3.2% of genes differed even between sister isolates, which have no core-genome SNP differences, suggesting the presence of very recent evolutionary processes that increase gene content diversity (Figure 4A). To study such processes, we systematically identified 239 groups of sister isolates (defined as lacking in core genome SNP differences and having very low pairwise nucleotide differences, Table S4 and Figure S4) and identified gene content differences within each group. Strikingly, over half of the gene clusters in the pan-genome (5853 out of 10583) were differentially present between isolates in at least one of the 239 groups of sister isolates (Table S4, hereafter referred to as “differential genes”). We note that most of these differential genes (n=4217) were unlikely identified due to incomplete genome assembly (Figure 4B, adjusted p<0.001).
Figure 4.

Diversification of sister isolates driven by potential HGT events. A, gene content heterogeneity – the proportion of genes that are only found in one isolate of a pair of isolates – as a function of pairwise core-genome nucleotide differences. For visualization, the plot includes only 10000 randomly sampled data points. Gene content heterogeneity between sister isolates are highlighted with a blue box. B, functional annotation of the differential genes. All differential genes were mapped to KEGG orthologs (the annotations of the KEGG orthologs were shown when available) and their prevalence within sister isolate groups is shown. The p-value shows the probability of observing the differential prevalence solely due to genome incompleteness. The error bars show the standard deviation across sister isolate groups. C, presence of differential genes in the 20 unique mobile-element-like contigs identified using PlasFlow. The heatmap shows the fraction of nucleotides in the mobile-element-like contigs that was aligned to the 25 chromosome-like contigs identified containing differential genes. The error bars show the standard deviation across sister isolate groups. Two predicted phage sequences (nearly 100% alignment over contig length) are indicated by arrows. D, gene content of the predicted phage sequences indicated in Figure 4C. Note that the sequences are visualized in a circular layout but are not necessarily circular DNAs. See also Figure S4 and Table S4.
Functional heterogeneity between sister isolates ranged from transport and metabolism to cell structure and defense (Figure 4B) and could result from both gene loss and gene gain events. For example, a differential gene absent in most sister isolates while present in only a small fraction (e.g., K12549, present in 1/11 isolates in the same group, Figure 4B bottom) more likely resulted from a recent gene gain event. On average, a sister isolate contained 26±29 genes that likely resulted from a gene gain event (i.e., missing in over 50% of the sister isolates of the same group). Alternatively, a differential gene carried by most sister isolates while absent in only a small subset of isolates (e.g., the hemin permease protein K09813, present in 9/11 sister isolates in the same group, Figure 4B top) more likely resulted from a gene loss event associated with the small subset. Given the large variation in the prevalence of the differential genes among sister isolates (Figure 4B), both gene gain events and gene loss events likely contributed to the divergence of the sister isolates.
A common mechanism for gene gain events without concomitant accumulation of core-genome SNP diversity is HGT—the direct exchange of genetic elements. In the core-genome region, HGT among the subject isolates was likely (suggested by the 104 predicted recombination events, with each isolate affected by 6.2±3.8 events, Table S4) but were of relatively low rate (population-scaled recombination rate=0.14%). For accessory genes, we inferred if HGT contributed to gene content diversity among sister isolates by examining whether the differential genes were observed in mobile element-like contigs. Of the 171 contigs that contained at least 10 differential genes, 53 contigs (with 20 unique contig sequences, Figure 4C) were predicted as mobile elements using an artificial neural network model implemented in PlasFlow (Krawczyk et al., 2018), again suggesting that HGT is likely. In addition to mobile-element-like contigs, we identified 25 unique chromosome-like contig sequences (Figure 4C). Interestingly, at least two mobile element-like contigs appeared to have integrated into multiple chromosome-like contigs, as defined by nearly 100% alignment over the length of the contigs (Figure 4C). These were annotated as phage sequences (Figure 4D), further indicating that mobile elements such as phages could dynamically drive the divergence of sister isolates recently descended from a common ancestor.
Both predicted plasmid segments (383 unique) and phages (61 unique) had significantly different prevalence across subjects and skin site (Figure 5A and S5A, for both, PERMANOVA based on Euclidean distance p<0.001 for both skin site and subject). As our genomes are draft quality, it is unclear which predicted plasmid segments are physically located on the same replicon (mapped to 9.5±1.6 contigs per genome), though clustering based on skin site distribution showed possible physical or functional linkages (Figure 5A). Two clusters, X and XI, were strongly associated with toeweb isolates (Figure 5A), suggesting that the toeweb subpopulation contained unique mobile elements. Even when only considering previously identified plasmids (4.6±2.7 predicted plasmid contigs/genome), the toeweb subpopulation still possessed a unique set of predicted plasmid segments (Figure S5B). Taken altogether, given that plasmids and phages commonly mediate HGT, the observed association between subjects, skin sites and predicted plasmid/phage types suggested that S. epidermidis subpopulations could access different sets of HGT genes at different skin sites and in different hosts.
Figure 5.

ABR genes encoded by predicted S. epidermidis plasmids. A, prevalence of predicted plasmid segments (i.e., the proportion of isolates carrying the predicted plasmid segments) across subjects and skin sites. The row and column hierarchical clusters were generated based on Euclidean distances. This panel is related to Figure S5B, which uses a different plasmid prediction method. B, prevalence of predicted plasmid-encoded ABR. The heatmap shows the number of predicted plasmid segments that conferred resistance to both the row and the column antibiotics. C, host-specific distribution of predicted MDR plasmid segments. The ABR genes (and the respective antibiotics they confer resistance to) encoded by two predicted MDR plasmid segments are shown. Note that sequences are visualized in a circular layout but were not gap-closed. D, MIC50 and MIC90 of selected antibiotics and their association with predicted plasmid-encoded ABR genes. Two isolates (0995 and 1085) that conferred resistance to all six tested antibiotics were indicated by purple arrows. See also Figure S5 and Table S5.
Functional consequences of population-level diversity
Given the role of S. epidermidis both as an opportunistic pathogen and a gene reservoir for other skin pathogens such as S. aureus (Archer and Johnston, 1983; Forbes and Schaberg, 1983; Méric et al., 2015), we next examined if the observed genetic diversity of S. epidermidis could have functional consequences that could impact its role in skin health and disease. We particularly examined mobile gene elements, given that they can shape the gene content landscape of S. epidermidis and potentially contribute to the spread of virulence factors and antibiotic resistance genes (ABR). Importantly, a significant fraction of predicted plasmid segments (Figure 5A, 39 out of 383) but no predicted phage sequences contained ABR genes, suggesting that their transfer would primarily occur by plasmid. Note that all predicted plasmid-borne ABR genes, except for a fusidic acid inactivation enzyme (fusC), showed homology to genes in known plasmids. Only five predicted plasmid segments carried predicted virulence genes (Figure 5A). Overall, the distribution of predicted plasmid-encoded ABR was highly host-specific and skin site-specific (Figure S5C and S5D), further underscoring the biogeographical heterogeneity of S. epidermidis functional features. Predicted plasmid-encoded ABR genes were predicted to confer resistance to at least 15 types of antibiotics (Figure 5B, Table S5), including mupirocin and streptogramin (Figure 5B and Table S5), recently developed antibiotics used specifically to treat Staphylococcus skin infections, raising concerns for the long-term effectiveness of these drugs. Moreover, many predicted plasmid segments encoded resistance against multiple antibiotics (Figure 5B), due to pleiotropy and/or co-presence of ABR genes and mechanisms (Figure 5B and Table S5). For example, we predicted two multi-drug resistance (MDR) plasmid segments, each with three distinct ABR genes targeting three distinct types of antibiotics and observed in only one subject (Figure 5C), respectively.
To validate the functionality of predicted ABR genes, we measured the minimum inhibitory concentration (MIC) of six antibiotics suppressing the growth of 19 selected isolates that possessed different ABR genes (Figure 5D). We found that computational predictions of plasmid-encoded ABR genes were, in general, good predictors of the actual resistance phenotypes (Figure 5D), while chromosomally predicted ABR genes, such as mgrA and norA, often failed to confer similar levels of resistance as the predicted plasmid-encoded ABR genes. An exception was resistance to ciprofloxacin, a fluoroquinolone antibiotic, which is likely endowed by a previously reported mutation in the DNA topoisomerase ParC (D84Y) (Yamada et al., 2008), but not by the predicted chromosomal or plasmid-encoded efflux pumps (Figure 5D). In addition, chromosomally predicted mecA and mecR1 genes that encode and regulate a penicillin binding protein appeared to compound the resistance conferred by the predicted plasmid-encoded beta-lactamase BlaZ (Figure 5D). Finally, isolates 0995 and 1085, harboring an MDR plasmid (Figure 5C, lower) in addition to other resistance genes, exhibited resistance to all six tested antibiotics (Figure 5D, arrows). These results demonstrate the individualization of MDR phenotypes and the association with spread of predicted MDR plasmids.
A common assumption about staphylococcal infections or skin disease is that the etiological agent originated from the patient’s own skin (von Eiff et al., 2001; Kong et al., 2012; Méric et al., 2018; Otto, 2009; Sakr et al., 2018). Thus, understanding the biogeographic distribution of virulence factors and how they are regulated in their respective microenvironment could aid the assessment of infection risk and guide intervention approaches. Similar to other functional features, predicted S. epidermidis virulence genes showed varying prevalence among subjects and skin sites (Figure S6A, PERMANOVA based on Euclidean distance, p<0.001 for both skin site and subject), including a complete absence of the ica operon (icaA, icaB, icaC, icaD and icaR genes, important for biofilm formation) in all toeweb isolates and the majority of isolates from pi (Figure S6A).
An additional regulation of many staphylococcal virulence factors is enforced by the agr quorum sensing system, encoded by the agrABCD operon (Méric et al., 2018; Yarwood and Schlievert, 2003). agr quorum sensing controls the expression of many extracellular virulence factors important for dissemination during acute infection (Fey and Olson, 2010; Olson et al., 2014), while down-regulated agr activity was associated with colonization and persistence (Le and Otto, 2015). The agr system produces an autoinducing peptide (AIP, encoded by the agrD gene, Figure 6A) secreted through AgrB, detected by AgrC, which then activates the response regulator AgrA. Previous studies showed considerable sequence polymorphism in the S. epidermidis agr locus (Olson et al., 2014), with three ‘types’ identified based on the sequence of AgrD. Notably, Olson et al. emphasized the importance of these sequence variations in strain-level competition: one type of AIP can inhibit the agr system of a different type. Therefore, we hypothesized that agr type admixture in the skin could suppress virulence depending on the composition of agr types in the subpopulation.
Figure 6.

Variability at the agr locus and variation in predicted virulence expression. A, novel sequence types of the agrABCD operon and prevalence across the relevant subjects and skin sites. Amino acid sequences of the two novel agrD genes, verified with Pacbio sequencing, are shown. B, quorum sensing interference of agr Type I-III isolates by Type IV supernatant. ddCt values were obtained by subtracting dCT values measured at zero hours from dCT values measured at four hours. *: Welch’s t-test on ddCt values p < .05. **: Welch’s t-test on ddCt values p < 0.01. At least 3 biological replicates were performed for each experiment. C, quorum sensing interference of an agr Type IV isolate by Type I-III supernatant, as in B. D, distribution and dominance type frequency of the three canonical agr types (Type I-III) across subjects and skin sites. E, quorum sensing interference of agr Type I-III isolates by population supernatant generated by mixed cultures, as in B. F, S. epidermidis operons showing significantly lower expression levels with the presence of population supernatant.*: Welch’s t-test on ddCt values p < .05. **: Welch’s t-test on ddCt values p < 0.01. See also Figure S6 and Table S6.
We thus examined agr diversity in the subject isolates. We identified canonical agr sequences as well as agrC transmembrane mutants observed in multiple subjects and skin sites (Figure S6B and Table S6) and two novel agr sequence variants, Type IIIb and Type IV, that had highly restricted subject and skin-site distribution (Figure 6A). While Type IIIb expresses the same AIP as Type III (but with a unique AgrD leader peptide), Type IV expresses a unique AIP, and its supernatant was able to interfere with quorum sensing of Type II and III strains (Figure 6B and Table S6, Welch’s t-test p<0.05), as measured by reduced ecp expression, an agr-regulated protease (Olson et al., 2014). Conversely, when a Type IV isolate was grown with spent media supernatant of Type I-III isolates, no significant difference in ecp expression was observed, potentially due to large variance (Figure 6C and Table S6).
Surprisingly, we identified a strong bias in agr types across individuals (Figure 6D), with p2 isolates consisting predominantly of agr Type I and Type II (adjusted p<10−13) and p4 agr Type I and Type III (p<10−20). At the same time, admixture of agr types within subpopulations was very common (Figure 6D). To examine the functional consequence of different levels of agr admixture, we measured ecp expression levels when an isolate was exposed to a mixed supernatant from isolates reflecting real-world admixed populations (‘population supernatants’). As agr types existed in various proportions on human skin (Figure 6D), population supernatants were correspondingly created with different proportions of agr types. Strikingly, across all agr types, when combined with nearly all population supernatants, ecp expression was significantly reduced compared to the self-supernatant control (Figure 6E and Table S6), indicating that real-world strain admixture can reduce quorum sensing and potentially population virulence.
As agr quorum sensing can define the functional state of a population by controlling diverse biological processes from basic metabolism to virulence and pathogenesis, we asked how admixture of agr types in natural populations can affect the functional profile of strains in that population. Exposure of an agr Type I isolate to population supernatant significantly altered expression levels of a variety of operons and pathways, including metabolic gene expression, as measured by RNA-seq (Figure 6F, S6C, and Table S6). Consistent with previous reports (Batzilla et al., 2006; Queck et al., 2008; Yao et al., 2006), genes involved in nitrogen metabolism and urease activity were downregulated in the presence of population supernatant, while pathways involved in carbohydrate metabolism were upregulated (Figure 6F, S6C, and Table S6). Contrasting with a previous study (Batzilla et al., 2006), we found that genes involved in sulfur metabolism were down-regulated with population supernatant (Figure 6F and Table S6), underscoring potential strain-specific effects. Interestingly, we also identified changes in the expression of potential virulence factors in an admixed population. For example, expression of the pmt locus was suppressed when exposed to population supernatant (Figure 6F and Table S6). pmt is responsible for the export of phenol-soluble modulins (PSMs), a major staphyloccal virulence factor (Cheung et al., 2014; Wang et al., 2011). Genes involved in iron uptake – fecD, feuC, fecE, yclQ – were also downregulated in the presence of population supernatant (Figure 6F and Table S6). While iron acquisition’s role in virulence has been extensively studied (Oliveira et al., 2017; Trivier and Courcol, 1996; Trivier et al., 1995), to our knowledge, its association with quorum sensing has not yet been demonstrated in S. epidermidis, although an association with cell density has been discussed (Matinaho et al., 2001). By our experimental simulation of real-world admixed populations, we demonstrated that reduction of predicted virulence factors by quorum sensing interference is at least one functional consequence of strain heterogeneity and could potentially aid S. epidermidis’ survival as a skin commensal or persistence as a pathogen.
S. epidermidis gene content is influenced by the local skin microbiota
Interspecies interactions with the contextual microbiota may also shape S. epidermidis strain genetic diversity via metabolic potential, resource competition, or antimicrobial activity. We thus analyzed metagenomic shotgun data obtained as matched samples with the isolates. Consistent with our previous reports (Oh et al., 2014, 2016), the healthy skin microbiome is characterized by a remarkable biodiversity across hosts (Figure S7A, Table S7) and skin sites (Figure S7B, Table S7). Using a generalized linear model, we found 8 S. epidermidis genes (out of 1130 genes filtered based on abundance, variation, and sparsity) significantly associated with microbial taxonomic composition (Figure 7A, adjusted p<0.05 for unrestricted permutation and permutation restricted within subject/subjectxskin site), which was represented by three principle components that explained 82% of the variation. For example, polyphosphate kinases are important for synthesizing polyphosphate, which is needed for bacterial survival under stress conditions (Zhang et al., 2002). ccrB is involved in the integration and excision of HGT elements (Wang and Archer, 2010), suggesting a linkage between population-level resistance prevalence and the contextual microbiome. pnbA is linked with beta-lactam production in Bacillus (Zock et al., 1994), although its function in staphylococci has not been fully studied. Despite these diverse functional associations to microbiome species abundances, no S. epidermidis gene showed significant association with microbiome gene abundances (Figure S7C and S7D), potentially because of low power due to small sample size relative to the large number of S. epidermidis genes tested.
Figure 7.

Association of S. epidermidis gene prevalence with contextual environment. A, S. epidermidis genes whose prevalences were significantly associated with at least one of the principal components that described microbiome composition. B, function and plasmid association of the microbiome-dependent S. epidermidis genes. The COG functional categories (upper) of the top 20 genes that had the greatest increase in predictability when including skin site specification or microbiome features are shown, as well as their presence in predicted (via PlasFlow) and known (via PLSDB) plasmids (lower). See also Figure S7 and Table S7.
Another fundamental question in human microbiome research is how much of microbiome features at the population level—both genetic diversity and ecological interactions—is host-specific vs. generalizable to different hosts. We created a machine learning model (Figure S7E) to study skin site and microbiome features (in subjects p0, p1, p2, and p4) that increase S. epidermidis gene predictability in a new host (subject p3). Prevalence of many genes in the new host can be predicted without any site or microbiome information (Figure S7F, genes with high “prior” predictability), representing genes with similar prevalence (i.e., low variability of prevalence in Figure S7F) at all skin sites in all subjects (e.g., core genes encoding universal functions).
Other genes showed increased predictability when including skin site and microbiome information (Figure S7G and S7H), potentially indicating a role in environmental specialization or interspecies dynamics. The biological functions of the top 20 such genes were largely unknown and showed limited consistency (Figure 7B, upper), but most were present in predicted plasmid segments (Figure 7B, lower). Additionally, over half (52.9% and 52.6%) of these predicted plasmid-associated genes also have homologs observed in previously identified plasmids (Figure 7B lower). An important conclusion from this analysis is thus that features associated with skin niches and the surrounding microbiome consistently influence S. epidermidis mobile elements, and therefore HGT is contingent on the state of the contextual environment.
Discussion
Here, we report the first in-depth survey of within-individual, population-level diversity in the human skin microbiome. We previously hypothesized, using limited metagenomic inferences, that phylogenetically diverse strains could coexist in the skin (Oh et al., 2014). In an extensive genomic and metagenomic survey of 1482 isolates cultivated from healthy skin, we conclusively demonstrated that each subject was colonized by diverse S. epidermidis strains from both dominant phylogenetic clades identified in the initial assessments of S. epidermidis phylogenetic variation (Conlan et al., 2012). Here, we deeply probed host-specificity, skin site specialization, and evolutionary and demographic events to provide new insights into the spatio-temporal diversity and function of a commensal skin bacteria. A key finding of our study is the extensive within-individual variation of S. epidermidis at the population level. While our approach can be generalized to understand population diversities of other human-associated bacteria, we believe that biological dynamics will be individual, body-site, and microbe-specific and must be interrogated as such. For example, the within-individual evolution of S. epidermidis differs substantially from a gut microbe, B. fragilis. The within-host S. epidermidis isolates maintained the genetic variation of multiple colonizing lineages, while within-host B. fragilis only represented a single colonizing lineage (Zhao et al., 2019). This suggests that a diverse pool of S. epidermidis founder strains is maintained in the environment and subsequently colonizes healthy individuals. Two fundamental questions that follow are: 1) how is the polymorphism of founder lineages maintained in the environment? and 2) how is a diverse set of founder strains transmitted to each individual? We speculate that both questions could be explained by the fact that the major reservoir of S. epidermidis is the mammalian skin, which includes various environmental niches within one individual. Multiple-niche polymorphism is known to maintain diversity in natural populations (Brisson, 2018; Brisson and Dykhuizen, 2004; Dobzhansky, 1982), and could increase the exposure of a recipient to multiple founder strains simultaneously. On the other hand, it is also possible that different lineages of B. fragilis are maintained in an individual, but are not identified because bacteria occupying certain gut niches are known to be underrepresented in fecal samples (Zmora et al., 2018).
The prevalence of S. epidermidis gene content and other genetic features exhibited marked skin site-specificity, suggesting functional specialization to the niche. For example, the unique population structuring of toeweb isolates, which possessed distinct gene contents and functional features irrespective of host, could be due to both a lack of gene flow because of low transmission rates, and niche adaptation. Although the number of subjects in our study is limited and therefore the generality is unclear, the observed convergence suggested purifying selection at the toeweb, and adaption of the toeweb subpopulation to the toeweb niche. If the purifying selection at the toeweb is rapid and strong enough, a distinct subpopulation could be formed even without ecological isolation, albeit this hypothesis is less parsimonious than ecological isolation. An interesting corollary to these findings is the ecology of other toeweb microbes, which could face similar evolutionary pressures. For example, based on metagenomic inference, Cutibacterium acnes may also have phylogenetically distinct strains that are associated with the toeweb (Oh et al., 2014). On the other hand, clinically important features of S. epidermidis, including ABR and predicted virulence genes, were strongly host-specific and showed dynamic HGT between skin sites, including predicted ABR-encoding plasmids. This provides strong support for pathogen carriage and increased infection risk elsewhere in the body, such as of methicillin-resistant S. aureus in the nares (von Eiff et al., 2001; Kong et al., 2012; Sakr et al., 2018), as well as for the contextual microbiome affecting infection risk via HGT of pathogenicity reservoirs.
In addition to ABR, we found that the distribution of agr types, including two novel types, was highly host-dependent. A key observation was the substantial admixture of multiple agr types, which significantly repressed quorum sensing in vitro and consequently altered expression of a variety of biological functions from metabolic control to virulence. Indeed, clinically, admixture of agr types might represent a mechanism by which virulence could be suppressed at the population level (vs. gene-level mechanisms such as the absence of predicted virulence factors, which may be the case in foot isolates, or physical factors such as low cell density, which may contribute at other skin sites). If population bottlenecks occur such that a single agr type becomes dominant in a subpopulation, increased expression of virulence genes could then facilitate acute infection. This hypothesis would also account for the inability of genomic studies on S. epidermidis to date (Conlan et al., 2012; Méric et al., 2018) to identify clear determinants of pathogenicity among nosocomial and commensal isolates.
Recent developments in metagenomic analyses have used SNP-based haplotypes to infer strains from shotgun metagenomic data, either by reconstructing the dominant strain haplotype (Truong et al., 2017), or by phasing SNPs under a probabilistic model (O’Brien et al., 2014; Quince et al., 2017; Smillie et al., 2018). Despite their reported applications to resolving individual-specific strain diversity (Segata, 2018; Tett et al., 2017; Zhang and Zhao, 2016) and tracking strain transmission between individuals (Asnicar et al., 2017; Brito and Alm, 2016; Ferretti et al., 2018; Smillie et al., 2018; Yassour et al., 2018), these methods are limited by sequencing depth (which makes them unsuitable for low abundance species), restricted to a few marker gene regions (which decreases phylogenetic resolution), and insensitive to haplotypes with few SNP differences (and thus limited in the ability to resolve closely related genomes). This latter is particularly limiting as differentiating sister isolates with 0 SNP differences would be impossible. Nonetheless, we found that such sister isolates were exceptionally informative. This is because sister isolates likely have diverged very recently from the same parental lineage. Thus, sister isolates detected at different skin sites likely denote transmission events, while sister isolates with different gene content likely denote divergence by either gene loss or HGT. Indeed, a comparison of the identified sister isolates not only revealed recent transmission events, but also differential gene content with a range of biological functions between sister isolates. Additionally, we found that many of the differential genes were clustered on predicted mobile-element-like elements, suggesting that HGT dynamically contributes to the divergence of sister isolates. Put together, the ability to resolve sister isolates for functional and demographic inferences represents an important advantage of isolate WGS over metagenomic-based approaches.
On the other hand, metagenomic sequencing characterizes the microbial macroenvironment of the S. epidermidis isolates and can shed light on how environmental selection influenced their evolution. We identified multiple accessory genes of S. epidermidis whose prevalence was significantly associated with features of the contextual microbiome. In addition, we also found that some of the ecological interactions between S. epidermidis genes, especially mobile genes, and the contextual microbiome could be generalized to new hosts. This finding suggested that it may be possible to infer strain-level functional differences, including infection predilection, based on skin microbiome features of the host. We note that this possibility could be valuable to many other microbes where large scale culturomics are challenging due to the lack of well-defined, selective culturing conditions or screening/characterization methods.
Nonetheless, we note several limitations of these inferences, and of an approach such as ours more generally. First, due to sequencing depth and technical limitations in pooled metagenomic assembly, a reconstructed metagenomic gene catalog will not fully reflect coding potential of the contextual microbiome. Second, although within-host diversity was well-captured by our dataset, such randomly sampled isolates are inevitably an incomplete representation of the corresponding subpopulations and the small number of recruited subjects, hindering the detection of sister isolates and decreasing the confidence in estimated transmission probabilities. This may be particularly relevant for S. epidermidis, whose subpopulations may frequently experience dynamic perturbations in the skin, resulting in population bottlenecks and consequently, genetic drift (all the while on the community scale, skin microbiome composition is relatively stable (Oh et al., 2016)). The presence of population bottlenecks is suggested by the lack of bilateral symmetry in both the transmission patterns, gene content diversity, and the temporal fluctuations patterns. A deeper sampling of each skin site and a denser time series will likely improve characterization of such demographic dynamics. Additionally, while we believe that the underlying evolutionary mechanisms that shaped the population diversity will be generalizable to other subjects and even other skin microbes, the generality of the ecological and functional interactions found in these subjects could be limited given the large degree of host-specificity. Third, the ability to make meaningful functional inferences from our findings will require a more comprehensive characterization of gene functions (although here, computational predictions of plasmid-encoded antibiotic resistance genes were largely consistent with experimental validation). In short, to extend our ability to make biologically and clinically relevant predictions, continued large-scale screening of strain-level functions and a detailed, well-balanced, and variety-aware dataset will be needed.
STAR methods
LEAD CONTACT AND MATERIALS AVAILABILITY
Further information and requests for materials, reagents, and software should be directed to and will be fulfilled by the Lead Contact, Julia Oh (iulia.oh@iax.org).
S. epidermidis isolates collected in this study are available upon reasonable request.
EXPERIMENTAL MODEL AND SUBJECT DETAILS
5 healthy males and females aged between 20–60 years were recruited to this study, which was approved by the Jackson Laboratory Institutional Review Board. Due to the limited sample size, we do not report specific ages or genders to protect confidentiality. Exclusion criteria included any visible signs of non-intact skin at sites of sampling, use of systemic antibiotics or antifungals within 3 months prior to enrollment, or topical retinoids, steroids, or antibiotics within 1 week prior to enrollment. Sixteen skin sites (Table S1) were swabbed rigorously using PurFlock Ultra buccal swabs (Puritan Medical Products) for thirty seconds before the swab was submerged into 500μl Tryptic Soy Broth (TSB) culture media (Thermo Fisher Scientific). The same swab was used for both the isolation of S. epidermidis and mWGS sequencing. For the isolation of S. epidermidis, 50–100μl of the culture were plated onto SaSelect culture plates (Bio-Rad Laboratories) and incubated at 37°C for 24 hours. Small and light pink colonies (Hirvonen et al., 2014) were picked randomly from the plates and verified on the MALDI Biotyper system (Bruker Corporation) according to the manufacturer’s instructions. In general, from each skin swab, we aimed at obtaining ~10 colonies annotated as “S. epidermidis” by the Biotyper, which were subsequently inoculated into 1.5 mL TSB and grown overnight for DNA extraction.
METHOD DETAILS
DNA extraction
Rapid DNA extraction from S. epidermidis isolates were adapted from Köser et al. (2014). 1 mL of overnight culture was centrifuged at 20,000 × g for 1 minute before the bacterial pellet was resuspended with 100 μL of 1X TE and transferred to a 2 mL bead beating tube with 100–125 μL 0.5 mm diameter glass beads (BioSpec Products). An additional 100 μL of 1X TE was added to the tube, followed by vortexing of the sample for 30 seconds at max speed (3000 rpm) on a Vortex Adapter (Mo Bio Laboratories). The mixture was then centrifuged at 13,000 × g for 5 minutes to pellet the cellular debris, and the supernatant was transferred to a new tube to be used as template for Nextera XT library preparation.
For the extraction of metagenomic DNA, a skin swab was placed into a microfuge tube containing 350 μL Tissue and Cell lysis buffer (Epicentre) and 100 μg 0.1 mm zirconia beads (BioSpec Products). Metagenomic DNA was extracted using the GenElute Bacterial DNA Isolation kit (MilliporeSigma) with the following modifications: each sample was digested with 50 pg of lysozyme, and 5 units lysostaphin and mutanolysin for 30 minutes prior to beadbeating in the TissueLyser II (QIAGEN) for 2 × 3 minutes at 30 Hz. Each sample was centrifuged for 1 minute at 15000 × g prior to loading onto the GenElute column. Negative (environmental) controls and positive (mock community) controls were extracted and sequenced with each extraction and library preparation batch to ensure sample integrity.
Library preparation and sequencing
All sequencing libraries were made according to the Illumina standardized protocol using the Nextera XT DNA sample preparation kit (Illumina Inc.). All DNA samples were quantitated by Qubit HS (Thermofisher Scientific) and diluted to 1ng/pl. The dual indexed paired-end libraries of genomic DNA were made with an average insert size of 400bp by taking 200pg DNA of each sample in optimized quarter reaction protocol, where all reagents for library preparation were taken in 1/4th amount. Tagmentation and PCR reactions were carried out according to the manufacturer’s instructions. The resulting Nextera WGS libraries were then sequenced with 2×150bp paired end reads on an Illumina HiSeq2500.
Genome assembly and quality filtering
Sequencing adapters and low quality bases were removed from the sequencing reads using scythe (v0.994) (Buffalo) and sickle (v1.33) (Joshi and Fass), respectively, with default parameters. Filtered sequencing reads were then assembled using SPAdes (v3.7.1) (Bankevich et al., 2012), with default parameters. We took a series of strategies to remove low quality samples or contigs. First, draft genomes with sizes smaller than 2.2 Mbps or larger than 2.9 Mbps – sizes unlikely for S. epidermidis (genome sizes of 50 public S. epidermidis genomes in the VCU and NIH collection ranged from 2.3 – 2.8 Mbps [Table S2]) – were removed from the dataset. Second, qualities of the remaining draft genomes were checked using QUAST (v4.2) (Gurevich et al., 2013) by aligning to a S. epidermidis reference genome (strain ATCC12228, ACC#: GCA_000007645); draft genomes with a reference coverage of lower than 85% were removed from the dataset (“genome fraction” in the QUAST output; reference coverages of 50 public S. epidermidis were all higher than 86%). Third, contigs with lower than 10X coverage, which contained potential contaminations based on taxonomic classification using Kraken (v0.10.6) (Wood and Salzberg, 2014) (Figure S1), were removed from the draft genomes. Finally, sample purity was checked by mapping sequencing reads back to the draft genomes using Bowtie2 (v2.3.1) (Langmead and Salzberg, 2012; Langmead et al.), and calling SNPs at sites with at least 10X coverage using bcftools (v1.8) and samtools (v1.8, vcfutils) (Li, 2011; Li et al., 2009). Samples with >10 sites having>0.5 allele frequencies of the variant alleles, which strongly indicated an admixture of S. epidermidis isolates, were removed from the dataset.
To validate the sequencing and quality filtering methods, S. epidermidis strain ATCC12228 was sequenced, assembled and quality filtered as described above, and aligned to its published complete genome sequence (GCA_000007645) using QUAST (v4.2) (Gurevich et al., 2013). 99.2% of the bases in the resulting draft genome (2.54 Mbps in 95 contigs, N50=71,627) were aligned to the complete reference genome, representing 98.0% of the reference genome (“genome fraction” in the QUAST output), with a mismatch ratio of 0.01%. Out of the five contigs (18,932 bps in total) unaligned to the reference genome, four (17,931 bps in total) were mapped to plasmids in S. epidermidis strains PM221 and FDAARGOS_153 (84% alignment coverage and 96% nucleotide sequence identity with BLASTN (Altschul et al., 1990), while the other contig (1001 bps) was mapped to Staphylococcus felis (98% alignment coverage and 81% nucleotide sequence identity with BLASTN). The unaligned regions could represent plasmid discrepancies in our ATCC12228 strain stock and the stock sequenced to generate the complete genome, which was observed between two complete sequences of ATCC 12228 (MacLea and Trachtenberg, 2017; Zhang et al., 2003).
Time calibration ofphylogenetic tree and inference of transmission events
Within-host evolutionary histories - including the time-calibrated phylogenetic trees and transmission events of all isolates from each of the five subjects - were inferred using BEAST (v1.8.4) (Suchard et al., 2018) based on the core-genome alignment constructed using Parsnp (v1.2) (Treangen et al., 2014). Although the evolutionary dynamics of S. epidermidis has not been studied extensively, its close relative, Staphylococcus aureus, does exhibit a clock-like evolution (as an example, see Frisch et al., 2018). Therefore, we assumed that core-genome nucleotides of individualized S. epidermidis isolates change under a strict clock model implemented in BEAST, with nucleotide substitution rate modeled using the Generalized time reversible (GTR) model and uniform mutation rates across branches. As a validation, the mutation rates (nucleotide changes per Mbps per year) inferred based on the model (3.47±1.21 for p0, 1.47±0.68 for p1, 2.27±0.54 for p2, 0.62±0.48 for p3, and 1.42±0.52 for p4) were on the same scale with the estimated mutation rate of Staphylococcus aureus (Duchene et al., 2016) (the mutation rate of S. epidermidis has not been estimated).
Previous studies have demonstrated that high rates of genome recombination (e.g. with a population-scaled recombination rate close to 1%) can influence demographic inference, while correction by removing homoplastic sites may even exacerbate the inference (Hedge and Wilson, 2014). Therefore, we estimated the population-scaled recombination rate using ClonalFrameML (v1.11) (Didelot and Wilson, 2015) with default parameters and a maximum-likelihood starting phylogeny constructed using RAxML (v8.2.12) (Stamatakis, 2014), under the GTRCAT mode. The estimated population-scaled recombination rate was low (0.14%), therefore we proceeded to infer demographic parameters based on whole genome population genetics.
A coalescent tree prior was used with population sizes estimated based on a flexible Bayesian skyline plot (Drummond et al., 2005) with 10 windows. The prior probabilities of the population sizes in each window were assumed to be uniformly distributed between 0 and 10100. Transmission between sites were estimated using a Bayesian discrete phylogeographic approach (Lemey et al., 2009) with symmetric transmission rates between each pair of skin sites. The approach reconstructed the skin site classification of ancestral nodes in the phylogeny using a standard continuous-time Markov chain, and “transmission” was consequently defined as the change in skin site classification along the phylogeny. Bayesian stochastic search variable selection (BSSVS) procedure was applied to limit the transmission rate parameters to only those that adequately explain the transmission process (Lemey et al., 2009). Finally, BEAST simultaneously infers all of the above evolutionary parameters using Markov Chain Monte Carlo (MCMC). To visualize transmission on a phylogeny, the maximum clade credibility tree was reconstructed using Treeannotator (v1.8.4) (Suchard et al., 2018) included in the BEAST package. Skin site classifications, along with the posterior probability, were mapped onto the phylogeny, and the final phylogeny was visualized as a cladogram using FigTree (v1.4.3) (Rambaut). To summarize the BSSVS results using a transmission map, the log file of BSSVS was analyzed using SpreaD3 (v0.9.6) (Bielejec et al., 2016). Transmission routes with posterior probabilities lower than 0.3 were removed, and the resulting transmission map was visualized using the D3 renderer in SpreaD3.
To assess the consistency of the transmission inference and validate the convergence of MCMC, we first ran two independent MCMC chains based on strains isolated from p0 (n=460) for 500,000,000 and 50,000,000 generations, respectively. Each MCMC chain was sampled every 25,000 generations, with the first 800 samples removed as burn-in. As the transmission maps inferred by the two chains were highly consistent (Figure S2D), strain transmission of p1-p4 was inferred based only on MCMC chains run for 50,000,000 generations.
Pan-genome and core-genome identification
Gene coding sequences were predicted from the isolate genomes using Prokka (v1.11) (Seemann, 2014) with kingdom=Bacteria and genus=Staphylococcus. The pan- and core-genomes were identified from the predicted gene coding sequences using the Roary pipeline (v3.11.2) (Page et al., 2015) at 80% identity threshold. The pan-genome and core-genome accumulation curves were computed with 10 iterations. A dendrogram demonstrating the clustering of isolate gene content (Figure 3C) was plotted using Figtree (v1.4.3) (Rambaut) based on the accessory gene presence-absence matrix (the accessory_binary_genes.fa.newick output from Roary). The core-genome alignment and SNP-based approximately-maximum-likelihood phylogeny were constructed using Parsnp (v1.2) (Treangen et al., 2014) with the reference genome randomly picked from the dataset (parameter -r !).
Prediction of recombination
Population-scaled recombination rate was estimated using ClonalFrameML (v1.11) (Didelot and Wilson, 2015) as described above. RDP4 (beta 4.97) (Martin et al., 2015) was used to analyze the genome-wide recombination patterns. 50 representative subject isolates were selected by dividing the full phylogenetic tree into 50 clusters (mean cophenetic distance within each cluster = 0.004±0.008, generated using the cutree function in R) and randomly selecting one isolate from each cluster (the selected isolates were specified in Table S1). Core-genome alignment was then constructed for the 50 representative subject isolates using Parsnp (v1.2) (Treangen et al., 2014) as described above. The alignment was then processed using RDP4 using six different algorithms (RDP (Martin and Rybicki, 2000), GENECONV (Padidam et al., 1999), Bootscan (Martin et al., 2005), Maxchi (Smith, 1992), Chimaera (Posada and Crandall, 2001), and 3Seq (Lam et al., 2018)) with default parameters to identify recombination events. Finally, recombination events that were identified by at least two methods were reported. The analyses were conducted with 50 representative isolates instead of the full dataset because 1) similar genome sequences (such as those within each of the 50 clusters) will have relatively low power in recombination detection, and 2) RDP4 compares all triplet combinations within a dataset to detect recombination signals and therefore takes polynomial time with respect to the number of genome sequences.
Significance of differential genes among sister isolates
Pairwise nucleotide differences between sister isolates were computed between sister isolates using MUMMER (DNAdiff, v1.3) (Kurtz et al., 2004). Differential genes were defined as gene clusters identified using the Roary pipeline (v3.11.2) (Page et al., 2015) that were only present in a subset of sister isolates but absent in the others. The significance (p-value) of a differential gene – the likelihood that the gene cluster was not found in a subset of sister isolates solely due to genome incompleteness – equals the joint probability that every sister isolate in that subset was incomplete. The incompleteness of the isolate genomes was estimated based on the presence or absence of lineage-specific marker genes using the default lineage_wf work flow in CheckM (v1.0.12) (Parks et al., 2015). The resulting p-values were adjusted following the Benjamini-Hochberg procedure.
Prediction and analysis of phages and plasmids
Phage sequences were identified from the draft genomes using PHASTER (Arndt et al., 2016). Sequences annotated as “intact” phages were then clustered at 0.9 DNA sequence similarity using CD-HIT (local alignment with alignment coverage threshold of the shorter sequence=0.9) (Fu et al., 2012; Li and Godzik, 2006) to remove highly similar sequences. A dendrogram of the predicted phage sequences was generated based on the accessory gene presence-absence matrix (the accessory_binary_genes.fa.newick output from Roary), as the predicted phage sequences lacked colinear regions.
Plasmid candidates were predicted and filtered using multiple criterions. First, mobile-element-like contigs were identified from all contigs (>1kb) in the 1482 draft genomes using PlasFlow (v1.1) (Krawczyk et al., 2018) - an artificial neural network-based plasmid prediction approach using sequence base compositions as features. Mobile-element-like contigs were then clustered at 0.9 DNA sequence similarity using CD-HIT (local alignment with alignment coverage threshold of the shorter sequence=0.9) (Fu et al., 2012; Li and Godzik, 2006) to remove highly similar contigs. For increased confidence, we focused on contigs with at least 5kb of length in this study. The predicted plasmid segments were then screened to remove potential chimeric sequences: first, sequencing reads of the 1482 S. epidermidis isolates were mapped to the candidate plasmid segments using Bowtie2 (v2.3.1) (Langmead and Salzberg, 2012; Langmead et al.) and the coverage of each candidate was computed using Samtools (v1.8, used for samfile to bamfile conversion and sorting) (Li et al., 2009) and Bedtools (v2.27.0, genomecov function) (Quinlan and Hall, 2010). A non-chimeric plasmid segment would likely have either close to 0% or close to 100% of its sequence covered in a S. epidermidis isolate, depending on whether the segment is present or absent in that isolate. For simplicity, candidate plasmid segments with breadths of coverage greater than 80% or lower than 20% in over 90% of the isolates were selected for downstream analyses.
Similarity of the predicted plasmid segments to known plasmids was estimated by first aligning the predicted plasmid segments to the PLSDB plasmid database (release 2018_12_05) (Galata et al., 2019) using dc-megablast (blastn 2.6.0+) (Altschul et al., 1990; Zhang et al., 2000), and then computing the total alignment length to the best-hit plasmid in PLSDB. Clusters of predicted plasmid segments were detected by first hierarchically clustering (the “hclust” function in R by euclidean distance) the predicted plasmid segments based on their prevalence across subpopulations, and then pruning the resulting dendrograms using the “cutreeDynamicTree” function in R package dynamicTreeCut (v1.63.1) (Langfelder et al., 2008) (using the “hybrid” method and deepSplit=4).
Alternatively, to identify contigs that represent segments of known plasmids, we aligned all S. epidermidis contigs to the PLSDB plasmid database (release 2018_12_05) (Galata et al., 2019) using dc-megablast (blastn 2.6.0+) (Altschul et al., 1990; Zhang et al., 2000) and identified contigs that had an alignment coverage greater than 75%. These contigs were then clustered at 0.9 DNA sequence similarity using CD-HIT (local alignment with alignment coverage threshold of the shorter sequence=0.9) (Fu et al., 2012; Li and Godzik, 2006) to remove highly similar contigs. Next, sequencing reads of the 1482 S. epidermidis isolates were mapped to the contigs using Bowtie2 (v2.3.1) (Langmead and Salzberg, 2012; Langmead et al.) and the coverage of each contig was computed using Samtools (v1.8, used for samfile to bamfile conversion and sorting) (Li et al., 2009) and Bedtools (v2.27.0, genomecov function) (Quinlan and Hall, 2010). A predicted plasmids contig with a breadth of coverage over 80% in an isolate were considered present in that isolate.
Annotation of COG categories and KEGG modules
COG functional categories were annotated using the eggNOG-mapper (v4.5.1) (Huerta-Cepas et al., 2016) with default options to prioritize sensitivity. Additional analyses of the unannotated toeweb genes were conducted by searching against the Pfam database (El-Gebali et al., 2019) using HMMER web server (Potter et al., 2018), and conducting enzyme EC number prediction using ECPred (Dalkiran et al., 2018). To annotate KEGG modules and compute module representation, gene sequences were first aligned to a downloaded prokaryotic KEGG gene database (release 2015–08-31) (UBLAST (Edgar, 2010) with an e-value threshold of 10−9 and sequence identity cut-off of 0.5). Next, KEGG ortholog numbers (KO numbers) were assigned to the gene sequences using the ko_genes.list mapping file included in the downloaded KEGG gene database. Finally, the representation of KEGG modules was given by the proportion of KOs in each KEGG module that were found in a given genome, based on the ko_module.list mapping file. The KOs that had differential prevalence among subjects or skin sites were identified using ANOVA, with p values estimated using unrestricted permutation and adjusted under the Benjamini-Hochberg procedure.
Annotation of virulence factors and ABR genes
Known virulence factors were annotated by blasting gene sequences against the Staphylococcus-specific genes in VFDB (Chen et al., 2016), with the addition of four phenol-soluble modules (sequences based on Otto et al. (2004)), using UBLAST (USEARCH v8.0.1517) (Edgar, 2010) with an expect value (e-value) threshold of 10-9. ABR genes were annotated using the Resistance Gene Identifier (RGI, v4.2.2) based on the CARD database (v3.0.1) (Jia et al., 2017), with the low_quality mode and plasmid data-type. Presence of homologs of ABR genes in known plasmids were estimated by aligning the genes to the PLSDB plasmid database (release 2018_12_05) (Galata et al., 2019) using dc-megablast (blastn 2.6.0+) (Altschul et al., 1990; Zhang et al., 2000) and identifying the best-hit alignment. Genes with sequence identity greater than 70% and coverage greater than 75% over the gene length were considered having homologs in known plasmids.
Annotation of BGCs
BGCs were identified using antiSMASH (Weber et al., 2015) with default parameters.
MIC test of selected antibiotics and isolates
Appropriate stock concentrations of selected antibiotics were prepared in TSB medium. Serial dilutions were made using TSB medium in a 96-well cell culture plate. Overnight cultures of selected S. epidermidis isolates were diluted in TSB medium and about ~105 cells were added to each well. The plate was incubated on a shaker at 37°C for 18 hours and the growth of cells were determined by measuring the OD600.
Annotation and validation of agr sequences
The agr genes (agrA, agrB, agrC, and agrD) were annotated by blasting all genes in the subject isolates (predicted using Prokka v1.11 (Seemann, 2014)) to the three canonical types of agr sequences as described in Olson et al. (2014). Specifically, the agr gene sequences annotated in strains NIHLM095 (GCF_000276545.1), NIHLM061 (GCF_000276445.1), and NIHLM037 (GCF_000276325.1), were used as reference sequences for agr type I, II, and III, respectively. An agrABCD operon was assigned to one of the three canonical agr types if 1) the AIP was identical to one of the three AIP types as described in Olson et al. (2014), and in the same time 2) the agrB and agrC genes had the highest sequence similarity to the same agr type as the AIP. The identified agr gene sequences were assigned to one of the three types based on the best match. The secondary structure of the AgrC protein was predicted using the Jpred 4 web server (Drozdetskiy et al., 2015) with default options.
Transmembrane mutations in agrC genes were validated in five selected isolates (isolate ID=644, 700, 1026, 1203, and 1523, which represented the five mutation patterns shown in Figure 7B) using Sanger sequencing with primers S_epi_dupagrC_uni-F (CTGGAATTATAATCCTTTCTGC, forward) and S_epi_dupagrC_uni-R (GTAATCTGAAAGAGTGGTGAG, reverse) for all isolates except 0644 for which the forward primer was replaced with S_epi_dupagrC_66-F (TACGATTGTAATCCCTTCTGC, forward). Products of ~640 bp were purified and Sanger-sequenced.
For Pacific Biosciences SMRT sequencing, genomic DNA was extracted using GenElute Bacterial Genomic DNA Kit (Sigma-Aldrich) from pelleted bacterial cells from 0.5 ml of overnight cultures with the addition of lysostaphin (Sigma-Aldrich) according to the manufacturer’s protocol. DNA was sheared using a Megaruptor (Diagenode) to produce fragments with an average size of 6–8 kbp and further purified by binding to 0.45x AMPure beads. Sequencing libraries were prepared using SMRTbell Template Kit (PacBio) with barcoded SMRTbell adapters (PacBio). The resulting libraries were pooled for sequencing on a single SMRT cell on the Sequel system.
Analyses of quorum sensing interference
To determine the effect of mixture of agr types in natural populations on quorum sensing, six isolates of different agr types (isolate 71 and 73 for Type I, 72 and 74 for Type II, and 78 and 79 for Type III), found at the same skin site in the same subject (right index in p0), were chosen to simulate a isolate composition in a natural population. The six isolates were grown individually and the supernatant of these cultures were mixed to simulate naturally-occurring populations. To account for influences of the relative abundances of the isolates, the following population supernatants were created: 1) Evenly mixed population supernatant: overnight culture from each of the six isolates was spun down, filter sterilized, and mixed in equal volume, and 2) population supernatant with the dominance of a single agr type: overnight culture from each of the six isolates was spun down, filter sterilized, and mixed such that the dominant agr type isolate supernatants composed 80% of the final volume and the supernatants from the remaining four isolates composed 20% of the final volume, equally). Next, the expression levels of ecp in three isolates representing three agr types (isolate 71 for Type I, 72 for Type II, and 78 for Type III) when exposed to self and the population supernatants were determined using RT-qPCR. Additionally, to illustrate the effect of agr type mixture on global gene expression, we performed RNA-seq on a randomly chosen isolate (isolate 71) grown in self supernatant, no supernatant, and evenly mixed population supernatant. As controls, self-supernatants were diluted to the concentration of that agr type in the population mixture.
To investigate whether the newly identified Type IV agr can interfere with the quorum sensing of canonical agr types (Type I-III), agr isolates of Type I-III were grown separately either in the presence of Type IV spend media supernatant (from isolate 0644) or without the addition of any supernatant. Conversely, to test conditions that can potentially influence the quorum sensing of Type IV agr, an agr Type IV isolate (isolate 0644) was grown in the presence of Type I-III supernatant, without additional supernatant, or with self-supernatant, respectively. After the growth assays, the expression levels of ecp were determined using RT-qPCR.
Growth assays for all of the RT-qPCR and RNA-seq experiments were performed as following: One isolate of each agr Type I-IV (isolate 71, 72, 78, and 0644) was grown individually overnight, back diluted 1/100 in TSB, grown to an OD600 of ~ 0.8, and back-diluted again to a starting OD600 of 0.05 in TSB with 10% supernatant by volume. No supernatant controls were grown in 100% fresh TSB. Sampling was performed at the start of the assay: aliquots were spun down, resuspended in Trizol, and froze at −80 C prior to RNA extraction for a zero-hour time point. The cultures were grown for four hours at 37 C and sampling was performed again, as described above. The experiment was performed with biological triplicates.
RNA extraction, RT-qPCR and RNA-seq
Cultures were mechanically lysed in Trizol via bead-beating with 0.1mm glass beads and RNA was isolated using a combination of Trizol/chloroform and on-column isolation using the Qiagen RNeasy Kit. Briefly, chloroform was added to the lysate, spun down, and the RNA in the organic layer was precipitated with 70% ethanol prior to washing (RW1 and RPE buffers, according to kit instructions) and elution on the RNeasy column. According to kit instructions, on-column DNAase was performed with the Qiagen RNase-free DNase kit. RNA concentration was measured via Qubit and the quality assessed via Agilent Tapestation. For RT-qPCR experiments, RNA was normalized and reverse transcribed into cDNA (Applied Biosystems High Capacity cDNA Reverse Transcription Kit). RT-qPCR was performed using the SYBR Power UP kit with ecp as the target gene and ftsZ as an internal control, according to kit instructions. For RNA-seq experiments, RNA was prepared for sequencing using the NEBNext rRNA Depletion Kit (Bacteria) (pre-release) and NEBNext Ultra II Directional RNA Library Prep Kit for Illumina kit according to kit instructions and sequenced on the Illumina NextSeq to a depth of 4–9.5 million reads.
Comparison of transcript levels
For RT-qPCR, each growth assay was performed in biological triplicate in parallel. RT-qPCR results were analyzed using the comparative Ct analysis method (Schmittgen and Livak, 2008). First, Ct values of technical replicates (qPCR replicates from the same cDNA sample; n=2 for evenly mixed cultures and n=3 for uneven-mix experiments) were averaged. ddCt values were then calculated for each sample by subtracting the dCt of the zero-hour time point from the dCt value of the four-hour time point and relative quantification values were derived from the ddCt values (2−ddCt). Statistical significance was tested on the ddCt values using Welch’s t-test.
For RNA-seq, the growth assay was performed in biological triplicate in parallel. Gene coding sequences of isolate 71 was first annotated using RAST, before sequencing reads were aligned to the gene sequences using Bowtie2 (v2.3.1) (Langmead and Salzberg, 2012; Langmead et al.) under very-sensitive mode. The output sam files were filtered to include only uniquely mapped reads (with the option “-q 1” in Samtools v1.8 (Li et al., 2009)), converted to bam files, sorted, and indexed using Samtools (v1.8) (Li et al., 2009). The raw count of reads aligned to each gene was computed using featureCounts (v1.5.2) (Liao et al., 2014) with default arguments. Differentially expressed genes were identified using the DESeq2 package (Love et al., 2014) (Benjamini-Hochberg adjusted p-value of < 0.05) in R using the standard differential expression analysis workflow. Based on the DESeq2 results, the differentially abundant KEGG pathways were consequently inferred using the GAGE package (v2.28.2) (Luo et al., 2009) and visualized using the Pathview package (v1.18.2) (Luo and Brouwer, 2013).
mWGS quality filtering and taxonomic profiling
Sequencing adapters and low quality bases were removed from the mWGS reads using scythe (v0.994) (Buffalo) and sickle (v1.33) (Joshi and Fass), respectively, with default parameters. Host reads were removed by mapping all sequencing reads to the hg19 human reference genome using Bowtie2 (v2.3.1) (Langmead and Salzberg, 2012; Langmead et al.), under “very-sensitive” mode. Unmapped reads (i.e., microbial reads) were used to estimate the relative abundance profiles of the microbial species in the samples using MetaPhlAn2 (Segata et al., 2012; Truong et al., 2015).
mWGS assembly and gene prediction
Metagenomic genes were predicted from the mWGS samples using a method derived from (Zhou et al., 2019). mWGS reads from all skin microbiome samples were pooled and assembled de novo using MEGAHIT (v1.0.6) (Li et al., 2015, 2016) with default parameters. The resulting contigs were filtered by length (contigs no shorter than 1kb were kept) before genes were predicted from the contigs using prodigal (v2.6.3) (Hyatt et al., 2010) under the “meta” mode. Predicted genes were clustered at 90% DNA sequence identity using UCLUST (the cluster_fast algorithm in USEARCH v8.0.1517, which sorts the gene sequences by length, conducts global alignments, and then trims terminal gaps before computing sequence identity (Edgar, 2010)) to remove redundant gene sequences. Next, the predicted metagenomic genes were blasted to the S. epidermidis pan-genome using UBLAST (USEARCH v8.0.1517 (Edgar, 2010)) with an e-value threshold of 10−9, and metagenomic genes with a DNA sequence identity >95% to any S. epidermidis genes were excluded, resulting in a catalog of 502,145 non-S. epidermidis metagenomic genes.
To estimate the coverage of the metagenomic genes in the microbiome samples, mWGS reads were mapped to the metagenomic genes using Bowtie2 (v2.3.1) (Langmead and Salzberg, 2012; Langmead et al.) and the coverage was computed using Samtools (v1.8, used for samfile to bamfile conversion and sorting) (Li et al., 2009) and Bedtools (v2.27.0, genomecov function) (Quinlan and Hall, 2010).
Linear association between microbiome features and S. epidermidis gene prevalence
Microbiome species with a mean relative abundance lower than 0.0001, and metagenomic genes with a mean coverage lower than 0.000001 reads per base per mWGS read sampled were excluded from downstream analyses. Next, microbiome species and genes were further filtered based on variability (excluded features with a coefficient of variation lower than 0.05) and sparsity (excluded features with non-zero abundance/coverage in more than 20% of the samples). Similarly, S. epidermidis genes that had a coefficient of variation lower than 0.05 or with non-zero abundance/coverage in more than 20% of the samples were not used for the analysis.
We then reduced the dimensionality of the microbiome species abundance profiles and the microbiome gene coverage profiles using principal component analyses (prcomp in R): the first 3 principal components that explained 82% of the variation in species abundance profiles, and the first 2 principal components that explained 90% of the variation in the gene coverage profiles were used to represent the microbiome species and gene compositions, respectively. Next, the influence of the microbiome species composition, or the microbiome gene coverage, on the prevalence of S. epidermidis gene content (i.e. the proportion of S. epidermidis isolates that carried the gene) were modeled separately, each using a linear model:
where y is the observed prevalence of a given gene, PCi is the ith principal component (out of a n=3 principal components for microbiome species and n=2 principal components for microbiome genes), P denotes the subject, S denotes the skin site, T denotes the sampling time point, × denotes interaction effect, and s is the residual error. The p-values (of the adjusted partial R2 of the principal components) were estimated using unrestricted permutation, permutation restricted within-subject, and permutation restricted within subject×site, of the observed S. epidermidis gene prevalence before adjusted under the Benjamini-Hochberg procedure. Finally, S. epidermidis genes that were significant under all of the permutation tests were reported.
S. epidermidis gene prevalence prediction using a recursive partitioning tree model
We used a recursive partitioning tree model (implemented in the R package rpart v4.1.15 (Therneau and Atkinson, 2019)) to extract potentially non-linear relationships between microbiome/skin site features and S. epidermidis gene prevalence (Figure S7E).
One limitation of our dataset is that only about 10 S. epidermidis isolates were sampled per skin site per subject, and thus the gene prevalence estimated based on this relatively small sample can approximate but may not accurately reflect the actual gene prevalence at the sample location. Therefore instead of training a regression tree to predict the numerical value of gene prevalence, we binned the gene prevalence into four levels (prevalent – gene prevalence ∈[0.75, 1], likely prevalent - gene prevalence ∈[0.5, 0.75), likely absent – gene prevalence ∈[0.25, 0.5), and absent – gene prevalence ∈[0, 0.25)) and trained a classification tree to predict the prevalence level. To balance the representation of prevalence levels, we only considered S. epidermidis genes that had exhibited all four prevalence levels across the samples.
Feature vectors were generated based on microbiome species abundances, microbiome gene coverages, and skin site specifications (Figure S7E). The microbiome species and gene profiles were filtered based on abundance/coverage and variability as described in the previous section, but were not screened based on sparsity as no significance tests were conducted. The microbiome gene profiles were then rescaled proportionally such that they share the same maximum and minimum values with the microbiome species profiles. Next, the microbiome species and gene profiles were combined before subjected to dimensionality reduction using principal component analyses (prcomp in R). For a given sample, we generated 15 feature vectors, each containing 1) the sampled skin site, and 2) the top x principal components (x=1, 2, …, 15), which explained 37% - 90% of the variation in the microbiome features (Figure S7E).
The dataset was divided into a training set (80% of the samples randomly chosen from p0, p1, p2, and p4), a validation set (the rest 20% of the samples from p0, p1, p2, and p4), and a test set (all samples from p3). For a given S. epidermidis gene, 15 recursive partitioning tree models were trained based on the 15 feature vectors, respectively, and evaluated based on their predictability – the probability of making correct prediction:
where l indicates the four levels of prevalence, Il is an indicator variable which equals 1 if level l is the observed prevalence level, and equals 0 otherwise. Prl is the probability of level l: for prior predictability, Prl equals the observed frequency of level l in the training set; for posterior predictability, Prl equals the “class probability” of level l given by the predict.rpart function. For a given S. epidermidis gene, the best model showing the highest posterior predictability based on the validation set was selected for downstream analysis. To separate the predictability due to skin site specification and the predictability due to the inclusion of microbiome data, we trained an additional set of recursive partitioning tree models with a similar approach but using only the skin site specification as the feature (that is, not including any microbiome features). Presence of homologs of S. epidermidis genes in known plasmids were estimated by aligning the genes to the PLSDB plasmid database (release 2018_12_05) (Galata et al., 2019) using dc-megablast (blastn 2.6.0+) (Altschul et al., 1990; Zhang et al., 2000) and identifying the best-hit alignment. Genes with sequence identity greater than 70% and coverage greater than 75% over the gene length were considered having homologs in known plasmids.
QUANTIFICATION AND STATISTICAL ANALYSES
Cophenetic distance was computed using the “cophenetic.phylo” function in the R package ape (v5.3) (Paradis and Schliep, 2019). Pielou’s evenness index (J) was given by:
where H is the Shannon’s diversity index computed using the R package vegan (v2.5.3) (Oksanen et al., 2018), and S is the total number of classes (in the case of the prevalence levels, S=4). FST was computed using:
where πbetween and πwithin respectively represent the average between-subpopulation and within-subpopulation pairwise gene content difference – the average proportion of genes that were present in only one isolate out of a pair of S. epidermidis isolates.
All significance tests, unless noted otherwise, were conducted in R (v3.2.3) with standard libraries. Hartigan’s dip test was conducted using the R package diptest (v0.75.7) (Maechler, 2016) with p values estimated via the implemented linear interpolation method. PERMANOVA was conducted using the “adonis” function in the R package vegan (v2.5.3) (Oksanen et al., 2018), with subject, skin site, and their interaction term used as the covariates. Adjustment for false discovery rate was conducted following the Benjamini-Hochberg procedure (R function p.adjust with method=“BH”). To test the underrepresentation of agr type III in p2 and type II in p4, we modeled the null hypothesis assuming that the sampling of agr types in the two subjects were Bernoullian, with the success rates given by the overall frequencies of the agr types in all 1482 subject isolates, and the number of trails given by the total number of S. epidermidis isolates sampled from the subjects. Therefore, the p-value can be given by the cumulative binomial distribution function:
where k is the observed number of S. epidermidis isolates in the subject with the agr type of interest, n is the total number of S. epidermidis isolates sampled from the subject, and f is the overall frequency of the agr type of interest in all 1482 subject isolates.
Permutation was implemented using a custom R script. Briefly, for linear models, a test statistics was first computed from an observation, before a total of at least 1000 permutations (unless noted otherwise) were generated by shuffling the dependent variable. The p-value was then expressed as the proportion of permutations yielding a larger test statistics than the observed test statistics. For ANOVA, the F statistics was used as the test statistics in the permutation. For generalized linear model, which was used to test association between microbiome features and S. epidermidis gene prevalence, the adjusted partial R was used as the test statistics. For cases other than linear models, permutations were generated by re-distributing labels of the data. Specifically, to test the significance of temporal fluctuation in S. epidermidis gene content, permutations were generated by reassigning the time points among subject isolates sampled from the same skin site of the same subject (i.e. the same subpopulation), while the test statistics was given by the proportion of shared pan-genomes across time points.
DATA AND CODE AVAILABILITY
The datasets generated during and/or analyzed during the current study, as well as custom codes to analyze the data, are available from the corresponding author on reasonable request. Genomes will be deposited in Genbank and metagenomic sequence reads in SRA under BioProject PRJNA559376 and PRJNA558989.
Supplementary Material
Figure S1. Contig read coverages as a function of contig sizes. The plot contained 50000 randomly sampled data points. Related to STAR Methods.
Figure S2. Bayesian inference of evolutionary history. Related to Figure 2 and STAR Methods. A, maximum clade credibility tree annotated with historical transmission events. The colors of the nodes and branches denote the predicted skin sites of the ancestral lineages, while the sizes of the nodes are proportional to the posterior probabilities of the skin site predictions. N=2000 trees were used for final transmission inference. The tree was transformed into a cladogram for better visualization. Arrows illustrate example transmission events from Nares_R to Cheek_L. B, estimated chronological ages of all ancestral nodes in the phylogenetic tree. The ancestral nodes were sorted by their estimated median node age and each unit in the x axis indicated different ancestral nodes. The error bar represents the 95% highest posterior density (HPD) interval. 12–20 founder strains are projected based on nodes having the lower endpoint of the 95% highest posterior probability density older than the host. The labels on the y axis were rescaled for confidentiality. C, negative association between transmission and the diversification of subpopulations. Each data point shows the expected transmission rate (estimated by BEAST) and the FST value between a pair of skin sites. * indicates linear regression lines with significant slopes (p<0.05). The highlighted data points indicate either the umbilicus or toeweb in a pairwise comparison. D, consistency of Bayes factors (upper) and posterior probabilities (lower) supporting pairwise transmission events estimated from two independent MCMC runs.
Figure S3. Spatio-temporal distribution of S. epidermidis functional features. A, shared vs. unique S. epidermidis gene clusters at different time points. Related to Figure 3 and STAR Methods. The total number of time points at which at least one isolate was successfully cultured from the subpopulation is shown on the top of each graph. Subpopulations with significant temporal changes are marked with a “*”. The right index in p0 was marked with a triangle because a limited number of isolates (n=2) were cultured from one of the time points. B, the relationship between sample sizes and p-values of temporal changes. For each given subpopulation (data point), the time point at which the lowest number of isolates (blue) were cultured, the highest number of isolates (red) were cultured, and the total number of isolates cultured across time points (purple) were visualized. C, comparison of p-values of temporal changes including or excluding rare genes. Permutation analyses were run separately with or without filtering out rare genes (defined as those S. epidermidis genes that were present in only one isolate in that subpopulation). Benjamini-Hochberg adjusted p-values of the analyses were then compared to validate that the statistical significance were robust to the presence of rare genes. D, the distribution of S. epidermidis genes with respect to their variability across skin sites (see Figure 3D for subject p0). Example clusters of genes with high variability are highlighted with red boxes (boundaries arbitrarily selected). Skin-site distribution of the genes in each of the highlighted clusters and their prevalence were shown in the heatmaps. Each row in the heatmap represents a unique S. epidermidis gene, and the row and column hierarchical clusters were generated based on Euclidean distances. E, examples of KEGG modules with differential representation across subjects and skin sites (for a full list, see Table S3). Module representation (the proportion of KEGG orthologs in the module present in an isolate) was rescaled proportionally by the mean module representation at each skin site. F, prevalence of predicted BGCs across subjects and skin sites. G, SNP-based gene tree of the nrps and siderophore BGCs and their distribution across subjects and skin sites. The skin site of each BGC-carrying isolate is indicated in green. H, SNP-based gene tree of the terpene BGCs and their distribution across subjects and skin sites. The skin site of each BGC-carrying isolate is indicated in green. I-J, distribution of different types of bacteriocin (G) and lantipeptide (H) BGCs across subjects and skin sites. Each “type” represents BGC sequences clustered at 80% sequence identity. No gene tree was constructed for these BGCs due to the lack of colinear regions.
Figure S4. Spatio-temporal distribution of sister isolates. Related to Figure 4. Each panel shows the number of sister isolates found at different time points (upper) and the total number of skin sites that contained at least one sister isolate from that group (lower).
Figure S5. Distribution of predicted plasmid-encoded ABR genes. Related to Figure 5. A, prevalence of predicted phage sequences (i.e., the proportion of isolates carrying the predicted phage sequences) across subjects and skin sites. The row dendrogram shows the diversity of the predicted phages based on the presence and absence of gene contents, and is colored based on the closest phage reference sequence as predicted by PHASTER. The column hierarchical clusters were generated based on Euclidean distances. B, prevalence of predicted plasmid contigs (that aligned to PLSDB) across subjects and skin sites. The row and column hierarchical clusters were generated based on Euclidean distances. This panel is related to Figure 5A. C, skin-site prevalence of predicted plasmid-encoded ABR genes that were only observed in a single subject. Prevalence was defined as the proportion of isolates in a subpopulation that carried at least one predicted plasmid segment which encoded resistance to the antibiotic in question. D, skin-site prevalence of predicted plasmid-encoded ABR that were observed in at least two subjects. The subjects with no predicted plasmid-encoded resistance to a given antibiotic were shown with increased transparency. Prevalence was defined as the proportion of isolates in a subpopulation that carried at least one predicted plasmid segment which encoded resistance to the antibiotic in question.
Figure S6. Predicted S. epidermidis genes and variants that can affect virulence. Related to Figure 6. A, prevalence of known S. epidermidis virulence genes across subjects and skin sites. B, mutations that split the transmembrane domains of AgrC, as verified with Sanger sequencing. C, genes involved in the TCA cycle pathway, as an example of carbohydrate metabolism genes that showed higher expression levels with the presence of population supernatant in the agr interference experiments.
Figure S7. Association between S. epidermidis gene prevalence and the local skin microbiota. Related to Figure 7 and STAR Methods. A-D, taxonomic and gene content compositions of the skin microbiota. Principal component analyses of the microbiome taxonomic compositions on species level were conducted to illustrate the diversification of skin microbiome compositions across subjects (A) and skin sites (B). The five loading vectors with the largest norms are visualized on the plot (see Table S7 for the rest of the loading vectors). Similarly, principal component analyses of the microbiome gene coverage were conducted to illustrate the diversification of coding potentials of the skin microbiota across subjects (C) and skin sites (D). E, a diagram outlining the training and evaluation of the recursive partitioning tree model. F-H, Given the variability of the S. epidermidis genes across subpopulations (i.e. Pielou’s index of gene prevalence levels, x axis), the prior predictability of the S. epidermidis gene prevalences in the new host (i.e. test set) (F), and the increased predictability when including skin site specification (G) and contextual microbiome features (H) are shown. The top 20 genes that had the greatest increase in predictability when including skin site specification or microbiome features were highlighted in red.
Table S1. Specifications of the S. epidermidis isolates and the shotgun metagenomic samples used in this study. Related to STAR Methods.
Table S2. Specifications of the public S. epidermidis genomes used in this study. Related to STAR Methods.
Table S3. Pfam and Enzyme Commission (EC) classification of the unannotated toeweb-specific genes and KEGG modules that exhibited differential representation across subjects or skin sites. Related to Figure 3.
Table S4. Core genome recombination events, sister isolates, and genes with differential presence among sister isolates. Related to Figure 4.
Table S5. Predicted plasmid-encoded ABR genes annotated using the RGI pipeline. Related to Figure 5.
Table S6. agr variants, population-level interference, and the influence on gene expression. Related to Figure 6.
Table S7. Loading vectors of microbiome species used to generate Figure S7A and S7B. Related to Figure 7 and STAR Methods.
Highlights.
S. epidermidis strains within-individual are diverse and evolved from multiple founders
Strain diversity is shaped by purifying selection and transmission events
Strain admixture can suppress virulence and alter metabolism at a population level
Horizontal gene transfer disseminates antibiotic resistance genes within individuals
Acknowledgements
We would like to thank the Microbial Genomic Services and Mark Adams of The Jackson Laboratory for their support in sequencing, and Mark Adams and the Oh lab for critical reading of the manuscript. This work was funded by the Jackson Laboratory Scientific Services Innovation Fund and National Institute of Health (DP2 GM126893–01 and K22 AI119231–01). JO is additionally supported by the National Institutes of Health (1U54NS105539, 1 U19 AI142733, 1 R21 AR075174, 1 R43 AR073562), the Department of Defense (W81XWH1810229), the National Science Foundation (1853071), the American Cancer Society, and Leo Foundation. MS is funded by the National Institutes of Health (1F30DE027870-01 and T90-DE022526).
Footnotes
Declaration of interests
The authors declare no competing interests.
Publisher's Disclaimer: This is a PDF file of an unedited manuscript that has been accepted for publication. As a service to our customers we are providing this early version of the manuscript. The manuscript will undergo copyediting, typesetting, and review of the resulting proof before it is published in its final form. Please note that during the production process errors may be discovered which could affect the content, and all legal disclaimers that apply to the journal pertain.
Reference
- Altschul SF, Gish W, Miller W, Myers EW, and Lipman DJ (1990). Basic local alignment search tool. J. Mol. Biol 215, 403–410. [DOI] [PubMed] [Google Scholar]
- Archer GL, and Johnston JL (1983). Self-transmissible plasmids in staphylococci that encode resistance to aminoglycosides. Antimicrob. Agents and Chemother 24, 70–77. [DOI] [PMC free article] [PubMed] [Google Scholar]
- Arndt D, Grant JR, Marcu A, Sajed T, Pon A, Liang Y, and Wishart DS (2016). PHASTER: a better, faster version of the PHAST phage search tool. Nucleic Acids Res. 44, W16–21. [DOI] [PMC free article] [PubMed] [Google Scholar]
- Asnicar F, Manara S, Zolfo M, Truong DT, Scholz M, Armanini F, Ferretti P, Gorfer V, Pedrotti A, Tett A, et al. (2017). Studying Vertical Microbiome Transmission from Mothers to Infants by Strain-Level Metagenomic Profiling. MSystems 2, e00164–16. [DOI] [PMC free article] [PubMed] [Google Scholar]
- Bankevich A, Nurk S, Antipov D, Gurevich AA, Dvorkin M, Kulikov AS, Lesin VM, Nikolenko SI, Pham S, Prjibelski AD, et al. (2012). SPAdes: A New Genome Assembly Algorithm and Its Applications to Single-Cell Sequencing. J. Comput. Biol 19, 455–477. [DOI] [PMC free article] [PubMed] [Google Scholar]
- Batzilla CF, Rachid S, Engelmann S, Hecker M, Hacker J, and Ziebuhr W (2006). Impact of the accessory gene regulatory system (Agr) on extracellular proteins, codY expression and amino acid metabolism in Staphylococcus epidermidis. Proteomics 6, 3602–3613. [DOI] [PubMed] [Google Scholar]
- Bielejec F, Baele G, Vrancken B, Suchard MA, Rambaut A, and Lemey P (2016). SpreaD3: Interactive Visualization of Spatiotemporal History and Trait Evolutionary Processes. Mol. Biol. Evol 33, 2167–2169. [DOI] [PMC free article] [PubMed] [Google Scholar]
- Brisson D (2018). Negative Frequency-Dependent Selection Is Frequently Confounding. Front. Ecol. Evol 6. [DOI] [PMC free article] [PubMed] [Google Scholar]
- Brisson D, and Dykhuizen DE (2004). ospC diversity in Borrelia burgdorferi: different hosts are different niches. Genetics 168, 713–722. [DOI] [PMC free article] [PubMed] [Google Scholar]
- Brito IL, and Alm EJ (2016). Tracking Strains in the Microbiome: Insights from Metagenomics and Models. Front. Microbiol 7. [DOI] [PMC free article] [PubMed] [Google Scholar]
- Buffalo V Scythe - A Bayesian adapter trimmer (https://github.com/vsbuffalo/scythe).
- Chen L, Zheng D, Liu B, Yang J, and Jin Q (2016). VFDB 2016: hierarchical and refined dataset for big data analysis−-10 years on. Nucleic Acids Res. 44, D694–697. [DOI] [PMC free article] [PubMed] [Google Scholar]
- Cheung GYC, Joo H-S, Chatterjee SS, and Otto M (2014). Phenol-soluble modulins – critical determinants of staphylococcal virulence. FEMS Microbiol. Rev 38, 698–719. [DOI] [PMC free article] [PubMed] [Google Scholar]
- Cogen AL, Yamasaki K, Sanchez KM, Dorschner RA, Lai Y, MacLeod DT, Torpey JW, Otto M, Nizet V, Kim JE, et al. (2010a). Selective Antimicrobial Action Is Provided by Phenol-Soluble Modulins Derived from Staphylococcus epidermidis, a Normal Resident of the Skin. J. Invest. Dermatol 130, 192–200. [DOI] [PMC free article] [PubMed] [Google Scholar]
- Cogen AL, Yamasaki K, Muto J, Sanchez KM, Alexander LC, Tanios J, Lai Y, Kim JE, Nizet V, and Gallo RL (2010b). Staphylococcus epidermidis Antimicrobial 5-Toxin (Phenol-Soluble Modulin-y) Cooperates with Host Antimicrobial Peptides to Kill Group A Streptococcus. PLOS ONE 5, e8557. [DOI] [PMC free article] [PubMed] [Google Scholar]
- Conlan S, Mijares LA, Becker J, Blakesley RW, Bouffard GG, Brooks S, Coleman H, Gupta J, Gurson N, Park M, et al. (2012). Staphylococcus epidermidis pan-genome sequence analysis reveals diversity of skin commensal and hospital infection-associated isolates. Genome Biol. 13, R64. [DOI] [PMC free article] [PubMed] [Google Scholar]
- Dalkiran A, Rifaioglu AS, Martin MJ, Cetin-Atalay R, Atalay V, and Doğan T (2018). ECPred: a tool for the prediction of the enzymatic functions of protein sequences based on the EC nomenclature. BMC Bioinformatics 19, 334. [DOI] [PMC free article] [PubMed] [Google Scholar]
- Didelot X, and Wilson DJ (2015). ClonalFrameML: Efficient Inference of Recombination in Whole Bacterial Genomes. PLOS Comput. Biol 11, e1004041. [DOI] [PMC free article] [PubMed] [Google Scholar]
- Dobzhansky T (1982). Genetics and the Origin of Species: Columbia Classics edition (Columbia University Press; ). [Google Scholar]
- Drozdetskiy A, Cole C, Procter J, and Barton GJ (2015). JPred4: a protein secondary structure prediction server. Nucleic Acids Res. 43, W389–W394. [DOI] [PMC free article] [PubMed] [Google Scholar]
- Drummond AJ, Rambaut A, Shapiro B, and Pybus OG (2005). Bayesian coalescent inference of past population dynamics from molecular sequences. Mol. Biol. Evol 22, 1185–1192. [DOI] [PubMed] [Google Scholar]
- Duchene S, Holt KE, Weill F-X, Le Hello S, Hawkey J, Edwards DJ, Fourment M, and Holmes EC (2016). Genome-scale rates of evolutionary change in bacteria. Microb. Genom 2, e000094. [DOI] [PMC free article] [PubMed] [Google Scholar]
- Duvallet C, Gibbons SM, Gurry T, Irizarry RA, and Alm EJ (2017). Meta-analysis of gut microbiome studies identifies disease-specific and shared responses. Nat. Commun 8, 1784. [DOI] [PMC free article] [PubMed] [Google Scholar]
- Edgar RC (2010). Search and clustering orders of magnitude faster than BLAST. Bioinformatics 26, 2460–2461. [DOI] [PubMed] [Google Scholar]
- von Eiff C, Becker K, Machka K, Stammer H, and Peters G (2001). Nasal carriage as a source of Staphylococcus aureus bacteremia. Study Group. N. Engl. J. Med 344, 11–16. [DOI] [PubMed] [Google Scholar]
- El-Gebali S, Mistry J, Bateman A, Eddy SR, Luciani A, Potter SC, Qureshi M, Richardson LJ, Salazar GA, Smart A, et al. (2019). The Pfam protein families database in 2019. Nucleic Acids Res. 47, D427–D432. [DOI] [PMC free article] [PubMed] [Google Scholar]
- Ferretti P, Pasolli E, Tett A, Asnicar F, Gorfer V, Fedi S, Armanini F, Truong DT, Manara S, Zolfo M, et al. (2018). Mother-to-Infant Microbial Transmission from Different Body Sites Shapes the Developing Infant Gut Microbiome. Cell Host Microbe 24, 133–145. [DOI] [PMC free article] [PubMed] [Google Scholar]
- Fey PD, and Olson ME (2010). Current concepts in biofilm formation of Staphylococcus epidermidis. Future Microbiol. 5, 917–933. [DOI] [PMC free article] [PubMed] [Google Scholar]
- Forbes BA, and Schaberg DR (1983). Transfer of resistance plasmids from Staphylococcus epidermidis to Staphylococcus aureus: evidence for conjugative exchange of resistance. J. Bacteriol 153, 627–634. [DOI] [PMC free article] [PubMed] [Google Scholar]
- Frisch MB, Castillo-Ramírez S, Petit RA, Farley MM, Ray SM, Albrecht VS, Limbago BM, Hernandez J, See I, Satola SW, et al. (2018). Invasive Methicillin-Resistant Staphylococcus aureus USA500 Strains from the U.S. Emerging Infections Program Constitute Three Geographically Distinct Lineages. MSphere 3, e00571–17. [DOI] [PMC free article] [PubMed] [Google Scholar]
- Fu L, Niu B, Zhu Z, Wu S, and Li W (2012). CD-HIT: accelerated for clustering the next-generation sequencing data. Bioinformatics 28, 3150–3152. [DOI] [PMC free article] [PubMed] [Google Scholar]
- Galata V, Fehlmann T, Backes C, and Keller A (2019). PLSDB: a resource of complete bacterial plasmids. Nucleic Acids Res. 47, D195–D202. [DOI] [PMC free article] [PubMed] [Google Scholar]
- Greenblum S, Carr R, and Borenstein E (2015). Extensive Strain-Level Copy-Number Variation across Human Gut Microbiome Species. Cell 160, 583–594. [DOI] [PMC free article] [PubMed] [Google Scholar]
- Gurevich A, Saveliev V, Vyahhi N, and Tesler G (2013). QUAST: quality assessment tool for genome assemblies. Bioinformatics 29, 1072–1075. [DOI] [PMC free article] [PubMed] [Google Scholar]
- Hedge J, and Wilson DJ (2014). Bacterial Phylogenetic Reconstruction from Whole Genomes Is Robust to Recombination but Demographic Inference Is Not. MBio 5, e02158–14. [DOI] [PMC free article] [PubMed] [Google Scholar]
- Hirvonen JJ, Kerttula A-M, and Kaukoranta S-S (2014). Performance of SaSelect, a Chromogenic Medium for Detection of Staphylococci in Clinical Specimens. J. Clin. Microbiol 52, 1041–1044. [DOI] [PMC free article] [PubMed] [Google Scholar]
- Huerta-Cepas J, Szklarczyk D, Forslund K, Cook H, Heller D, Walter MC, Rattei T, Mende DR, Sunagawa S, Kuhn M, et al. (2016). eggNOG 4.5: a hierarchical orthology framework with improved functional annotations for eukaryotic, prokaryotic and viral sequences. Nucleic Acids Res. 44, D286–D293. [DOI] [PMC free article] [PubMed] [Google Scholar]
- Hyatt D, Chen G-L, LoCascio PF, Land ML, Larimer FW, and Hauser LJ (2010). Prodigal: prokaryotic gene recognition and translation initiation site identification. BMC Bioinformatics 11, 119. [DOI] [PMC free article] [PubMed] [Google Scholar]
- Jia B, Raphenya AR, Alcock B, Waglechner N, Guo P, Tsang KK, Lago BA, Dave BM, Pereira S, Sharma AN, et al. (2017). CARD 2017: expansion and model-centric curation of the comprehensive antibiotic resistance database. Nucleic Acids Res. 45, D566–D573. [DOI] [PMC free article] [PubMed] [Google Scholar]
- Joshi NA, and Fass JN Sickle: A sliding-window, adaptive, quality-based trimming tool for FastQ files (https://github.com/najoshi/sickle).
- Kong HH, Oh J, Deming C, Conlan S, Grice EA, Beatson MA, Nomicos E, Polley EC, Komarow HD, Program NCS, et al. (2012). Temporal shifts in the skin microbiome associated with disease flares and treatment in children with atopic dermatitis. Genome Res. 22, 850–859. [DOI] [PMC free article] [PubMed] [Google Scholar]
- Krawczyk PS, Lipinski L, and Dziembowski A (2018). PlasFlow: predicting plasmid sequences in metagenomic data using genome signatures. Nucleic Acids Res. 46, e35. [DOI] [PMC free article] [PubMed] [Google Scholar]
- Kurtz S, Phillippy A, Delcher AL, Smoot M, Shumway M, Antonescu C, and Salzberg SL (2004). Versatile and open software for comparing large genomes. Genome Biol. 5, R12. [DOI] [PMC free article] [PubMed] [Google Scholar]
- Lai Y, Nardo AD, Nakatsuji T, Leichtle A, Yang Y, Cogen AL, Wu Z-R, Hooper LV, Schmidt RR, Aulock S von, et al. (2009). Commensal bacteria regulate Toll-like receptor 3–dependent inflammation after skin injury. Nat. Med 15, 1377–1382. [DOI] [PMC free article] [PubMed] [Google Scholar]
- Lai Y, Cogen AL, Radek KA, Park HJ, MacLeod DT, Leichtle A, Ryan AF, Di Nardo A, and Gallo RL (2010). Activation of TLR2 by a Small Molecule Produced by Staphylococcus epidermidis Increases Antimicrobial Defense against Bacterial Skin Infections. J. Invest. Dermatol 130, 2211–2221. [DOI] [PMC free article] [PubMed] [Google Scholar]
- Lam HM, Ratmann O, and Boni MF (2018). Improved Algorithmic Complexity for the 3SEQ Recombination Detection Algorithm. Mol. Biol. Evol 35, 247–251. [DOI] [PMC free article] [PubMed] [Google Scholar]
- Langfelder P, Zhang B, and Horvath S (2008). Defining clusters from a hierarchical cluster tree: the Dynamic Tree Cut package for R. Bioinformatics 24, 719–720. [DOI] [PubMed] [Google Scholar]
- Langmead B, and Salzberg SL (2012). Fast gapped-read alignment with Bowtie 2. Nat. Methods 9, 357–359. [DOI] [PMC free article] [PubMed] [Google Scholar]
- Langmead B, Wilks C, Antonescu V, Charles R, and Hancock J Scaling read aligners to hundreds of threads on general-purpose processors. Bioinformatics. [DOI] [PMC free article] [PubMed] [Google Scholar]
- Le KY, and Otto M (2015). Quorum-sensing regulation in staphylococci—an overview. Front. Microbiol 6. [DOI] [PMC free article] [PubMed] [Google Scholar]
- Leimbach A, Hacker J, and Dobrindt U (2013). E. coli as an all-rounder: the thin line between commensalism and pathogenicity. Curr. Top. Microbiol. Immunol 358, 3–32. [DOI] [PubMed] [Google Scholar]
- Lemey P, Rambaut A, Drummond AJ, and Suchard MA (2009). Bayesian Phylogeography Finds Its Roots. PLOS Comput. Biol 5, e1000520. [DOI] [PMC free article] [PubMed] [Google Scholar]
- Li H (2011). A statistical framework for SNP calling, mutation discovery, association mapping and population genetical parameter estimation from sequencing data. Bioinformatics 27, 2987–2993. [DOI] [PMC free article] [PubMed] [Google Scholar]
- Li W, and Godzik A (2006). Cd-hit: a fast program for clustering and comparing large sets of protein or nucleotide sequences. Bioinformatics 22, 1658–1659. [DOI] [PubMed] [Google Scholar]
- Li D, Liu C-M, Luo R, Sadakane K, and Lam T-W (2015). MEGAHIT: an ultra-fast single-node solution for large and complex metagenomics assembly via succinct de Bruijn graph. Bioinformatics 31, 1674–1676. [DOI] [PubMed] [Google Scholar]
- Li D, Luo R, Liu C-M, Leung C-M, Ting H-F, Sadakane K, Yamashita H, and Lam T-W (2016). MEGAHIT v1.0: A fast and scalable metagenome assembler driven by advanced methodologies and community practices. Methods 102, 3–11. [DOI] [PubMed] [Google Scholar]
- Li H, Handsaker B, Wysoker A, Fennell T, Ruan J, Homer N, Marth G, Abecasis G, Durbin R, and 1000 Genome Project Data Processing Subgroup (2009). The Sequence Alignment/Map format and SAMtools. Bioinformatics 25, 2078–2079. [DOI] [PMC free article] [PubMed] [Google Scholar]
- Liao Y, Smyth GK, and Shi W (2014). featureCounts: an efficient general purpose program for assigning sequence reads to genomic features. Bioinformatics 30, 923–930. [DOI] [PubMed] [Google Scholar]
- Linehan JL, Harrison OJ, Han S-J, Byrd AL, Vujkovic-Cvijin I, Villarino AV, Sen SK, Shaik J, Smelkinson M, Tamoutounour S, et al. (2018). Non-classical immunity controls microbiota impact on skin immunity and tissue repair. Cell 172, 784–796.e18. [DOI] [PMC free article] [PubMed] [Google Scholar]
- Lloyd-Price J, Mahurkar A, Rahnavard G, Crabtree J, Orvis J, Hall AB, Brady A, Creasy HH, McCracken C, Giglio MG, et al. (2017). Strains, functions and dynamics in the expanded Human Microbiome Project. Nature 550, 61–66. [DOI] [PMC free article] [PubMed] [Google Scholar]
- Love MI, Huber W, and Anders S (2014). Moderated estimation of fold change and dispersion for RNA-seq data with DESeq2. Genome Biol. 15. [DOI] [PMC free article] [PubMed] [Google Scholar]
- Luo W, and Brouwer C (2013). Pathview: an R/Bioconductor package for pathway-based data integration and visualization. Bioinformatics 29, 1830–1831. [DOI] [PMC free article] [PubMed] [Google Scholar]
- Luo W, Friedman MS, Shedden K, Hankenson KD, and Woolf PJ (2009). GAGE: generally applicable gene set enrichment for pathway analysis. BMC Bioinformatics 10, 161. [DOI] [PMC free article] [PubMed] [Google Scholar]
- MacLea KS, and Trachtenberg AM (2017). Complete Genome Sequence of Staphylococcus epidermidis ATCC 12228 Chromosome and Plasmids, Generated by Long-Read Sequencing. Genome Announc. 5. [DOI] [PMC free article] [PubMed] [Google Scholar]
- Maechler M (2016). diptest: Hartigan’s Dip Test Statistic for Unimodality - Corrected.
- Martin D, and Rybicki E (2000). RDP: detection of recombination amongst aligned sequences. Bioinformatics 16, 562–563. [DOI] [PubMed] [Google Scholar]
- Martin DP, Posada D, Crandall KA, and Williamson C (2005). A modified bootscan algorithm for automated identification of recombinant sequences and recombination breakpoints. AIDS Res. Hum. Retroviruses 21, 98–102. [DOI] [PubMed] [Google Scholar]
- Martin DP, Murrell B, Golden M, Khoosal A, and Muhire B (2015). RDP4: Detection and analysis of recombination patterns in virus genomes. Virus Evol. 1, vev003. [DOI] [PMC free article] [PubMed] [Google Scholar]
- Matinaho S, von Bonsdorff L, Rouhiainen A, Lonnroth M, and Parkkinen J (2001). Dependence of Staphylococcus epidermidis on non-transferrin-bound iron for growth. FEMS Microbiol. Lett 196, 177–182. [DOI] [PubMed] [Google Scholar]
- Méric G, Miragaia M, de Been M, Yahara K, Pascoe B, Mageiros L, Mikhail J, Harris LG, Wilkinson TS, Rolo J, et al. (2015). Ecological Overlap and Horizontal Gene Transfer in Staphylococcus aureus and Staphylococcus epidermidis. Genome Biol. Evol 7, 1313–1328. [DOI] [PMC free article] [PubMed] [Google Scholar]
- Méric G, Mageiros L, Pensar J, Laabei M, Yahara K, Pascoe B, Kittiwan N, Tadee P, Post V, Lamble S, et al. (2018). Disease-associated genotypes of the commensal skin bacterium Staphylococcus epidermidis. Nat. Commun 9, 5034. [DOI] [PMC free article] [PubMed] [Google Scholar]
- Mideo N, Alizon S, and Day T (2008). Linking within- and between-host dynamics in the evolutionary epidemiology of infectious diseases. Trends Ecol. Evol 23, 511–517. [DOI] [PubMed] [Google Scholar]
- Naik S, Bouladoux N, Wilhelm C, Molloy MJ, Salcedo R, Kastenmuller W, Deming C, Quinones M, Koo L, Conlan S, et al. (2012). Compartmentalized Control of Skin Immunity by Resident Commensals. Science 337, 1115–1119. [DOI] [PMC free article] [PubMed] [Google Scholar]
- Nakatsuji T, Chen TH, Butcher AM, Trzoss LL, Nam S-J, Shirakawa KT, Zhou W, Oh J, Otto M, Fenical W, et al. (2018). A commensal strain of Staphylococcus epidermidis protects against skin neoplasia. Sci. Adv 4, eaao4502. [DOI] [PMC free article] [PubMed] [Google Scholar]
- Nataro JP, and Kaper JB (1998). Diarrheagenic Escherichia coli. Clin. Microbiol. Rev 11, 142–201. [DOI] [PMC free article] [PubMed] [Google Scholar]
- National Nosocomial Infections Surveillance System (2004). National Nosocomial Infections Surveillance (NNIS) System Report, data summary from January 1992 through June 2004, issued October 2004. Am. J. Infect. Control 32, 470–485. [DOI] [PubMed] [Google Scholar]
- Niehus R, Mitri S, Fletcher AG, and Foster KR (2015). Migration and horizontal gene transfer divide microbial genomes into multiple niches. Nat. Commun 6, 8924. [DOI] [PMC free article] [PubMed] [Google Scholar]
- O’Brien JD, Didelot X, Iqbal Z, Amenga-Etego L, Ahiska B, and Falush D (2014). A Bayesian Approach to Inferring the Phylogenetic Structure of Communities from Metagenomic Data. Genetics 197, 925–937. [DOI] [PMC free article] [PubMed] [Google Scholar]
- Oh J, Byrd AL, Deming C, Conlan S, Kong HH, and Segre JA (2014). Biogeography and individuality shape function in the human skin metagenome. Nature 514, 59–64. [DOI] [PMC free article] [PubMed] [Google Scholar]
- Oh J, Byrd AL, Park M, Kong HH, and Segre JA (2016). Temporal Stability of the Human Skin Microbiome. Cell 165, 854–866. [DOI] [PMC free article] [PubMed] [Google Scholar]
- Oksanen J, BLanchet FG, Friendly M, Roeland K, Legendre P, McGlinn D, Minchin P, O’Hara RB, Simpson GL, Solymos P, et al. (2018). vegan: Community Ecology Package.
- Oliveira F, Franca A, and Cerca N (2017). Staphylococcus epidermidis is largely dependent on iron availability to form biofilms. Int. J. Med. Microbiol 307, 552–563. [DOI] [PubMed] [Google Scholar]
- Olson ME, Todd DA, Schaeffer CR, Paharik AE, Dyke MJV, Büttner H, Dunman PM, Rohde H, Cech NB, Fey PD, et al. (2014). Staphylococcus epidermidis agr Quorum-Sensing System: Signal Identification, Cross Talk, and Importance in Colonization. J. Bacteriol 196, 3482–3493. [DOI] [PMC free article] [PubMed] [Google Scholar]
- Otto M (2009). Staphylococcus epidermidis – the “accidental” pathogen. Nat. Rev. Microbiol 7, 555–567. [DOI] [PMC free article] [PubMed] [Google Scholar]
- Otto M, O’Mahoney DS, Guina T, and Klebanoff SJ (2004). Activity of Staphylococcus epidermidis phenol-soluble modulin peptides expressed in Staphylococcus carnosus. J. Infect. Dis 190, 748–755. [DOI] [PubMed] [Google Scholar]
- Padidam M, Sawyer S, and Fauquet CM (1999). Possible emergence of new geminiviruses by frequent recombination. Virology 265, 218–225. [DOI] [PubMed] [Google Scholar]
- Page AJ, Cummins CA, Hunt M, Wong VK, Reuter S, Holden MTG, Fookes M, Falush D, Keane JA, and Parkhill J (2015). Roary: rapid large-scale prokaryote pan genome analysis. Bioinformatics 31, 3691–3693. [DOI] [PMC free article] [PubMed] [Google Scholar]
- Paradis E, and Schliep K (2019). ape 5.0: an environment for modern phylogenetics and evolutionary analyses in R. Bioinformatics 35, 526–528. [DOI] [PubMed] [Google Scholar]
- Parks DH, Imelfort M, Skennerton CT, Hugenholtz P, and Tyson GW (2015). CheckM: assessing the quality of microbial genomes recovered from isolates, single cells, and metagenomes. Genome Res. 25, 1043–1055. [DOI] [PMC free article] [PubMed] [Google Scholar]
- Posada D, and Crandall KA (2001). Evaluation of methods for detecting recombination from DNA sequences: computer simulations. Proc. Natl. Acad. Sci. U.S.A 98, 13757–13762. [DOI] [PMC free article] [PubMed] [Google Scholar]
- Potter SC, Luciani A, Eddy SR, Park Y, Lopez R, and Finn RD (2018). HMMER web server: 2018 update. Nucleic Acids Res. 46, W200–W204. [DOI] [PMC free article] [PubMed] [Google Scholar]
- Queck SY, Jameson-Lee M, Villaruz AE, Bach T-HL, Khan BA, Sturdevant DE, Ricklefs SM, Li M, and Otto M (2008). RNAIII-independent target gene control by the agr quorum-sensing system: insight into the evolution of virulence regulation in Staphylococcus aureus. Mol. Cell 32, 150–158. [DOI] [PMC free article] [PubMed] [Google Scholar]
- Quince C, Delmont TO, Raguideau S, Alneberg J, Darling AE, Collins G, and Eren AM (2017). DESMAN: a new tool for de novo extraction of strains from metagenomes. Genome Biol. 18, 181. [DOI] [PMC free article] [PubMed] [Google Scholar]
- Quinlan AR, and Hall IM (2010). BEDTools: a flexible suite of utilities for comparing genomic features. Bioinformatics 26, 841–842. [DOI] [PMC free article] [PubMed] [Google Scholar]
- Rambaut A FigTree version 1.3.1 (http://tree.bio.ed.ac.uk/).
- Sakr A, Brégeon F, Mège J-L, Rolain J-M, and Blin O (2018). Staphylococcus aureus Nasal Colonization: An Update on Mechanisms, Epidemiology, Risk Factors, and Subsequent Infections. Front. Microbiol 9. [DOI] [PMC free article] [PubMed] [Google Scholar]
- Scharschmidt TC, Vasquez KS, Truong H-A, Gearty SV, Pauli ML, Nosbaum A, Gratz IK, Otto M, Moon JJ, Liese J, et al. (2015). A wave of regulatory T cells into neonatal skin mediates tolerance to commensal microbes. Immunity 43, 1011–1021. [DOI] [PMC free article] [PubMed] [Google Scholar]
- Schmittgen TD, and Livak KJ (2008). Analyzing real-time PCR data by the comparative CT method. Nat. Protoc 3, 1101–1108. [DOI] [PubMed] [Google Scholar]
- Seemann T (2014). Prokka: rapid prokaryotic genome annotation. Bioinformatics 30, 2068–2069.24642063 [Google Scholar]
- Segata N (2018). On the Road to Strain-Resolved Comparative Metagenomics. MSystems 3, e00190–17. [DOI] [PMC free article] [PubMed] [Google Scholar]
- Segata N, Waldron L, Ballarini A, Narasimhan V, Jousson O, and Huttenhower C (2012). Metagenomic microbial community profiling using unique clade-specific marker genes. Nat. Methods 9, 811–814. [DOI] [PMC free article] [PubMed] [Google Scholar]
- Smillie CS, Sauk J, Gevers D, Friedman J, Sung J, Youngster I, Hohmann EL, Staley C, Khoruts A, Sadowsky MJ, et al. (2018). Strain Tracking Reveals the Determinants of Bacterial Engraftment in the Human Gut Following Fecal Microbiota Transplantation. Cell Host Microbe 23, 229–240.e5. [DOI] [PMC free article] [PubMed] [Google Scholar]
- Smith JM (1992). Analyzing the mosaic structure of genes. J. Mol. Evol 34, 126–129. [DOI] [PubMed] [Google Scholar]
- Stamatakis A (2014). RAxML version 8: a tool for phylogenetic analysis and post-analysis of large phylogenies. Bioinformatics 30, 1312–1313. [DOI] [PMC free article] [PubMed] [Google Scholar]
- Suchard MA, Lemey P, Baele G, Ayres DL, Drummond AJ, and Rambaut A (2018). Bayesian phylogenetic and phylodynamic data integration using BEAST 1.10. Virus Evol. 4. [DOI] [PMC free article] [PubMed] [Google Scholar]
- Tett A, Pasolli E, Farina S, Truong DT, Asnicar F, Zolfo M, Beghini F, Armanini F, Jousson O, Sanctis VD, et al. (2017). Unexplored diversity and strain-level structure of the skin microbiome associated with psoriasis. Npj Biofilms Microbiomes 3, 14. [DOI] [PMC free article] [PubMed] [Google Scholar]
- Therneau T, and Atkinson B (2019). rpart: Recursive Partitioning and Regression Trees. R package version 4.1–15. [Google Scholar]
- Treangen TJ, Ondov BD, Koren S, and Phillippy AM (2014). The Harvest suite for rapid core-genome alignment and visualization of thousands of intraspecific microbial genomes. Genome Biol. 15, 524. [DOI] [PMC free article] [PubMed] [Google Scholar]
- Trivier D, and Courcol RJ (1996). Iron depletion and virulence in Staphylococcus aureus. FEMS Microbiol. Lett 141, 117–127. [DOI] [PubMed] [Google Scholar]
- Trivier D, Davril M, Houdret N, and Courcol RJ (1995). Influence of iron depletion on growth kinetics, siderophore production, and protein expression of Staphylococcus aureus. FEMS Microbiol. Lett 127, 195–199. [DOI] [PubMed] [Google Scholar]
- Truong DT, Franzosa EA, Tickle TL, Scholz M, Weingart G, Pasolli E, Tett A, Huttenhower C, and Segata N (2015). MetaPhlAn2 for enhanced metagenomic taxonomic profiling. Nat. Methods 12, 902–903. [DOI] [PubMed] [Google Scholar]
- Truong DT, Tett A, Pasolli E, Huttenhower C, and Segata N (2017). Microbial strain-level population structure and genetic diversity from metagenomes. Genome Res. 27, 626–638. [DOI] [PMC free article] [PubMed] [Google Scholar]
- Wang L, and Archer GL (2010). Roles of CcrA and CcrB in Excision and Integration of Staphylococcal Cassette Chromosome mec, a Staphylococcus aureus Genomic Island. J. Bacteriol 192, 3204–3212. [DOI] [PMC free article] [PubMed] [Google Scholar]
- Wang R, Khan BA, Cheung GYC, Bach T-HL, Jameson-Lee M, Kong K-F, Queck SY, and Otto M (2011). Staphylococcus epidermidis surfactant peptides promote biofilm maturation and dissemination of biofilm-associated infection in mice. J. Clin. Invest 121, 238–248. [DOI] [PMC free article] [PubMed] [Google Scholar]
- Weber T, Blin K, Duddela S, Krug D, Kim HU, Bruccoleri R, Lee SY, Fischbach MA, Müller R, Wohlleben W, et al. (2015). antiSMASH 3.0—a comprehensive resource for the genome mining of biosynthetic gene clusters. Nucleic Acids Res 43, W237–W243. [DOI] [PMC free article] [PubMed] [Google Scholar]
- Wood DE, and Salzberg SL (2014). Kraken: ultrafast metagenomic sequence classification using exact alignments. Genome Biol. 15, R46. [DOI] [PMC free article] [PubMed] [Google Scholar]
- Yamada M, Yoshida J, Hatou S, Yoshida T, and Minagawa Y (2008). Mutations in the quinolone resistance determining region in Staphylococcus epidermidis recovered from conjunctiva and their association with susceptibility to various fluoroquinolones. Br. J. Ophthalmol 92, 848–851. [DOI] [PMC free article] [PubMed] [Google Scholar]
- Yao Y, Vuong C, Kocianova S, Villaruz AE, Lai Y, Sturdevant DE, and Otto M (2006). Characterization of the Staphylococcus epidermidis Accessory-Gene Regulator Response: Quorum-Sensing Regulation of Resistance to Human Innate Host Defense. J. Infect. Dis 193, 841–848. [DOI] [PubMed] [Google Scholar]
- Yarwood JM, and Schlievert PM (2003). Quorum sensing in Staphylococcus infections. J. Clin. Invest 112, 1620–1625. [DOI] [PMC free article] [PubMed] [Google Scholar]
- Yassour M, Jason E, Hogstrom LJ, Arthur TD, Tripathi S, Siljander H, Selvenius J, Oikarinen S, Hyoty H, Virtanen SM, et al. (2018). Strain-Level Analysis of Mother-to-Child Bacterial Transmission during the First Few Months of Life. Cell Host Microbe 24, 146–154. [DOI] [PMC free article] [PubMed] [Google Scholar]
- Zhang C, and Zhao L (2016). Strain-level dissection of the contribution of the gut microbiome to human metabolic disease. Genome Med. 8, 41. [DOI] [PMC free article] [PubMed] [Google Scholar]
- Zhang H, Ishige K, and Kornberg A (2002). A polyphosphate kinase (PPK2) widely conserved in bacteria. Proc. Natl. Acad. Sci. U. S. A 99, 16678–16683. [DOI] [PMC free article] [PubMed] [Google Scholar]
- Zhang Y-Q, Ren S-X, Li H-L, Wang Y-X, Fu G, Yang J, Qin Z-Q, Miao Y-G, Wang W-Y, Chen R-S, et al. (2003). Genome-based analysis of virulence genes in a non-biofilm-forming Staphylococcus epidermidis strain (ATCC 12228). Mol. Microbiol 49, 1577–1593. [DOI] [PubMed] [Google Scholar]
- Zhang Z, Schwartz S, Wagner L, and Miller W (2000). A Greedy Algorithm for Aligning DNA Sequences. J. Comput. Biol 7, 203–214. [DOI] [PubMed] [Google Scholar]
- Zhao S, Lieberman TD, Poyet M, Kauffman KM, Gibbons SM, Groussin M, Xavier RJ, and Alm EJ (2019). Adaptive Evolution within Gut Microbiomes of Healthy People. Cell Host Microbe 25, 656–667.e8. [DOI] [PMC free article] [PubMed] [Google Scholar]
- Zhou W, Chow K, Fleming E, and Oh J (2019). Selective colonization ability of human fecal microbes in different mouse gut environments. ISME J. 13, 805–823. [DOI] [PMC free article] [PubMed] [Google Scholar]
- Zmora N, Zilberman-Schapira G, Suez J, Mor U, Dori-Bachash M, Bashiardes S, Kotler E, Zur M, Regev-Lehavi D, Brik RB-Z, et al. (2018). Personalized Gut Mucosal Colonization Resistance to Empiric Probiotics Is Associated with Unique Host and Microbiome Features. Cell 174, 1388–1405. [DOI] [PubMed] [Google Scholar]
- Zock J, Cantwell C, Swartling J, Hodges R, Pohl T, Sutton K, Rosteck P, McGilvray D, and Queener S (1994). The Bacillus subtilis pnbA gene encoding p-nitrobenzyl esterase: cloning, sequence and high-level expression in Escherichia coli. Gene 151, 37–43. [DOI] [PubMed] [Google Scholar]
Associated Data
This section collects any data citations, data availability statements, or supplementary materials included in this article.
Supplementary Materials
Figure S1. Contig read coverages as a function of contig sizes. The plot contained 50000 randomly sampled data points. Related to STAR Methods.
Figure S2. Bayesian inference of evolutionary history. Related to Figure 2 and STAR Methods. A, maximum clade credibility tree annotated with historical transmission events. The colors of the nodes and branches denote the predicted skin sites of the ancestral lineages, while the sizes of the nodes are proportional to the posterior probabilities of the skin site predictions. N=2000 trees were used for final transmission inference. The tree was transformed into a cladogram for better visualization. Arrows illustrate example transmission events from Nares_R to Cheek_L. B, estimated chronological ages of all ancestral nodes in the phylogenetic tree. The ancestral nodes were sorted by their estimated median node age and each unit in the x axis indicated different ancestral nodes. The error bar represents the 95% highest posterior density (HPD) interval. 12–20 founder strains are projected based on nodes having the lower endpoint of the 95% highest posterior probability density older than the host. The labels on the y axis were rescaled for confidentiality. C, negative association between transmission and the diversification of subpopulations. Each data point shows the expected transmission rate (estimated by BEAST) and the FST value between a pair of skin sites. * indicates linear regression lines with significant slopes (p<0.05). The highlighted data points indicate either the umbilicus or toeweb in a pairwise comparison. D, consistency of Bayes factors (upper) and posterior probabilities (lower) supporting pairwise transmission events estimated from two independent MCMC runs.
Figure S3. Spatio-temporal distribution of S. epidermidis functional features. A, shared vs. unique S. epidermidis gene clusters at different time points. Related to Figure 3 and STAR Methods. The total number of time points at which at least one isolate was successfully cultured from the subpopulation is shown on the top of each graph. Subpopulations with significant temporal changes are marked with a “*”. The right index in p0 was marked with a triangle because a limited number of isolates (n=2) were cultured from one of the time points. B, the relationship between sample sizes and p-values of temporal changes. For each given subpopulation (data point), the time point at which the lowest number of isolates (blue) were cultured, the highest number of isolates (red) were cultured, and the total number of isolates cultured across time points (purple) were visualized. C, comparison of p-values of temporal changes including or excluding rare genes. Permutation analyses were run separately with or without filtering out rare genes (defined as those S. epidermidis genes that were present in only one isolate in that subpopulation). Benjamini-Hochberg adjusted p-values of the analyses were then compared to validate that the statistical significance were robust to the presence of rare genes. D, the distribution of S. epidermidis genes with respect to their variability across skin sites (see Figure 3D for subject p0). Example clusters of genes with high variability are highlighted with red boxes (boundaries arbitrarily selected). Skin-site distribution of the genes in each of the highlighted clusters and their prevalence were shown in the heatmaps. Each row in the heatmap represents a unique S. epidermidis gene, and the row and column hierarchical clusters were generated based on Euclidean distances. E, examples of KEGG modules with differential representation across subjects and skin sites (for a full list, see Table S3). Module representation (the proportion of KEGG orthologs in the module present in an isolate) was rescaled proportionally by the mean module representation at each skin site. F, prevalence of predicted BGCs across subjects and skin sites. G, SNP-based gene tree of the nrps and siderophore BGCs and their distribution across subjects and skin sites. The skin site of each BGC-carrying isolate is indicated in green. H, SNP-based gene tree of the terpene BGCs and their distribution across subjects and skin sites. The skin site of each BGC-carrying isolate is indicated in green. I-J, distribution of different types of bacteriocin (G) and lantipeptide (H) BGCs across subjects and skin sites. Each “type” represents BGC sequences clustered at 80% sequence identity. No gene tree was constructed for these BGCs due to the lack of colinear regions.
Figure S4. Spatio-temporal distribution of sister isolates. Related to Figure 4. Each panel shows the number of sister isolates found at different time points (upper) and the total number of skin sites that contained at least one sister isolate from that group (lower).
Figure S5. Distribution of predicted plasmid-encoded ABR genes. Related to Figure 5. A, prevalence of predicted phage sequences (i.e., the proportion of isolates carrying the predicted phage sequences) across subjects and skin sites. The row dendrogram shows the diversity of the predicted phages based on the presence and absence of gene contents, and is colored based on the closest phage reference sequence as predicted by PHASTER. The column hierarchical clusters were generated based on Euclidean distances. B, prevalence of predicted plasmid contigs (that aligned to PLSDB) across subjects and skin sites. The row and column hierarchical clusters were generated based on Euclidean distances. This panel is related to Figure 5A. C, skin-site prevalence of predicted plasmid-encoded ABR genes that were only observed in a single subject. Prevalence was defined as the proportion of isolates in a subpopulation that carried at least one predicted plasmid segment which encoded resistance to the antibiotic in question. D, skin-site prevalence of predicted plasmid-encoded ABR that were observed in at least two subjects. The subjects with no predicted plasmid-encoded resistance to a given antibiotic were shown with increased transparency. Prevalence was defined as the proportion of isolates in a subpopulation that carried at least one predicted plasmid segment which encoded resistance to the antibiotic in question.
Figure S6. Predicted S. epidermidis genes and variants that can affect virulence. Related to Figure 6. A, prevalence of known S. epidermidis virulence genes across subjects and skin sites. B, mutations that split the transmembrane domains of AgrC, as verified with Sanger sequencing. C, genes involved in the TCA cycle pathway, as an example of carbohydrate metabolism genes that showed higher expression levels with the presence of population supernatant in the agr interference experiments.
Figure S7. Association between S. epidermidis gene prevalence and the local skin microbiota. Related to Figure 7 and STAR Methods. A-D, taxonomic and gene content compositions of the skin microbiota. Principal component analyses of the microbiome taxonomic compositions on species level were conducted to illustrate the diversification of skin microbiome compositions across subjects (A) and skin sites (B). The five loading vectors with the largest norms are visualized on the plot (see Table S7 for the rest of the loading vectors). Similarly, principal component analyses of the microbiome gene coverage were conducted to illustrate the diversification of coding potentials of the skin microbiota across subjects (C) and skin sites (D). E, a diagram outlining the training and evaluation of the recursive partitioning tree model. F-H, Given the variability of the S. epidermidis genes across subpopulations (i.e. Pielou’s index of gene prevalence levels, x axis), the prior predictability of the S. epidermidis gene prevalences in the new host (i.e. test set) (F), and the increased predictability when including skin site specification (G) and contextual microbiome features (H) are shown. The top 20 genes that had the greatest increase in predictability when including skin site specification or microbiome features were highlighted in red.
Table S1. Specifications of the S. epidermidis isolates and the shotgun metagenomic samples used in this study. Related to STAR Methods.
Table S2. Specifications of the public S. epidermidis genomes used in this study. Related to STAR Methods.
Table S3. Pfam and Enzyme Commission (EC) classification of the unannotated toeweb-specific genes and KEGG modules that exhibited differential representation across subjects or skin sites. Related to Figure 3.
Table S4. Core genome recombination events, sister isolates, and genes with differential presence among sister isolates. Related to Figure 4.
Table S5. Predicted plasmid-encoded ABR genes annotated using the RGI pipeline. Related to Figure 5.
Table S6. agr variants, population-level interference, and the influence on gene expression. Related to Figure 6.
Table S7. Loading vectors of microbiome species used to generate Figure S7A and S7B. Related to Figure 7 and STAR Methods.
Data Availability Statement
The datasets generated during and/or analyzed during the current study, as well as custom codes to analyze the data, are available from the corresponding author on reasonable request. Genomes will be deposited in Genbank and metagenomic sequence reads in SRA under BioProject PRJNA559376 and PRJNA558989.