Abstract
In this work we present a device that is capable of wireless synchronisation to the MRI pulse sequence time frame with sub-microsecond precision. This is achieved by detecting radio frequency pulses in the parent pulse sequence using a small resonant circuit. The device incorporates a 3-axis pickup coil, constructed using conventional printed circuit board (PCB) manufacturing techniques, to measure the rate of change of the gradient waveforms with respect to time. Using Maxwell’s equations, assuming negligible rates of change of curl and divergence, a model of the expected gradient derivative (slew) vector field is presented. A 3-axis Hall effect magnetometer allows for the measurement of the direction of the static magnetic field in the device co-ordinate frame. By combining the magnetometer measurement with the pickup coil voltages and slew vector field model, orientation and position can be determined to within a precision of 0.1 degrees and 0.1 mm, respectively, using a pulse series lasting 880 μs. The gradient pulses are designed to be sinusoidal enabling the detection of a phase shift between the time frame of the pickup coil digitisation circuit and the gradient amplifiers. Signal processing is performed by a low power microcontroller on the device and the results are transmitted out of the scanner bore using a low latency 2.4 GHz radio link. The device identified an unexpected 40 kHz oscillation relating to the pulse width modulation (PWM) frequency of the gradient amplifiers that is predominantly in the direction of the static magnetic field. The proposed Wireless Radio frequency triggered Acquisition Device (WRAD) enables users to probe the scanner gradient slew vector field with minimal hardware set-up and shows promise for future developments in prospective motion correction.
Keywords: MRI, Pickup, Coil, Wireless, Motion
I. Introduction
AUTHORS have described concomitant (Maxwell) gradient fields and the influence they have on image formation in phase contrast MR [1], non-cartesian MR; such as spiral acquisitions [2], diffusion tensor imaging [3] and low field MR ([4], [5], [6]). In these studies the influence of orthogonal gradient fields superimposed on the static magnetic field is of interest as this results in image distortions. In this work we are concerned with the rate of change of the gradient waveforms with respect to time (slew) in view of its potential application to prospective motion correction. When measuring the rate of change of the magnetic fields within the scanner the temporally stationary static magnetic field falls away making the components orthogonal to the static magnetic field (which produce concomitant fields) and conventional gradient slews equally visible. The slew is therefore a vector quantity that encodes the MRI scanner imaging volume in more than one spatial direction at a time with a single gradient excitation. Theoretically this means that the slew vector more efficiently encodes pose than any nuclear magnetic resonance (NMR) based techniques, such as field cameras [7], which measure the scalar magnitude only.
Although measuring the gradient slew has limited applicability to measuring k-space trajectories, because a double integration is required, it is very useful for the detection of motion. This has been demonstrated by the Endoscout tracking system (Robin Medical, Baltimore, MD) [8]. In the Endoscout implementation a reference dataset is fit to the sensor (pickup coil) signals using a minimisation algorithm, resulting in a complex relationship between the sensor and the output pose variances that change based on location in the scanner bore. To address this challenge we propose combining a slew vector measurement with an observation of the direction of the static magnetic field, allowing a closed form solution to displacement and orientation in the gradient co-ordinate frame. The rate of change of the gradients can be measured by Faraday induction using three mutually orthogonal pickup coils. The hardware used to digitise the pickup potentials effectively introduces new analog to digital (ADC) sampling events defined in the pulse sequence time frame.
It is beneficial to excite the pickup coils with a known gradient waveform as this makes interpreting the measured potential simpler. To minimise any influence that these new gradient excitations have on the parent (imaging) pulse sequence timing, they and the signal acquisition windows need to be kept very short (< 1 ms). As such, precise synchronisation to the imaging pulse sequence is important to ensure correct interpretation of the gradient waveform derivative.
Most modern MRI scanners have optical synchronisation capabilities that allow external events to be triggered at precise intervals as specified by the pulse sequence programmer. Introducing external hardware that require physical connections to the MRI scanner presents new challenges that may affect the imaging work-flow. The Wireless Radio frequency triggered Acquisition Device (WRAD) presented here avoids the use of these synchronisation signals (and the associated cabling). Instead, radio frequency pulses of the parent pulse sequence are detected using a small resonant circuit and used as synchronisation events. The RF detection circuit operates like an inductively coupled marker [9], where the passive detuning was modified to charge a tank capacitor while maintaining effective detuning.
One major advantage of using RF pulses for synchronisation is the ease of portability between different imaging pulse sequences because the RF pulse(s) conveniently define the sequence repetition. The data acquired by the WRAD are transmitted out of the scanner using a bidirectional 2.4 GHz radio link. The relationship between both position and orientation in the gradient co-ordinate frame and the slew vector is then examined.
II. Theory
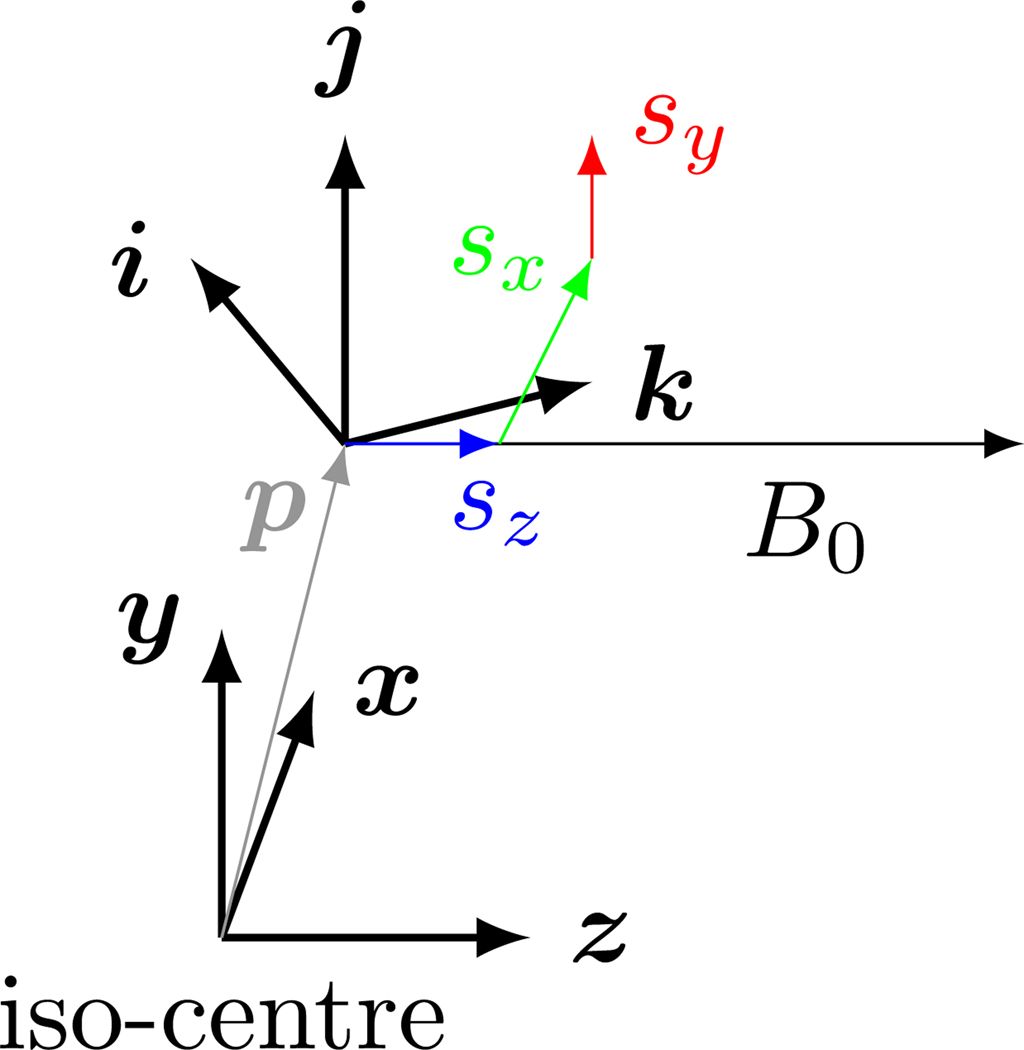
To introduce the concept of 3-dimensional spatial encoding, we first derive a general model of the gradient fields that assumes perfect linearity. Real gradient systems may deviate from this linear model, however these deviations are expected to be small and could be incorporated at a later stage by introducing system specific correction terms. Next, we show how the 3-dimensional encoding can be observed by magnetic induction using an assembly of printed circuit board (PCB) inductors with normal vectors that define the WRAD (ijk) coordinate frame (Figure 1). Finally, we show how the induced voltage vectors can be interpreted using a 3-axis Hall effect magnetometer that observes the direction of the static magnetic field (in the ijk frame).
Fig. 1.
The gradient co-ordinate system (xyz) and the resultant magnetic field at an arbitrary position p. The component parallel to the static magnetic field sz is referred to as conventional gradient slew and the orthogonal terms (sx, sy) are related to the concomitant field. The WRAD measures the slew vector in the frame (ijk). Not drawn to scale.
A. A linear 3-dimensional spatial encoding model
The linearly, spatially varying magnetic flux density (b) can be described by the following model:
| (1) |
where p is the position relative to the iso-centre. The gradient slew vector (s), defined as the scalar derivative of b with respect to time, is then given by:
| (2) |
in which the first term is proportional to the rate of change of the position vector (velocity) and the strength of the gradient field. The second term is caused by the gradient slew. Considering the capabilities of a modern MRI scanner with slew rates of hundreds of Tesla per metre per second and imaging gradient strengths of tens of milli-Tesla per meter it is reasonable to neglect the first term of Equation 2, the second term can then be re-written in matrix form:
| (3) |
The last row represents the slew parallel to the static magnetic field, a desired result of the conventional imaging gradients that spatially manipulate the precession frequency of the spins for image formation. The terms , and are produced by the x, y and z gradient waveforms (gx, gy and gz). Equation 3 can then be constrained, using Maxwell’s equations and the axial symmetry of the z-gradient, to obtain a familiar result [1]:
| (4) |
except in this case it is assumed that the rate of change of curl and divergence are 0. The x and y gradients (Golay) produce slew vector fields that lie parallel to the xz and yz planes, respectively, and encode z displacement orthogonal to the static magnetic field. The z gradient (Maxwell Pair) produces a slew vector field that points radially outwards and uniquely encodes position in all three spatial dimensions.
B. Observing the slew vector using Faraday’s law
The electric field (e) induced in a conductor by a time varying magnetic field can be described as:
which for a planar pickup coil with unit normal n wound in a left handed fashion, results in the induced voltage
| (5) |
In (5) the first term,
| (6) |
is induced by the gradient slew at the position of the centre of the pickup coil, as described by Equation 4. This signal is used for position and orientation encoding. The scalar a is constant and relates to the geometric properties of the pickup coil and incorporates filter and amplifier gains. The second term (vω) results from the angular velocity (ω) of the pickup coil assembly:
| (7) |
Although the gradient flux density is small and can be assumed to be negligible the static magnetic field is exceptionally strong, and the induced voltage can affect results.
This term is therefore approximated as follows:
| (8) |
where, from the derivative of a rotation matrix,
Three mutually orthogonal pickup coils are required to measure the slew vector. The normal vectors n of these coils define the basis set ijk of the WRAD co-ordinate frame (Figure 1). The combined potentials induced in the pickup coils can therefore be written in the following more compact vector form:
| (9) |
where
is a rotation matrix that transforms a vector from the gradient co-ordinate frame (xyz) into the WRAD co-ordinate frame (ijk). Equation 9 shows that the voltage vector induced by the angular velocity of the pickup coils will lie orthogonal to the static magnetic field (parallel to the xy plane).
C. Interpreting the induced voltage using an observation of the direction of the static magnetic field
A 3-axis Hall effect magnetometer allows for a vector observation of the magnetic flux density (m). The sensor is rigidly attached to the pickup coils and is oriented so that its axes align with the WRAD co-ordinate frame. Assuming that the gradients have a negligible influence on the direction of the superposition of magnetic fields, a normalised measurement from this sensor represents the gradient z axis in the WRAD co-ordinate frame:
| (10) |
The normalised magnetometer estimate can then be used to isolate the conventional (sz) gradient spatial encoding from the voltage vector (Equation 9):
| (11) |
Note that the angular velocity has no effect on this result. This equation shows that rigid body motion detection is possible (using only the z component of the voltage vector) with three unique combinations of the x, y and z gradient slews, using a similar principle to NMR marker position tracking [10], except that in this case the instantaneous potential induced by the time varying gradients is measured (no RF excitations of a sample are necessary). To measure orientation, at least three markers are required, and they have to be rigidly constrained relative to each other. The change in orientation is then solved by calculating the transform between the reference and current marker positions [11].
Using only the z component of the voltage vector would be wasteful because the transverse component contains information about the pose and position of the WRAD. To take advantage of the multi-dimensional spatial encoding presented in Equation 4, the voltage vector needs to be transformed into the gradient coordinate frame:
| (12) |
which requires a solution to the transform R. This can be achieved by combining the static magnetic field vector (Equation 10) with an observation of the direction of the earth’s gravitaional field using an accelerometer [12]. In this case the orientation is solved independently of the pulse sequence and a single z gradient pulse will be sufficient for 3-dimensional position encoding. Alternatively, the direction of the slew vector can be used for orientation encoding. This can be interpreted as solving for the basis vectors of the gradient coordinate frame, observed from the WRAD co-ordinate frame [xyz]ijk:
| (13) |
First, a unit vector q is defined that is orthogonal to zijk:
| (14) |
In the above equation, the induced voltage caused by the angular velocity is assumed to be removed through temporal filtering techniques as discussed below. Next, a mutually orthogonal vector r is computed, which completes an orthonormal basis set of a reference frame qrz (observed from the WRAD ijk frame), that shares the gradient z-axis:
| (15) |
Finally, the gradient frame basis vectors can be computed by rotating the qrz frame by an angle α about the z-axis (static magnetic field) so that it aligns with the xyz (gradient) frame:
| (16) |
and:
| (17) |
where from Equation 4:
The components of the position vector (p) required to solve Equations 16 and 17 are determined using Equation 11. For any combination of x and y gradient slews only the sign of pz is required to determine orientation, however the solution is undefined on the plane pz = 0. To determine orientation when , px and py are required. In this case the orientation is undefined along the line px = py = 0, however, three unique gradient slews are necessary (to solve Equation 11 for px and py) or two unique gradient slews if one makes an assumption about the sign of px or py.
III. Methods
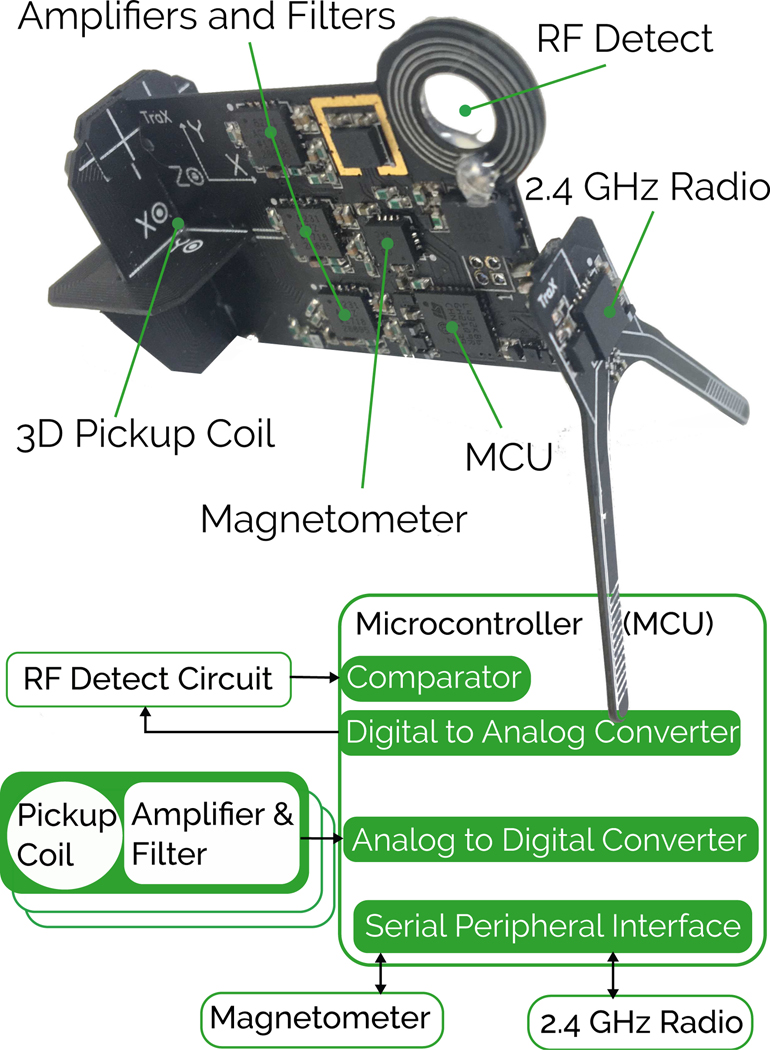
The WRAD hardware was designed and fabricated using standard electronic components, however care was taken in selecting packages that contain minimal nickel. The pulse sequence was implemented on a 3 T Skyra MRI scanner (Siemens, Erlangen, Germany). The device (Figure 2) comprises 5 main circuits:
The RF detection circuit for producing synchronisation pulses.
The analog amplification and filtering circuit for processing the pickup voltages before digitisation.
The 3-axis Hall effect magnetometer (MV2, Metrolab) for measuring the direction of the static magnetic field.
The wireless 2.4 GHz transmission circuit (nRF24L01+, Nordic Semiconductor) to communicate results out of the MRI scanner.
The micro-controller (STM32L431, STMicroelectronics) with built in 12-bit analog digital converter for signal processing and digital communication with the magnetometer and 2.4 GHz radio.
Fig. 2.
The WRAD hardware used to measure the signals presented in this work. The slew vector sensor is constructed from 3 PCB inductors (‘Z’ on the main PCB, ‘X’ and ‘Y’ on separate PCBs) each precisely cut with slots to allow them to be mounted mutually orthogonal to each other, representing the principal axes of the WRAD co-ordinate frame (please note that the silkscreen markings XYZ define the ijk co-ordinate frame of Figure 1).
The 2.4 GHz dipole antenna straddles the bridge of the subject’s nose. This ensures that the main Printed Circuit Board (PCB) lies close to the sagittal plane allowing maximum flux for the 2D RF detection antenna. The microcontroller unit (Fig. 2 - MCU) and analog circuitry are also on the sagittal plane to minimise cross sectional area relative to the nearest RF receiver elements. The device was constructed using a 2-layer 0.6 mm thick printed circuit board, measuring 40 mm over its largest dimension and is powered by a non-magnetic lithium polymer battery (NM651825, Powerstream).
A. RF detection circuit
The resonant marker (Figure 3) comprises a PCB inductor (L) and tuning capacitor (Crf). The resonant circuit was tuned using a circular loop connected to handheld antenna analyser. The high frequency RF signal is rectified using the diodes (D1 and D2, MADP-011048, MACOM) and charging capacitors (C1[1 nF] and C2[1 nF]) which are connected in series, doubling the peak-to-peak AC signal. This configuration is commonly known as a Delon Doubler. The doubled potential (Vd) then charges the tank capacitor C3(10 nF) through R1(1 kΩ). As the diodes become more conductive the capacitance changes, detuning the resonant portion of the circuit. R1 controls the charge current of the capacitor and forms a potential divider with R2(100 kΩ). The selection of R2 controls the discharge rate of C3, adjusting the width of the detection pulse. The Zener diode protects the comparator in case the divided potential (Vc) exceeds the input threshold. A high speed 12-bit Digital to Analog Converter (DAC) connected to the negative terminal of the comparator allows real-time adjustment of the detection threshold. The comparator is built into the microcontroller and has a programmable hysteresis level (set to 15 mV) which, when combined with the low pass nature of the charge circuit, avoids any bouncing of the digital output signal.
Fig. 3.
RF detection circuit used to detune the resonant circuit and rectify high power radio frequency pulses to trigger ADC events.
B. Pickup Coil
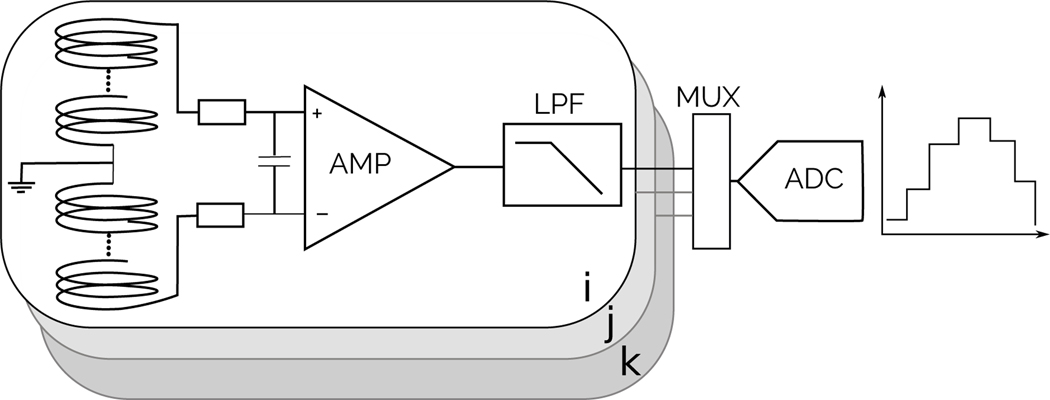
Each pickup coil (Figure 4) was designed with 18 turns, 9 on each side of the PCB with outer dimensions of 20 mm x 15 mm. This corresponds to an approximate geometric scaling factor (Equation 9) of:
| (18) |
where k is the amplifier gain. The instrumentation amplifier (Fig. 4 - AMP, AD8231, Analog Devices) has a programmable gain setting of 1 - 128 in powers of 2, allowing maximised voltage swing for different pulse sequence designs (slew rates). An active analog low pass filter was implemented using the AD8231’s uncommitted op-amp. The 3 pole Butterworth filter with a cut-off frequency of 32 kHz (please refer to the AD8231 data-sheet for an example implementation) is applied to the induced potential before sampling with the microcontroller’s on-board 12-bit ADC at 200 kHz. The first pole, placed before the instrumentation amplifier, is used to eliminate any high frequency signals, such as RF, before amplification. The sample frequency of each of the (i, j and k) pickup coils was chosen to align to the gradient raster period of the scanner (10 μs, for our system) so that two samples correspond to one time step in the MRI scanner’s gradient raster time (NWRAD = 2NGRT). The ADC samples the potential across each pickup coil sequentially using the microcontroller’s onboard multiplexer (MUX, Figure 4) and as a result there is a small fixed delay (25 clocks at 80 MHz) between each of the pickup coil axes.
Fig. 4.
Pickup coil amplification and analog filter circuit.
C. Pulse Sequence Design
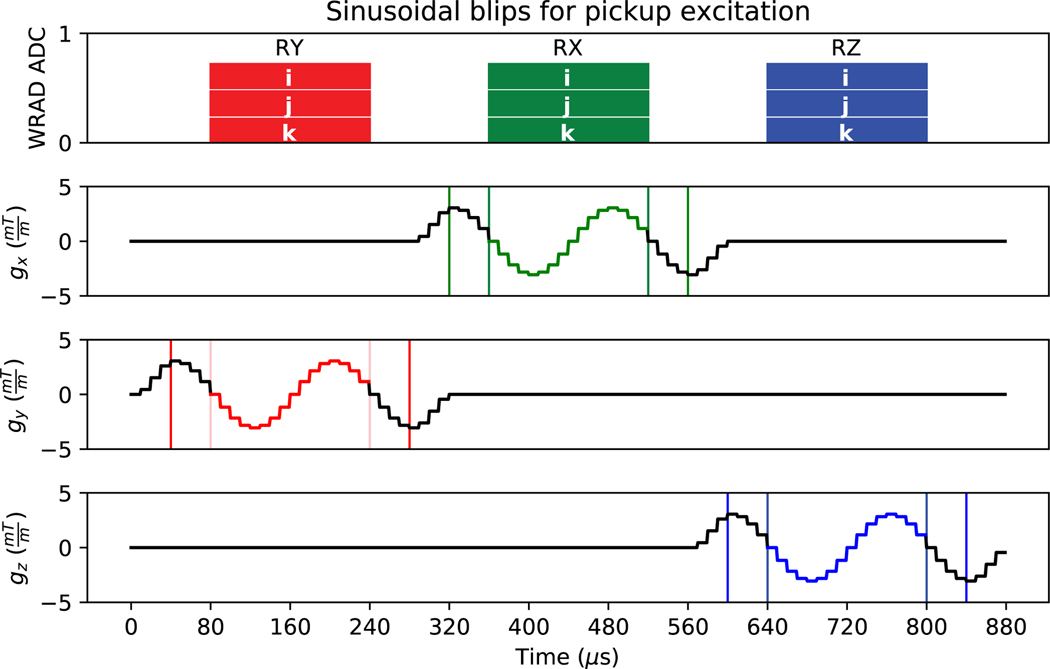
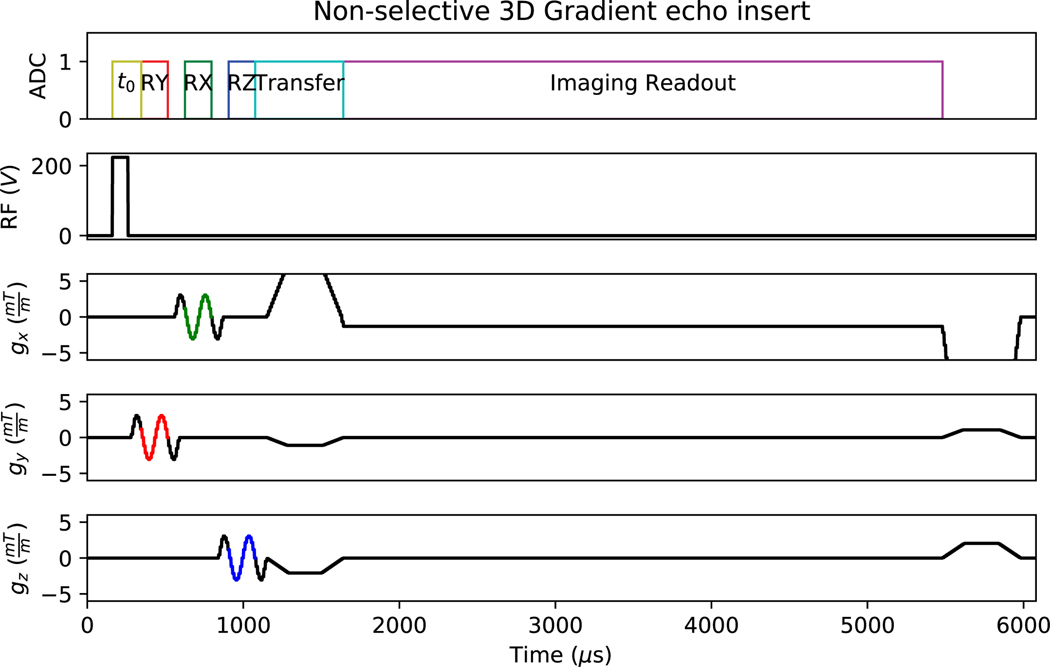
A pulse sequence with sinusoidal waveforms played out in each gradient axis was designed for pickup coil excitation (Figure 5). This allows for the evaluation of the RF detection circuit and the 3-dimensional spatial encoding of each gradient (Equation 4). With a gradient raster time of 10 μs, one revolution/period (at 6.25 kHz) of the gradient excitation has a duration of 16 samples (160 μs). The waveform design ensures perfect symmetry of the discrete waveform with 4 samples for each quarter rotation. An extra quarter rotation before and after each readout window (RX, RY, RZ) ensures the waveform remains sinusoidal if there is an offset between the WRAD sample time and the MRI scanner gradient raster time (40 μs, non-hatched regions Figure 5). The initial and final ramp (quarter rotation) of each waveform is implemented using a shifted cosine function at double the frequency and half the amplitude, to maintain the desired slew rate of the measured excitation. This ensures that the time derivative of the gradient play-out is smooth, allowing for a linear response from the analog filter. All parameters of the waveform are implemented to be user adjustable along with the protocol of the parent pulse sequence. The gradient excitation waveforms are designed to be identical [g(t) = gx(t) = gy(t) = gz(t)]. The MRI scanner therefore produces the following time varying waveform for each readout:
| (19) |
where S is the peak slew rate of the gradient pulse. Since the voltage waveform digitised by the WRAD is captured relative to an internal oscillator (tw) it has a phase shift φ proportional to the offset between the WRAD and gradient time frame δt. Hence,
| (20) |
Fig. 5.
Sinusoidal gradient waveforms lasting a total of 880 μs with highlighted ADC acquisition windows. The hatched regions show the desired ADC timing and the outer bounded regions the maximum allowable timing offset in which the waveforms remain sinusoidal, effectively forming a buffer for any offset between the WRAD and gradient time frames.
The micro-controller treats the data in quarter rotations (Nq = 4NGRT = 8NWRAD) in a similar fashion to the pulse sequence design. A Goertzel filter applied to the data in each readout window isolates the frequency component of the designed waveform . The Goertzel filter is a single bin Discrete Fourier Transform (DFT) that is used to calculate the phase and amplitude of the induced voltage waveform for each readout (RX, RY and RZ) for each pickup coil (i, j and k). Each filter step is computed on a per sample basis so that the result is ready for transmission within 5 μs of the last sample of the final readout (RZ). The filter and pulse sequence design result in a band-pass effect, centred at the gradient waveform frequency. This reduces the influence of angular velocity on the filter result, because subject motion and mechanical vibrations are expected to be negligible at such high frequencies (, Equation 9). Therefore:
| (21) |
where the matrix
| (22) |
is the delay caused by the sequential sampling of the ADC and the analog low pass filter for each of the ijk pickup coils, and φg is the phase offset specific to the gradient used for each readout. To extract the voltage vector from the complex values, the magnitude and sign of each component is required, which for the cosine waveform of Equation 19 is given by:
| (23) |
The slew encoding vector (s) is unique for each gradient coil and is therefore unique for each readout. After apply the Goertzel filter, the 32 samples per pickup coil per readout are represented by a single vector scaled by a constant slew magnitude , which can be substituted into Equation 4, giving:
| (24) |
| (25) |
and:
| (26) |
D. Wireless Transmission
No RF shielding of any of the electronics was implemented as conductive planes may interact with the gradients causing vibration. This could be perceived as unpleasant when mounted on a volunteer’s head and can induce unwanted potentials. This affected the design of the 2.4 GHz antenna, where a ground plane for a monopole antenna was impractical. A V-shaped dipole antenna was therefore designed to fit the form factor of the bridge of the subject’s nose. Due to the strict timing requirements of data transmissions, a proprietary RF protocol (Enhanced Shockburst, Nordic Semiconductor) was implemented, enabling low latency bidirectional communication between the WRAD and a small transceiver (connected to a laptop) placed through the wave guide. The sinusoidal playouts are inserted before the parent sequence readout (Figure 6). The transfer window of 570 μs over the phase encode and pre-wind gradients is sufficiently long for a single 32-byte ‘packet’ transfer from the WRAD to the receiver and 2-byte response, at an air data rate of 2 Mb/s. For better pulse sequence co-existence short burst transmissions are preferable to avoid RF receive events, therefore all signal analysis is done on the WRAD in real-time and only the results are transmitted. For debugging purposes a verbose mode was also implemented to allow real-time visualisation of the excitation waveforms, gradient timing offsets, amplitudes and magnetometer measurements; requiring the transmission of 7 packets per readout (21 packets for each line of k-space if all three readouts are logged).
Fig. 6.
Modification to the gradient echo pulse sequence. The pickup coil excitations are always played out as shown in Figure 5. The parent pulse sequence waveforms can be rotated into any arbitrary phase, read and slice co-ordinate frame. In this case (Readout = x, Phase = y, Slice = z)
E. Experiments
This section describes the experiments used to evaluate the performance of the WRAD. The first experiment was designed to test the functionality of the RF detect circuit. The second, evaluates the 3D pickup coil and amplification circuits. The third looks at the induced voltage waveform integrity and the efficacy of the Goertzel filter. The fourth experiment is designed to test the relationship between the slew vector observations and both position and orientation. In the final experiment the linearity of the gradients is tested along with the ability of the WRAD to determine both position and orientation with only the RX and RZ readouts. For each experiment an amplifier gain (k, Equation 18) of 32 and a peak slew rate (S, Equations 24 - 26) of 60 T/m/s were used
1). RF detect offset:
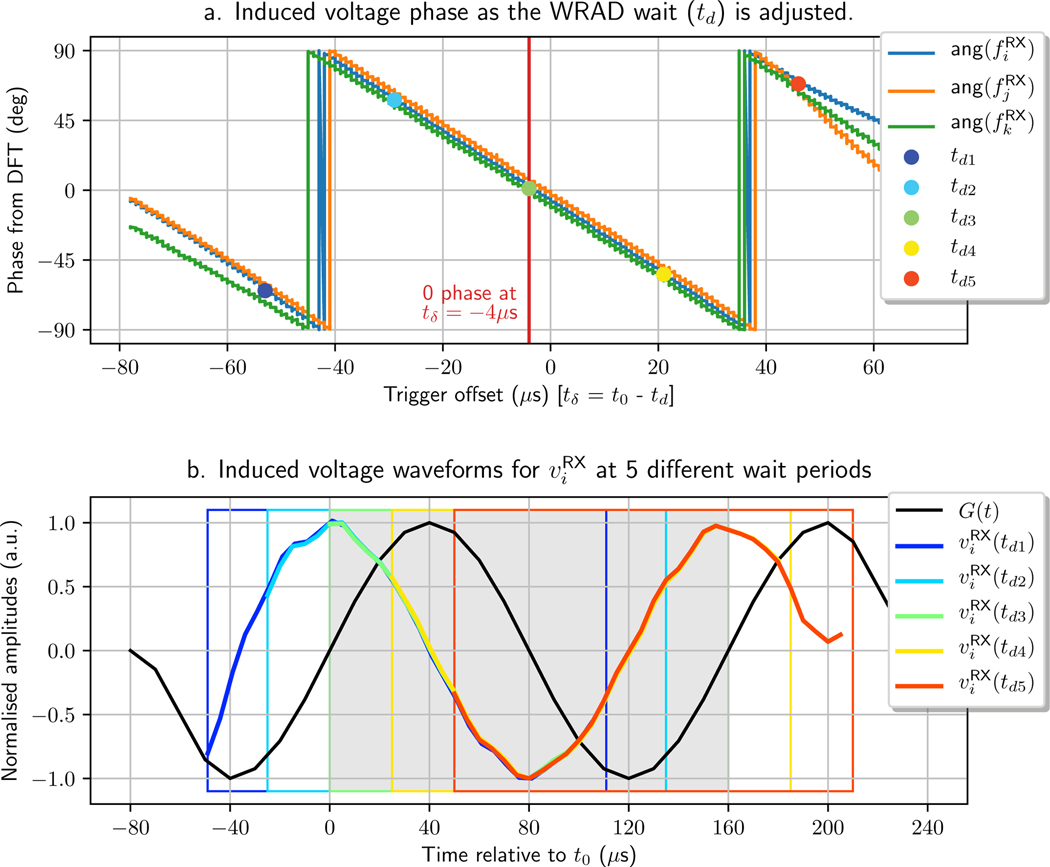
The time between the start of the RF pulse and the first gradient play-out in the pulse sequence design (Figure 6 - t0) is important in configuring the period the WRAD waits between detecting the RF pulse and starting its own ADC readouts (td). A small constant offset between t0 and td is expected, which relates to the time required to meet the comparator threshold and filter delays. By using the bidirectional radio link it is possible to sweep the WRAD ADC window through the gradient playout by adjusting td. At the value of td where the phase of the induced voltage is 0, the difference between t0 and td corresponds to the offset between the two time frames. By applying this offset to td it will then be possible to accurately trigger the WRAD ADC at arbitrary points during the pulse sequence playout.
2). Anisotropy of the slew vector sensor:
To use the voltages measured by the 3D pickup coil assembly for orientation estimates it is important to ensure that the ijk axes are orthogonal to each other and that the amplifier and filter circuits for each axis are linear and have the same gain (they are isotropic). Any imperfections would introduce biases into the observation of the vector directions. To test the 3D pickup coil performance, the WRAD was rotated a full revolution about the centre of the pickup coil assembly around the gradient y-axis with a mostly positive z displacement. The WRAD ijk frame was oriented so that each basis vector was approximately 45 degrees off of the gradient y-axis to project the slew vectors from each gradient pulse over all 3 pickup coils. Since the displacement is constant, each vector should have a constant magnitude and trace a perfect circle (parallel to the xz plane) as the WRAD is rotated; any variations/non-linearities between the pickup axes distort this circle. A parametric representation of a circle on the best fit plane (lease squares), with a radius equal to the mean distance from the axis of rotation, was synthesised for each real data point. The transforms between the synthesised (perfect) data and the real data for each of the pickup coil axes were then determined.
3). Stability:
In a similar position and orientation (offset 45 degrees to the y axis) to the previous experiment, the WRAD was left stationary during the acquisition of 1500 lines of k-space at a repetition time of 60 ms. The voltage waveforms were then transformed from the WRAD frame into the gradient frame by forming a rotation matrix as described by Equations 13 - 17, using the Goertzel filtered voltage vector acquired during the x gradient pulse . In this way we could determine whether imperfections are caused by the WRAD or the gradient system.
4). Position encoding and precision:
This experiment tests the relationship described by Equation 4. The device was attached to a Lego block and then displaced, in 8 mm increments, along the x, then y, and finally the z direction, passing through the iso-centre each time. At each position 100 readouts were acquired. A linear fit of the change in the mean amplitude for a change in position could then be used to scale the standard deviation of the measured voltages to millimetres. The stability of the rotation matrix determined from the slew vector and magnetometer observations was also evaluated. For the series of measurements along the x and y axes, which lie on the plane pz ≈ 0, the slew vector from the z gradient excitation was used to construct R from Equations 16 and 17, where the orthogonal components from Equation 11 are and . Similarly, for the series of measurements along the z axis, where px = py ≈ 0, the x gradient readout was used to construct R, where .
5). Gradient linearity:
For this experiment the WRAD was displaced on a Lego grid. The grid was orientated with its normal approximately 45 degrees from each axis so that each position was a unique combination of displacements along the gradient x, y and z directions. The position of the grid was offset relative to the gradient iso-centre to represent the region around the bridge of the subjects nose; where the WRAD is designed to be placed. In total 42 positions were acquired enclosing a volume within x = (−42, 5) mm, y = (132, 178) mm and z = (−5, 40) mm. We were interested in testing the WRAD’s ability to determine its pose (position and orientation) using information from only two of the readouts, RX and RZ (an optimisation not possible using NMR methods). This can be achieved because, if mounted on the bridge of the subject’s nose, it is safe to assume that the y displacement will always be positive. First, Equation 11 can be used to determine px using the RX readout and the magnetometer observation (zijk),
| (27) |
Next, we find the transverse component of the RZ readout,
and then solve for ,
| (28) |
Where . Finally, Equations 27, 28 and the assumption that py > 0 are combined to solve for the direction of the transverse component of the slew vector for the RZ readout:
| (29) |
It is then possible to calculate the orientation of the WRAD with Equations 16 and 17. The orientation is defined everywhere in the scanner bore except on the line x = y = 0 which is unlikely to occur due to the same reasons mentioned previously (y > 0).
The voltage vectors obtained at each position where rotated into the gradient coordinate frame using this transform. The point grid determined using the vector encoding in the rotated frame were then fit to a perfect grid using a rotation, translation and isotropic scaling factor, in a least squares sense, as described in [11]. The residual error in the fit would therefore be due to non-linearities or anisotropy of the 3-dimensional vector field (not predicted by the model in Equation 4). The relationships between the transverse components and conventional (z) gradient spatial encoding were then evaluated in the (gradient) coordinate frame, that is defined by the above mentioned transform, to give insight into any imperfections.
IV. Results
Without any modifications/connections to the scanner hardware the WRAD was used to obtain the following data.
A. Experiment 1 - RF detect offset
A voltage threshold of 100 mV reliably detects the nonselective RF excitation pulses with a flip angle of 12 degrees (loaded with a 1.9 l cylindrical phantom). The ability to adjust the detection threshold (sensitivity) allows RF pulse detection over a large range of tuning frequencies (Larmor frequency ±10 MHz), making this technique insensitive to drift in component values. It is important to ensure the WRAD samples the slew waveform during the period of the gradient pulse that is sinusoidal (outer bounded region in Figure 5). The delay measurements estimated from the measured voltage phase begin to drift (Figure 7a) when the WRAD trigger offset exceeds 40 μs (90 degrees). The deformations of the waveforms at the start of and the end of (Figure 7b) indicate that the drift is due to overlap of the sinusoidal waveforms (which is expected). Within the readout windows, defined in Figure 5, the waveform phase estimates are very stable, precisely tracking the WRAD wait period adjustments as they are stepped in 1 μs increments (notice the step like nature of the lines in Figure 7a). At a WRAD wait period (td) of 4 μs shorter than the actual pulse sequence timing (t0), the phase shift of the pickup potential is zero. This corresponds to the phase delay caused by the analog filter which was expected to be 6 μs by design; passive component tolerances could have influenced the final implementation. From Figure 7b it is evident that the slight imperfections in the waveforms are consistent even when the trigger period is adjusted to capture different portions of the waveform. Interestingly, they are also symmetric indicating that they are the result of small oscillations of the gradient waveform (these imperfections will be revisited in Experiment 3).
Fig. 7.
(a) During a pulse sequence play-out the WRAD wait period (td) was adjusted in 1 μs increments. (b) 5 flux waveforms from one pickup coil with different ADC trigger delays are plotted in the scanner time frame along with the gradient waveform requested by the pulse sequence design [G(t)].
B. Experiment 2 - Anisotropy of the slew vector sensor
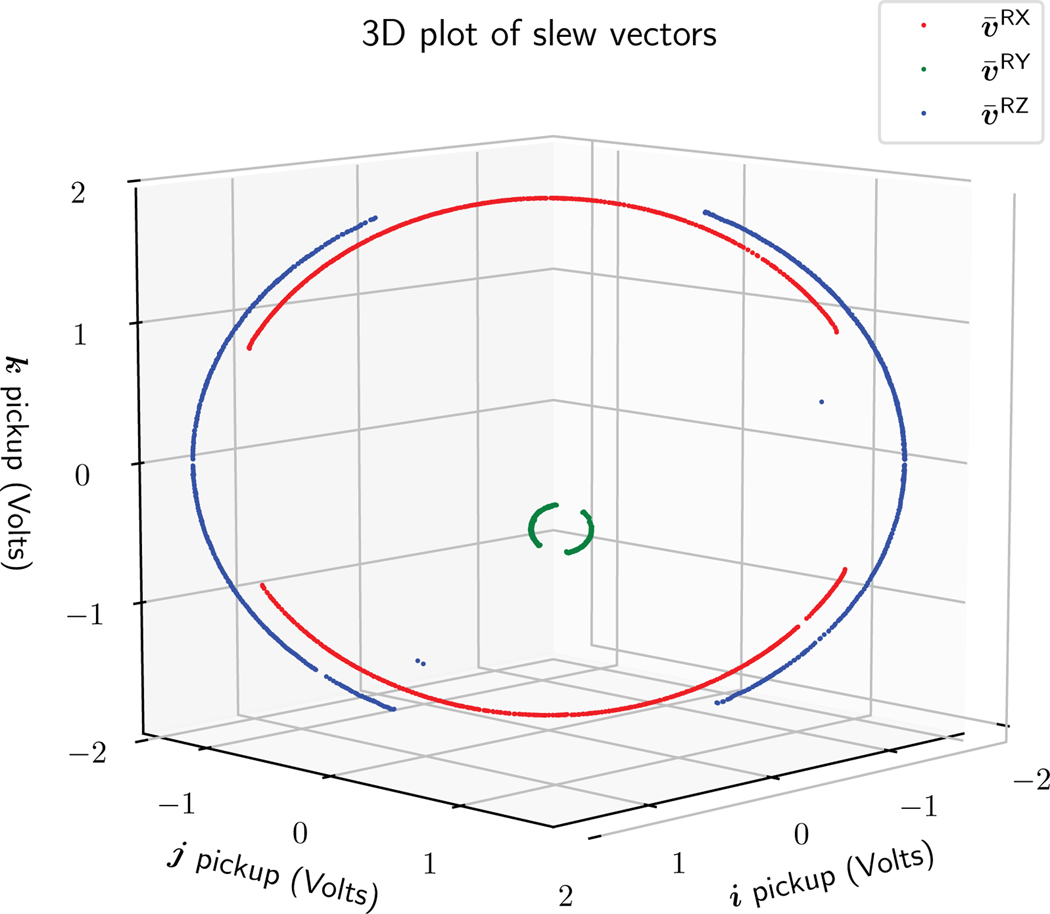
From Figure 8 it appears that the slew vector sensor is close to isotropic because all three readouts trace almost perfect circles. The discontinuous sections (and occasional outliers) of the datasets are regions where the cross sectional area of the planar RF detect coil orthogonal to the static magnetic field was too small to reach the comparator threshold. It was found that higher order models weren’t required to transform the raw data to the synthesised points. A linear fit of each pickup coil voltage to the synthesised (perfect) data produces very small standard errors (Table I). The fitted slopes (column 2) are all very similar with intercepts close to zero, even for which has a small radius. The results show that the 3D pickup coil sensor is highly isotropic. This ensures accurate measurement of the slew vector amplitude and direction independent of the device orientation.
Fig. 8.
The Goertzel filter results for the x [red, ], y [blue, ] and z [green, ] gradient excitations plotted in the WRAD co-ordinate frame.
TABLE I.
Results of linear fit to synthesised points
| readout | coil | slope | intercept (μV) | stderr (μV) |
|---|---|---|---|---|
| i | 0.9979 | −60.02 | 85.04 | |
| j | 0.9981 | 75.38 | 102.60 | |
| k | 1.0008 | −280.16 | 68.58 | |
| i | 1.0029 | 39.51 | 650.32 | |
| j | 1.0033 | −30.20 | 539.93 | |
| k | 0.9914 | −8.24 | 460.63 | |
| i | 0.9983 | −310.58 | 265.26 | |
| j | 0.9985 | 301.91 | 273.31 | |
| k | 1.0037 | −18.05 | 436.35 |
C. Experiment 3 - Stability
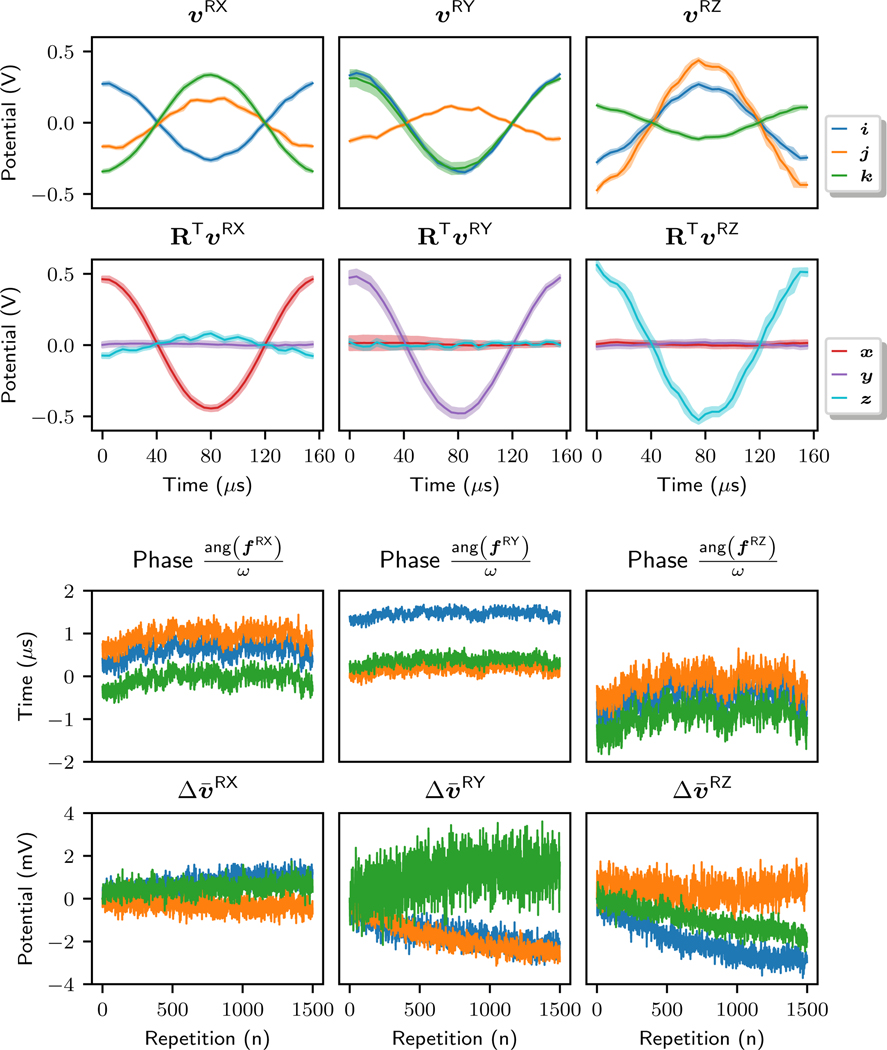
The voltage vector readouts are exceptionally stable over time (Figure 9, top row), however, they do show a small ripplelike distortion, similar to the one identified in Experiment 1. Once the voltage waveforms are transformed into the gradient co-ordinate frame (second row) it becomes clear that the imperfections in the waveform shapes are predominantly in the z axis direction (turquoise). This rules out that they could be the result of high frequency mechanical vibration of the WRAD, because in that case the ripple would be orthogonal to the z axis (vω, Equation 9). In fact, this plot shows that since the x and y components of the voltage waveform are remarkably smooth the vibrations of the WRAD are negligible. The Goertzel filter is therefore only required to filter out low frequency subject motion (that will appear as a constant offset), if the WRAD is used for prospective motion correction. It is also evident that the imperfections are not an artefact caused by the WRAD sampling, because they are independent of the device orientation.
Fig. 9.
Data captured by the WRAD over 1500 lines of k-space at a repetition time of 60 ms. The top two plots show the mean value and shaded area, bounding a region of ±10 standard deviations from the mean, for each sample point of each readout. The (top row) are the raw values captured in the WRAD co-ordinate frame and the (second row) are the raw values transformed into the gradient co-ordinate frame using the magnetometer and x gradient pulse voltage vector to construct R. The bottom two rows show the Goertzel filter result for each voltage waveform. The (third row) shows the phase (scaled to μs) and the (bottom row) is the change in amplitude relative to the start of the scan in millivolts.
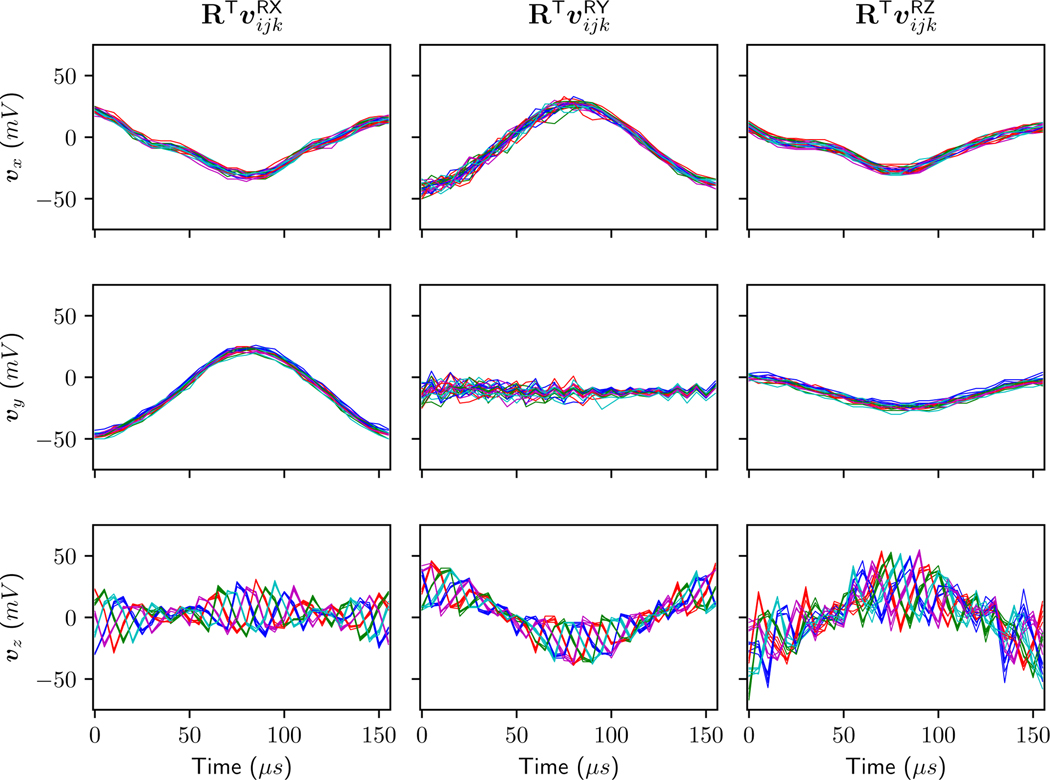
The Goertzel filter is capable of measuring the slight temporal variance in the RF detect trigger period, tracking subtle phase changes that are common to all three readouts (Figure 9, third row). The RF detect circuit does, however, show good stability and achieves better than 1 μs precision. The amplitude estimates have a small asymptotic drift (Figure 9, bottom row) that could be related to heating of the gradient coils. Upon closer inspection, the ripple is at 40 kHz, which is synchronous to the gradient time frame, and is therefore caused by the pulse width modulation (PWM) of the gradient amplifiers. This is an important factor to consider for the pulse sequence design, because if the repetition time (TR) of the pulse sequence is not an integer multiple of 25 μs the phase of the ripple will shift relative to the start of each repetition.
This would result in an increased measurement variance. Figure 10 more clearly illustrates this effect. The WRAD was placed close to the iso-centre and the sequence TR was selected so that a shift of 10 μs occurs. The ripple magnitude is proportional to the slew rate, resulting in the amplitude modulated signature (Figure 10). The voltages induced in the pickup coils during the RY readout also exhibit a small ripple that decays over the first 80 μs (Figure 10, Column 2), however in this case it is not synchronous. This could be related to the RF pulse, because RY is the first of the three readouts (Figure 5).
Fig. 10.
The raw waveforms captured by the WRAD when placed within 2 mm of the iso-centre of the scanner exhibit a 40 kHz ripple. For this data the peak slew rate S was set to 120 T/m/s to more clearly illustrate the switching ripple. The columns represent each of the 3 readouts vRX, vRY and vRZ transformed into the gradient co-ordinate frame (xyz) so that the x, y and z components of the slew vector can be plotted along each row. Every 5th readout is labelled with the same colour. In total 25 readouts are plotted for each of the subplots; 5 of each colour. Notice how repeatable every 5th readout is, aliasing the ripple so that it appears stationary (the plots of each colour overlap with themselves). The component of the slew waveform in the MRI scanner z direction exhibits a more prominent voltage ripple than the other directions, in the form of an amplitude modulated signal.
D. Experiment 4 - Position encoding and precision
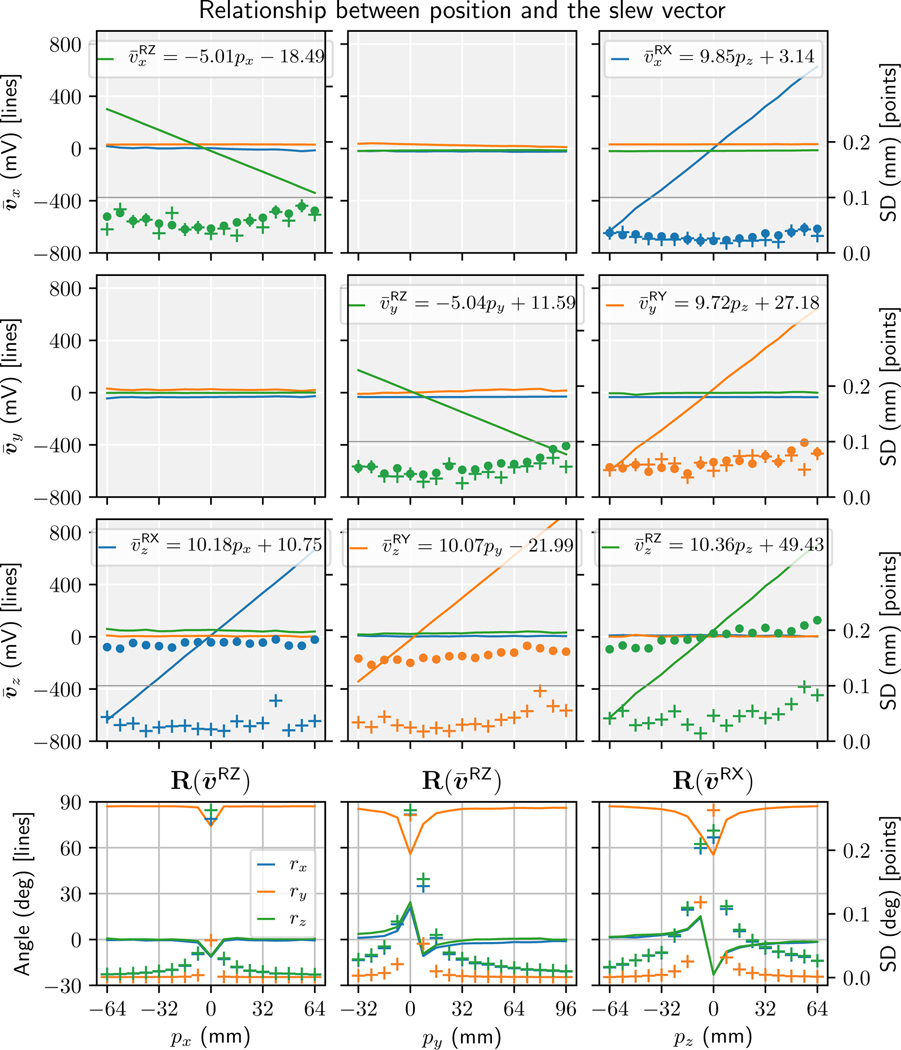
The relationship between position and amplitude is approximately 10 mV/mm (−5 mV/mm for the orthogonal z gradient terms). This corresponds to the pickup coil cross-sectional area of 0.0052 m2, which is similar to the value expected (Equation 18). The data presented in Figure 11 (gray plots) match the position encoding matrix S of Equation 4, however, subtle variations in the slopes of each linear fit are present. These variations are not caused by an imperfection of the WRAD, because the pickup coil gains are uniform (Experiment 2), and are therefore likely caused by gradient non-uniformities. The standard deviations of the position measurements are independent of location in the bore and are less than 0.1 mm. The 40 kHz gradient switching artefact identified in Experiment 3 is also independent of location (notice the constant difference between the cross and dot symbols in Figure 11, third row). This signal is therefore unlikely to originate from current oscillations in the gradient coils themselves. With respect to the orientation (Figure 11, bottom row), the precision and accuracy decrease near the iso-centre where the magnitude of the slew vector is very small. When the distance relative to the iso-centre is greater than 16 mm the precision improves, exhibiting a standard deviation of less than 0.1 degrees.
Fig. 11.
The WRAD was independently displaced along the px (column 1), py (column 2) and pz (column 3) direction in the gradient co-ordinate frame. At each position, 100 samples were acquired to calculate a mean and Standard Deviation (SD). The left axes of the first 3 rows (gray background) are the mean magnitude of the Goertzel filtered data acquired from the x, y and z gradient blips (, and ) and are plotted as lines in green, orange and blue respectively. The vectors are transformed into the gradient (xyz) frame using the rotation matrices derived in the bottom row. The right axes are the standard deviations of the position of the WRAD plotted as markers, pluses (+) are for when the TR was a multiple of 25 μs and dots (·) when the TR results in a phase shift of the 40 kHz gradient ripple. The (bottom row) is the orientation of the WRAD calculated using the direction of the slew voltage and the static magnetic field. Again, the SD at each position is plotted with respect to the right axis (+) except this time as a rotation vector in units of degrees.
E. Experiment 5 - Gradient Linearity
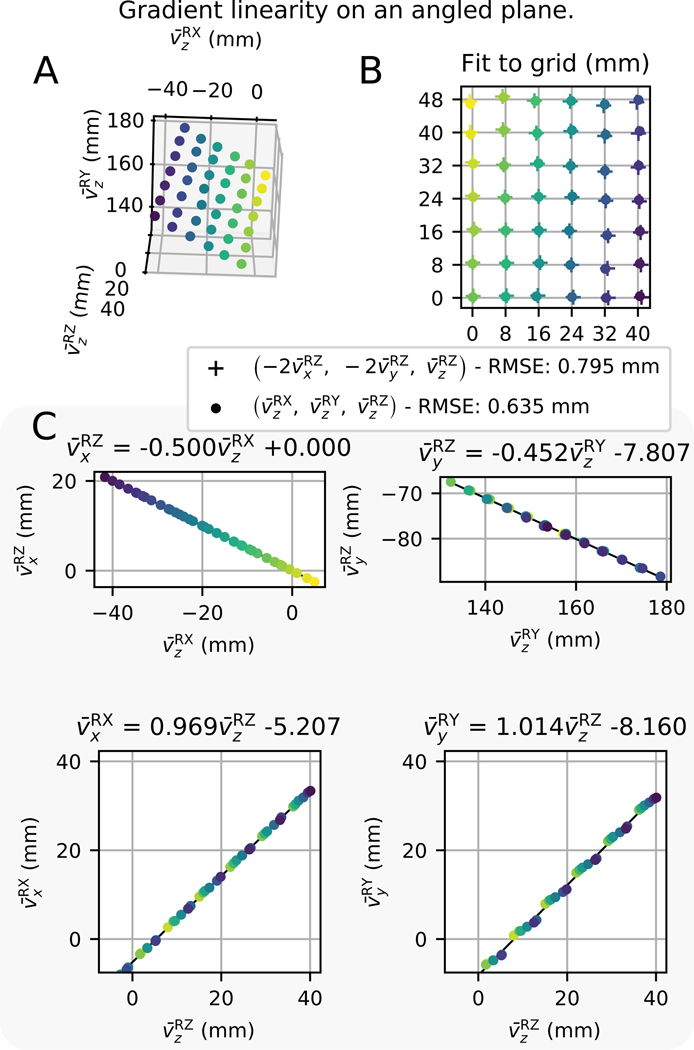
The orientation of the WRAD was determined as (−4.97 ± 0.70, 96.73 ± 0.512, 58.30 ± 0.57) degrees [rotation vector form] over all 42 points (Figure 12A) with a precision better than 0.1 degrees at each location. This allowed interpretation of both the transverse and axial components of the 3-dimensional spatial encoding (Figure 12B). The root mean square error (RMSE) of the position for the 3-dimensional z-gradient encoding (+) is similar to the ‘conventional’ z direction gradient spatial encoding (·) obtained using all 3 gradients. In both cases, the deviations off the grid are random with little evidence of warping and shearing. The relationship between and (Figure 12C - top left) is −0.5 by definition of the rotation matrix (Equation 28). The transverse component of the RZ readout in the y-direction shows the most significant deviation from the model presented in Equation 4 (Figure 12C - Top right). This is likely due to non-orthogonality of the x and y gradient fields. Interestingly, if this slope is used for interpreting the transverse component of the z-gradient encoding the RSME error reduces to 0.639 mm. The y component of the RY readout, which encodes z displacement (Figure 12C - Bottom right), has a slight step like nature that could be due to cross-term interactions.
Fig. 12.
For all the plots, the markers are colour coded with an intensity gradient that scales with displacement in the gradient x-direction. A) Position of the grid in the gradient coordinate frame. B) Result of the rigid fit (and isotropic scaling) of the positions determined by the WRAD using only the RZ readout (+) and the z component of the RX, RY and RZ readouts (·). C) Linear fits of the transverse (orthogonal) components of 3D gradient spatial encoding [horizontal axes] to the axial (parallel to z) component [vertical axes].
V. Discussion
Since the pickup coil excitation waveforms presented are shorter than Free Induction Decay (FID) navigators [13] (2 ms) and can be placed anywhere in the pulse sequence, because they are independent of the MR signal, they will minimally impact the pulse sequence design/duration. Further pulse sequence optimisations are also still possible, such as using only two gradient pulses (Experiment 5) or reducing the readout windows.
The WRAD reliably observes the gradient slew vector field during the excitations using a small 3D pickup coil. This sensor, combined with a 3-axis Hall effect magnetometer enables pose estimates from a single device that meet the precision requirements for prospective motion correction of high resolution images [14] (from a fifth to a tenth of the voxel size).
The measured slopes of Experiments 4 and 5 are well matched to what was expected without any knowlege of the gradient performance (Equation 18). This suggests that, like NMR marker based methods ([15], [16]), the use of gradient spatial encoding will alleviate cross calibration challenges associated with optical based motion tracking [17] and the current Endoscout implementation [8]. This does, however, come with the disadvantage that gradient non-uniformities can introduce biases when the WRAD is placed far from the iso-centre. Prospective motion correction has, however, been shown to be robust to biases on the order of a few millimetres [18]. Interestingly, the z component of the slew vector encoding is unaffected by the Maxwell terms that necessarily introduce non-linearities in the form of the ‘concomitant’ field for NMR position encoding. The slew vector encoding is, however, sensitive to other effects.
Due to the way in which the parallel and orthogonal components of the slew vector are interpreted, any slight misalignment between the magnetometer and 3D pickup coil could result in the projection of biases into the position estimate, which can also affect accuracy. The three independent vectors obtained from the 880 μs long excitation pulse series are well suited to sensor fusion techniques (eg. Kalman filter) where magnetometer biases could be tracked and corrected in real time. The use of the RF detect circuit as an inductively coupled marker [9] for high speed navigators is also possible; providing more information for the sensor fusion.
Although a 2.4 GHz radio can slightly degrade the signal to noise ratio of nearby receive coils and both the PCB and battery cause some RF shading, it has been shown that RF noise and spike quality assurance tests can be passed with continuous transmissions from within the receive coil [19]. The WRAD allows for smarter co-existence of the electronics with the MRI scanner, because it is able to detect pulse sequence timing, enabling control of when data transmissions occur or powering down oscillators to avoid overlap with the imaging ADC events. Smart sampling of high bandwidth sensors vulnerable to gradient pulses can also be achieved. This would be beneficial to combined MR-EEG/MR-ECG experiments. The presence of electronics within the RF coil can also influence the homogeneity of the static magnetic field in close proximity to the device [12]. This could be improved through further miniaturisation and the use of MR compatible passive components (that will increase the cost).
The orthogonal components of the slew vector produced by the gradients are cleaner than the components parallel to the static magnetic field. The 40 kHz gradient switching ripple observed in Experiment 3 has a significant effect on the interpretation of the induced voltages (position and orientation measurement), however, with regards to image formation, the maximum amplitude of 57 mT/s (25 mV - Figure 10) would result in a negligible phase ripple amplitude of 0.0006 rad. This high sensitivity to rapidly changing fields, and ability to directly observe off axial (concomitant) fields, could be complementary to NMR based field monitoring techniques [7]. Detecting the phase of the ripple could also be used for synchronisation, where sinusoidal pulses are not viable. Accurate timing of the MRI scanner gradients is important in obtaining the k-space trajectories envisioned by the pulse sequence programmer, especially in sequences like radial and EPI [20]. This is particularly relevant to prospective motion correction where the orientation of the field of view is adjusted during the image acquisition. By analysing the phase of the pulse trains relative to each RF pulse, compensation of gradient anisotropy may be possible.
The conveniently small and ‘plug and play’ nature of this technique allows researchers to easily capture the rate of change of the gradients during MRI experiments with minimal hardware set up and preparation. Interpreting these waveforms for position and orientation encoding can offer an exciting alternative to existing prospective motion correction methods.
Acknowledgments
This work was supported in part by the National Institutes of Health under grants R01HD085813, R01HD093578, R21AG046657, R01HD071664 and R21MH096559, the Bertarelli Foundation, the NRF/DST through the South African Research Chairs Initiative and the University of Cape Town through the RCIPS Explorer fund EX15-009
Contributor Information
Adam van Niekerk, Department of Human Biology, Biomedical Engineering, University of Cape Town, South Africa..
Ernesta Meintjes, Department of Human Biology, Biomedical Engineering, University of Cape Town, South Africa..
Andre van der Kouwe, Athinoula A. Martinos Center, Massachusetts General Hospital, Charlestown, MA, United States and Radiology, Harvard Medical School, Boston, MA, United States..
References
- [1].Bernstein MA, Zhou XJ, Polzin JA, King KF, Ganin A, Pelc NJ, and Glover GH, “Concomitant gradient terms in phase contrast MR: Analysis and correction,” Magnetic Resonance in Medicine, vol. 39, no. 2, pp. 300–308, February 1998. [Online]. Available: http://doi.wiley.com/10.1002/mrm.1910390218 [DOI] [PubMed] [Google Scholar]
- [2].King KF, Ganin A, Zhou XJ, and Bernstein MA, “Concomitant gradient field effects in spiral scans,” Magnetic Resonance in Medicine, vol. 41, no. 1, pp. 103–112, January 1999. [Online]. Available: http://doi.wiley.com/10.1002/%28SICI%291522-2594%28199901%2941%3A1%3C103%3A%3AAIDMRM15%3E3.0.CO%3B2-M [DOI] [PubMed] [Google Scholar]
- [3].Baron CA, Lebel RM, Wilman AH, and Beaulieu C, “The effect of concomitant gradient fields on diffusion tensor imaging,” Magnetic Resonance in Medicine, vol. 68, no. 4, pp. 1190–1201, October 2012[Online]. Available: http://doi.wiley.com/10.1002/mrm.24120 [DOI] [PubMed] [Google Scholar]
- [4].Norris DG and Hutchison JM, “Concomitant magnetic field gradients and their effects on imaging at low magnetic field strengths,” Magnetic Resonance Imaging, vol. 8, no. 1, pp. 33–37, January 1990. [Online]. Available: https://www.sciencedirect.com/science/article/pii/0730725X9090209K [DOI] [PubMed] [Google Scholar]
- [5].Volegov P, Mosher J, Espy M, and Kraus R, “On concomitant gradients in low-field MRI,” Journal of Magnetic Resonance, vol. 175, no. 1, pp. 103–113, July 2005. [Online]. Available: https://www.sciencedirect.com/science/article/pii/S1090780705001126 [DOI] [PubMed] [Google Scholar]
- [6].Nieminen JO and Ilmoniemi RJ, “Solving the problem of concomitant gradients in ultra-low-field MRI,” Journal of Magnetic Resonance, vol. 207, no. 2, pp. 213–219, December 2010. [Online]. Available: https://www.sciencedirect.com/science/article/pii/S1090780710002806 [DOI] [PubMed] [Google Scholar]
- [7].Dietrich BE, Brunner DO, Wilm BJ, Barmet C, Gross S, Kasper L, Haeberlin M, Schmid T, Vannesjo SJ, and Pruessmann KP, “A Field Camera for MR Sequence Monitoring and System Analysis,” Magn Reson Med, vol. 75, pp. 1831–1840, 2016. [Online]. Available: https://pdfs.semanticscholar.org/d9c3/f438664d3ca4a51bdf02a185ed8c07f86be4.pdf [DOI] [PubMed] [Google Scholar]
- [8].Nevo E, “Method and apparatus to estimate location and orientation of objects during magnetic resonance imaging,” feb 2003. [Online]. Available: http://www.google.com/patents/US6516213
- [9].Ooi MB, Aksoy M, Maclaren J, Watkins RD, and Bammer R, “Prospective motion correction using inductively coupled wireless RF coils.” Magnetic Resonance in Medicine, June 2013. [Online]. Available: http://www.ncbi.nlm.nih.gov/pubmed/23813444 [DOI] [PMC free article] [PubMed] [Google Scholar]
- [10].Derbyshire JA, Wright GA, Henkelman RM, and Hinks RS, “Dynamic scan-plane tracking using MR position monitoring,” Journal of Magnetic Resonance Imaging, vol. 8, no. 4, pp. 924–932, July 1998. [Online]. Available: http://doi.wiley.com/10.1002/jmri.1880080423 [DOI] [PubMed] [Google Scholar]
- [11].Umeyama S, “Least-squares estimation of transformation parameters between two point patterns,” IEEE Transactions on Pattern Analysis and Machine Intelligence, vol. 13, no. 4, pp. 376–380, April 1991. [Online]. Available: http://ieeexplore.ieee.org/document/88573/ [Google Scholar]
- [12].van Niekerk A, van der Kouwe A, and Meintjes E, “A Method for Measuring Orientation Within a Magnetic Resonance Imaging Scanner Using Gravity and the Static Magnetic Field (VectOrient),” IEEE Transactions on Medical Imaging, vol. 36, no. 5, pp. 1129–1139, May 2017. [Online]. Available: http://ieeexplore.ieee.org/document/7833109/ [DOI] [PMC free article] [PubMed] [Google Scholar]
- [13].Wallace TE, Afacan O, Waszak M, Kober T, and Warfield SK, “Head motion measurement and correction using FID navigators,”Magnetic Resonance in Medicine, July 2018[Online]. Available: http://doi.wiley.com/10.1002/mrm.27381 [DOI] [PMC free article] [PubMed] [Google Scholar]
- [14].Maclaren J, Speck O, Stucht D, Schulze P, Hennig J, and Zaitsev M, “Navigator accuracy requirements for prospective motion correction,” Magnetic Resonance in Medicine, vol. 63, no. 1, pp. NA–NA, January 2009. [Online]. Available: http://doi.wiley.com/10.1002/mrm.22191 [DOI] [PMC free article] [PubMed] [Google Scholar]
- [15].Haeberlin M, Kasper L, Barmet C, Brunner DO, Dietrich BE, Gross S, Wilm BJ, Kozerke S, and Pruessmann KP, “Real-Time Motion Correction Using Gradient Tones and Head-Mounted NMR Field Probes,” Magnetic Resonance in Medicine, vol. 660, no. 74, pp. 647–660, 2015. [DOI] [PubMed] [Google Scholar]
- [16].Aranovitch A, Haeberlin M, Gross S, Dietrich BE, Wilm BJ, Brunner DO, Schmid T, Luechinger R, and Pruessmann KP, “Prospective motion correction with NMR markers using only native sequence elements,” Magnetic Resonance in Medicine, vol. 79, no. 4, pp. 2046–2056, April 2018. [Online]. Available: http://doi.wiley.com/10.1002/mrm.26877 [DOI] [PubMed] [Google Scholar]
- [17].Zaitsev M, Dold C, Sakas G, Hennig J, and Speck O, “Magnetic resonance imaging of freely moving objects: prospective real-time motion correction using an external optical motion tracking system.” NeuroImage, vol. 31, no. 3, pp. 1038–50, July 2006. [Online]. Available: http://www.ncbi.nlm.nih.gov/pubmed/16600642 [DOI] [PubMed] [Google Scholar]
- [18].Maclaren J, Aksoy M, Ooi MB, Zahneisen B, and Bammer R, “Prospective motion correction using coil-mounted cameras: Cross-calibration considerations,” Magnetic Resonance in Medicine, vol. 79, no. 4, pp. 1911–1921, April 2018. [Online]. Available: http://doi.wiley.com/10.1002/mrm.26838 [DOI] [PMC free article] [PubMed] [Google Scholar]
- [19].van Niekerk A, Meintjes E, and van der Kouwe AJW, “Implementation of a 2.4 Ghz Wireless sensing platform for transmission of motion data from within the head coil at 3T.” in Proceedings of the 25th Annual Meeting of the International Society of Magnetic Resonance in Medicine Honolulu, USA: Wiley, 2017, p. Program number: 0784. [Online]. Available: http://indexsmart.mirasmart.com/ISMRM2017/PDFfiles/0784.html [Google Scholar]
- [20].Reeder SB, Atalar E, Faranesh AZ, and McVeigh ER, “Referenceless interleaved echo-planar imaging.” Magnetic resonance in medicine, vol. 41, no. 1, pp. 87–94, January 1999. [Online].Available: http://www.ncbi.nlm.nih.gov/pubmed/10025615 http://www.pubmedcentral.nih.gov/articlerender.fcgi?artid=PMC2396321 [DOI] [PMC free article] [PubMed] [Google Scholar]


