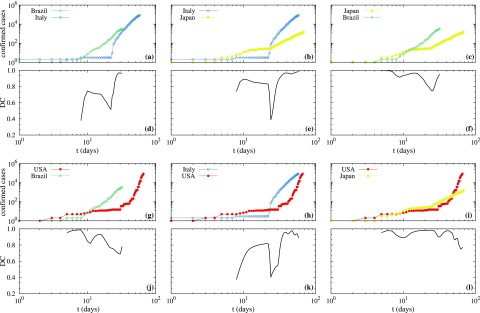
FIG. 2.
In panels (a), (b), (c), (g), (h), and (i) the log–log plot of the cumulative numbers of confirmed infected cases as a function of time is presented for the possible pairs of countries formed between Brazil, Italy, Japan, and USA. The semi-log plot of DC calculated between these pairs of countries is presented in panels (d), (e), (f), (j), (k), and (l), respectively.

