PLOS One logoLink to PLOS One
. 2020 Apr 30;15(4):e0231977. doi: 10.1371/journal.pone.0231977

Reduced cellular binding affinity has profoundly different impacts on the spread of distinct poxviruses

Erica B Flores 1, Mee Y Bartee 1, Eric Bartee 1,*
Editor: Luis M Schang2
PMCID: PMC7192435  PMID: 32352982

Abstract

Poxviruses are large enveloped viruses that replicate exclusively in the cytoplasm. Like all viruses, their replication cycle begins with virion adsorption to the cell surface. Unlike most other viral families, however, no unique poxviral receptor has ever been identified. In the absence of a unique receptor, poxviruses are instead thought to adhere to the cell surface primarily through electrostatic interactions between the positively charged viral envelope proteins and the negatively charged sulfate groups on cellular glycosaminoglycans (GAGs). While these negatively charged GAGs are an integral part of all eukaryotic membranes, their specific expression and sulfation patterns differ between cell types. Critically, while poxviral binding has been extensively studied using virally centered genetic strategies, the impact of cell-intrinsic changes to GAG charge has never been examined. Here we show that loss of heparin sulfation, accomplished by deleting the enzyme N-Deacetylase and N-Sulfotransferase-1 (NDST1) which is essential for GAG sulfation, significantly reduces the binding affinity of both vaccinia and myxoma viruses to the cell surface. Strikingly, however, while this lowered binding affinity inhibits the subsequent spread of myxoma virus, it actually enhances the overall spread of vaccinia by generating more diffuse regions of infection. These data indicate that cell-intrinsic GAG sulfation plays a major role in poxviral infection, however, this role varies significantly between different members of the poxviridae.

Introduction

Successful binding of a virion to a host cell is the first step in initiating any viral replication cycle. For many viral families, the impact of this step is well known. For members of the poxviridae, however, it remains somewhat poorly understood. In a large part, this is due to the fact that specific cellular receptors involved in poxviral adsorption have never been identified. Instead, poxviral binding is thought to be mediated by ubiquitously expressed, negatively charged molecules on the surface of host cells [1]. The best studied examples of this are the proteoglycans, which are comprised of glycosaminoglycan (GAG) side-chains covalently attached to any number of core proteins. The GAG portions of these proteoglycans are characterized by repeating disaccharide units which are uniquely modified through a sequence of enzymatic reactions which regulate their ability to influence a wide variety of biological functions, including: proliferation, migration, cell adhesion, differentiation, and morphogenesis [25]. One of the key post-translational modifications undergone by GAGs is sulfation [6]. This modification occurs in several GAG families, including: heparin sulfate (HS), chondroitin sulfate and dermatan sulfate, and imparts a large negative charge to GAGs on the cell surface. While GAG sulfation is associated with a variety of critical cellular functions, a number of viruses, including: dengue virus, herpes simplex virus, hepatitis B virus, respiratory syncytial virus, and members of the poxviridae [710], have also coopted the negative charge it produces as a means to enhance viral adsorption. This interaction is thought to be mediated by positively charged viral membrane or capsid proteins engaging in electrostatic interactions with the negative charge associated with sulfated GAG moieties.

Specifically within the poxviridae, several viral envelope proteins from vaccinia virus (VACV) have been identified that bind to sulfated cell surface GAGs including A27L and H3L which bind specifically to HS and D8L which binds to chondroitin sulfate [1113]. Genetic loss of these viral genes results in lower infectivity, reduced production of infectious progeny, and smaller plaque sizes [13] while pharmacological blockade of the electrostatic virion:GAG interaction using soluble HS can largely prevent poxviral infection [11, 14]. Critically, however, no studies have examined the impact of GAG sulfation on poxviral replication from a cell-intrinsic view. In order to understand how this sulfation impacts the poxviral replication cycle, we therefore established sulfation deficient cells and examined how loss of this GAG modification impacted the replication cycles of two model poxviruses, the classic orthopoxvirus VACV as well as the leporipoxvirus myxoma (MYXV).

Materials and methods

Reagents and viruses

MYXV (strain Lausanne) expressing green fluorescent protein (GFP) under regulation of the consensus poxviral synthetic early/late promoter has been previously described [15]. VACV (strain WR) expressing GFP was a kind gift from Dr. Paula Traktman at the Medical University of South Carolina. Unless otherwise noted, viral infections were carried out by inoculating cells with the indicated viral multiplicity of infection (MOI) for one hour and subsequently replacing inoculum with fresh growth media. Direct labeling of MYXV and VACV virions with Cy5 was done as previously described [14]. BSC40 cells (Cat# CRL-2761) were purchased from American Type Culture Collection (ATCC, Manassas, VA, USA). B16/F10 cells were a kind gift form Dr. Chrystal Paulos at the Medical University of South Carolina. All cells were maintained in Dulbecco’s Modified Eagle Medium (DMEM, Mediatech, Inc., Manassas, VA, USA) supplemented with 10% fetal bovine serum (VWR, Radnor, PA, USA) and 100 U/ml penicillin-streptomycin (Mediatech, Inc., Manassas, VA, USA). The following antibodies were used in these studies. For flow cytometry: sulfated heparin (clone F58-10E4, AMS Biotechnology, Cambridge, MA, USA). Direct conjugation of the 10E4 antibody to PE/Cy7 was done using the PE/Cy7 conjugation kit (ab102903, Abcam, Cambridge, UK) according to manufacturer recommendations. For western blot: NDST1 (clone E-9) and actin (clone I-19) (Santa Cruz Biotechnology, Inc., Dallas, TX, USA).

Generation of NDST deficient cells

N-Deacetylase and N-Sulfotransferase-1 (NDST1) deficient B16/F10 cell lines were generated using the CRISPR/Cas9 system (Genscript, Piscataway, NJ, USA) as previously described [16]. In short, B16/F10 cells were transfected with the plasmid pSpCas9BB-24-2A-Puro containing a NDST1 specific gRNA (seq AAGCCACGGCGGTACCGGGC). 48 hours after transfection, cells were transferred to media containing 1μg/ml puromycin for one week to select for transfected cells. Cells were then removed from selective media and single cells were expanded as individual clonal lines. For these experiments, two clones were used, referred to as NDST1-/- #1 and NDST1-/- #2. Control B16/F10 cells expressing NDST1 (NDST1+) treated with a scrambled gRNA (seq GCGAGGTCTTCGGCTCCGCG) have been described previously [16].

Quantitative PCR (qPCR)

mRNA was extracted from cells using the RNEasy kit (Qiagen, Hilden, Germany) and cDNA was synthesized using the Superscript IV VILO™ master mix kit (ThermoFisher Scientific, Waltham, MA, USA) according to manufacturer’s recommendations. Synthesized cDNA was them mixed with the PowerUp™ SYBR™ Green master mix kit (ThermoFisher Scientific, Waltham, MA, USA) and abundance of target transcripts detected on a CFX96™ Real-Time System (Bio-Rad, Hercules, CA, USA). Data was analyzed with the accompanying Bio-Rad CFX Manager™ software. Viral genomes were extracted using the Quick-DNA™ Miniprep Plus Kit and were detected by the same methods mentioned previously. Amplified products were analyzed by gel electrophoresis to ensure specificity. PCR primers used in this study are shown in Table 1.

Table 1. List of primers used in this study.

qPCR Primer Sequences
  Forward Reverse
NDST-1 CCCACTGGTGCTGGTATTT TGCAATCTCTGTCCGGTATTT
MO55 ACGGACATCTCTCCCAGACA TGCACGTCGGGTTTATTTGC
MO85 ACGGCATTTAACAACCAGCG CATCGCACGATCTCGGAGTA

Flow cytometry analysis

Cells were harvested and washed several times with PBS to remove residual media before incubation with virus/antibody for 30 min at 4°C. After additional washes, cells were resuspended in 2% paraformaldehyde (PFA) and samples were analyzed on a BD FacsVerse cytometer (BD Biosciences, San Jose, CA, USA).

Analysis of viral replication cycle

Direct binding of virus to the cell surface [14], intracellular single-step growth curves [17], and initiation of viral infection [18] were analyzed as previously described. Viral foci/plaque size was determined by drawing a region of interest around the outermost GFP+ cells within a specific infection and subsequently calculating the area of that region using ImageJ software. Examples of regions drawn to analyze foci/plaque area are included as S1 Fig. To account for variation within measuring, analysis was done on numerous foci/plaques across several independent experiments. Viral foci/plaque formation under methyl cellulose was analyzed by adding 2ml of DMEM containing methyl cellulose directly after removal of viral inoculum.

Results

Loss of NDST1 prevents sulfation of cell surface heparin

There are four NDST enzymes involved in heparin sulfation [19], however, removal of NDST1 alone has been shown to be sufficient to completely prevent GAG sulfation [20]. To investigate the impact of cell-intrinsic GAG sulfation on poxviral replication we therefore generated cells unable to express NDST1 due to CRISPR/Cas9 genomic editing. B16/F10 cells (which express endogenous NDST1 and NDST2, but not NDST3 or NDSTD4 S2 Fig) were transfected with a plasmid expressing the CRISPR/Cas9 enzymes as well as a gRNA targeting the NDST1 open reading frame. Following puromycin selection, two putative clonal NDST1-/- cell lines (NDST1-/- #1 and NDST1-/- #2) were grown from individual, isolated cells. A control NDST1 expressing clonal line (NDST1+) was previously generated following identical treatment of cells with a plasmid expressing CRISPR/Cas9 and a scrambled gRNA [16]. Consistent with the mechanisms of CRIPSR/Cas9 editing, qPCR analysis performed on cDNA synthesized from NDST1+ cells or either NDST1-/- cell line identified similar levels of NDST1 transcript (Fig 1A). In contrast, western blot analysis showed a complete loss of NDST1 protein expression in NDST1-/- #1 and a near complete loss in NDST1-/- #2 (Fig 1B). This loss of NDST1 protein expression did not obviously affect the overall morphology of the cells (Fig 1C) and did not change cellular growth rates over a 96-hour period (Fig 1D). Both NDST1 deficient cell lines, however, displayed a drastic decrease in staining with the commercial 10E4 antibody, which specifically recognizes a sulfated epitope on heparin sulfate chains (Fig 1E).

Fig 1. Generation of cells deficient in sulfation of cell surface heparin chains.

Fig 1

(A) PCR analysis of NDST1 mRNA expression in NDST1+ and NDST1 deficient cell lines. Bar graph shows quantitative data from real-time PCR analysis. Qualitative agarose gel is shown for visual purposes. (B) Western Blot analysis was performed using the indicated antibodies to detect expression of NDST1. Expression of actin is shown as a loading control. Data is representative of two independent experiments. (C) Phase contrast images of NDST1+ and deficient cells depicting general overall cellular morphology. (D) Cell growth of both NDST1+ and deficient cells measured over a 96-hour period. Data is representative of two independent experiments. (E) Sulfation of cell surface heparin measured via flow cytometry utilizing an antibody that recognizes the sulfated 10E4 epitope on HS chains. The mean fluorescent intensity (MFI) values were then normalized to NDST+ values to show the relative change in the NDST-/- cell lines. Data is representative of three independent experiments. Statistical significance was determined using Students T-Test. *** = p<0.001.

NDST1-/- cells show a reduced affinity for poxviral binding

In order to determine whether the loss of heparin sulfation affects the poxviral replication cycle, we first assayed the direct binding of two model poxviruses, the classical orthopoxvirus VACV as well as the leporipoxvirus MYXV, to both NDST1+ and NDST1-/- cells. Cells were incubated on ice with virions directly labeled with fluorescent Cy5 dye. Cells were then washed to remove unbound virions and the amount of virus bound to the cell surface was analyzed by detecting Cy5 fluorescence using flow cytometry. We observed a clear reduction in Cy5 fluorescence in both NDST1-/- cell lines compared to that observed on NDST1+ cells (Fig 2A). This reduction was seen for both VACV and MYXV, however, it was more pronounced for MYXV (which displayed a 4.0±0.7-fold decrease in Cy5 mean fluorescent intensity) then for VACV (which displayed a 2.0±0.7-fold decrease). No significant differences in fluorescent intensities were observed between the two NDST1-/- cell lines (Fig 2B).

Fig 2. Loss of sulfation reduces binding of both MYXV and VACV virions.

Fig 2

(A) Histograms depicting binding of fluorescent viral virions to the cell surface. Cells were incubated on ice with Cy-5 labeled MYXV or VACV at 4 particles per cell and washed with cold PBS to remove residual virus. Cells were resuspended in 2% PFA and levels of Cy-5-labeled virus bound to the cell membrane was measured via flow cytometry. Data shown is representative of two independent experiments each done in triplicate. (B) Relative MFI values of Cy-5 (viral binding). MFI values were normalized to NDST+ to determine the relative change in NDST-/- cell lines. Statistical MFI calculations are a summation of the two independent experiments each conducted in triplicate. Statistical significance was determined using non-parametric Mann-Whitney test. ** = p<0.01, * = p<0.05.

NDST1-/- cells display a delay in intracellular poxviral replication

Since our previous experiments suggested that loss of heparin sulfation significantly reduced the affinity of viral binding, we next wanted to determine whether this reduction correlated to lower subsequent infection. Both NDST1+ and NDST1-/- cells were infected with MYXV and VACV at MOIs ranging from 0.0001 to 3. The initiation of viral infection was then assayed by determining the number of GFP+ cells found in each culture 24 hours post infection using flow cytometry. The results indicated that infection of NDST1 deficient cells resulted in a lower percentage of GFP+ cells over a wide range of MOIs (Fig 3A and 3B). As with binding affinity, this reduction was observed for both viruses, however, it was again more pronounced for MYXV than for VACV. Interestingly, infection with either virus at a high MOI (over 3) resulted in a near 100% rate of infection in both NDST1+ and NDST1-/- cells. Taken together, these data suggest that loss of heparin sulfation reduces initial poxviral infection, however, this reduction can be overcome with high concentrations of virus.

Fig 3. Loss of sulfation reduces initial infection of both MYXV and VACV.

Fig 3

(A) Number of GFP+ cells found 24 hours after infection with either MYXV or VACV at multiple MOI’s. Data shown is the summation of two independent experiments each conducted in triplicate. (B) Fluorescent images of cells infected for 24 hours with MYXV at an MOI of 1, 3, and 9 shown as an example.

To better resolve how the loss of heparin sulfation impacts the early steps of poxviral replication, we next performed a time course assaying expression of GFP as a surrogate marker for viral entry and/or early gene expression. NDST1+ and NDST1-/- cells were infected at an MOI of 10 with either MYXV or VACV and the expression of GFP was measured every 2 hours via flow cytometry. GFP expression was also analyzed at late time points including 24 hours as well as at 36 and 48 hours for VACV. During MYXV infection, GFP expression became detectable in the majority of NDST1+ cells between 2 and 6 hours post infection. In contrast, 6 hours after infection of NDST1 deficient cells, GFP could be detected in only ~20% of cells and detection in the majority of cells was not observed until 24 hours post infection. A similar trend was observed following VACV infection, although the overall kinetics of viral early gene expression were significantly delayed for VACV compared to MYXV. Indeed, overall VACV infection in this experiment was inefficient compared to other previous infections (Fig 3) which is likely due to minor experimental variation. In VACV infected cells, GFP was not detectable in most NDST1+ cells until 12–36 hours post infection and in most NDST1-/- cells until 24–48 hours post infection (Fig 4A). These kinetics are slightly delayed compared to previous results (Fig 3A) which we attribute to slight biological differences across experiments. To assess whether this delay in early gene expression hindered subsequent viral genome synthesis, both NDST1+ and NDST1-/- cells were infected with MYXV of VACV at an MOI 10 and samples collected every two hours for 12 hours. Total DNA was then extracted and the abundance of viral genomes was determined by using qPCR to detect either the MYXV- M085 or VACV-L1R genomic loci (Fig 4B). Consistent with the kinetics of poxviral replication, genomic viral DNA could not be reliably detected in NDST1+ cells until 6 hours post infection, at which point we observed a significant increase in signal for both MYXV and VACV genomes. In NDST1-/- cells, a similar increase in signal was observed for both viruses, however, this increase was of lesser magnitude and occurred at slightly later time points suggesting both reduced and delayed genome synthesis. Identical results were also obtained for both viruses using a second genomic loci (M055 for MYXV and D10R for VACV–data not shown). Finally, to determine whether the apparent delay in genome synthesis would impair the production of new infectious progeny, we quantified viral assembly using a single step growth curve. NDST1+ or deficient cells were infected with either MYXV or VACV at an MOI of 10. Following infection, cells were harvested at the indicated time points and the presence of infectious virus determined using standard foci/plaque forming assays. While the results clearly indicated productive viral replication in both NDST1+ and deficient cells, significantly fewer infectious MYXV virions were observed in NDST1-/- cells at both 6 and 12 hours post infection (Fig 4C). The number of infectious MYXV particles normalized by 24 hours post infection and no significant differences in the assembly of VACV were detected at any time point (Fig 4C Right).

Fig 4. Loss of sulfation delays intracellular poxviral replication.

Fig 4

(A) Kinetic analysis of GFP expression after initial infection of NDST1+ or deficient cells. NDST1+ or deficient B16/F10 cells were infected with either MYXV or VACV and GFP expression measured every two hours using flow cytometry. Data presented is representative of two independent experiments. (B) Abundance of MYXV or VACV genomes measured using qPCR. Data presented is representative of three independent experiments for both viruses each analyzed in triplicate and is presented as the change in cycle threshold value (ΔCT) from 2 hour baseline. (C) Production of new infection viral progeny in either NDST1+ or deficient cells measured using standard single step growth curve analysis. Data presented is a summation of two (VACV) or three (MYXV) independent experiments each conducted in triplicate. Statistical significance was determined using Students T-Test (* = p<0.05).

Reduced binding affinity has profoundly different effects on MYXV and VACV spread

Our previous experiments established that loss of NDST1 compromised the overall intracellular replication of both MYXV and VACV. In order to determine whether this compromise would impact viral spread, we next asked how the presence or absence of NDST1 influenced the foci/plaque size of each virus. NDST1+ or deficient cells were infected with either MYXV or VACV at an MOI of 0.001. Images of individual GFP+ foci/plaques were taken at 24, 48, and 72 hours post infection and the area of each infected region was quantified using imaging software (Fig 5A and 5B). Consistent with its compromised replication, GFP+ foci resulting from MYXV infection were ~50% smaller in both NDST1-/- cell lines compared to those seen in NDST1+ cells (p<0.005 at 72 hours). In striking contrast, however, while the intracellular replication of VACV was also clearly compromised by the loss of NDST1, we found that the spread of VACV in both NDST1-/- cell lines was significantly increased compared to that seen in the NDST1+ cells at both 48 and 72 hours post infection (2.0±0.1-fold larger in NDST1-/- cells, p<0.005) (Fig 5B). This unexpected result led us to look more closely at the composition of the VACV plaques found in each cell type (Fig 5C). We observed that VACV plaques formed in NDST1+ cells contained a relatively tight center of closely packed infected cells surrounded by a small ring of more diffuse infection. In contrast, plaques formed in NDST1 deficient cells largely lacked the tightly packed center core and instead contained only a large group of diffusely infected cells. To determine if this distribution of infection was solely responsible for the increased plaque sizes seen in NDST1-/- cells, we further quantitated the total amount of infection within individual plaques by analyzing overall GFP expression. For MYXV, this analysis showed that the total GFP content of individual foci was significantly reduced in NDST1-/- cells corresponding to their decreased area. In contrast, the total GFP content of VACV plaques was actually identical in both NDST1+ and deficient cells suggesting that the observed change in plaque size was due to an altered distribution of infection and not an actual increase in total virus present (Fig 5D).

Fig 5. Binding affinity has inverse impacts on the spread of different poxviruses.

Fig 5

(A) Images of individual GFP+ foci formed in either NDST1+ or deficient cells taken 24, 48, or 72 hours post infection with the indicated virus. (B) Quantitation of individual foci size. Data shown is representative of four independent experiments, where a total of >60 foci per cell/virus type were measured. (C) Up-close image of foci showing the different concentration of infected cells in the core. (D) Quantitation of total GFP signal in individual foci from experiments above. Data shown represents average GFP expression from >15 foci measured across three experiments. Statistical significance was determined using Students T-Test (*** = p<0.001).

One of the major differences between orthopoxviruses and MYXV is that MYXV is largely unable to produce infectious extracellular enveloped virus (EEV) [1] due to its lack of an f11l homologue [21]. To test whether the differential impact of GAG sulfation on viral spread which we observed in our previous experiments might be related to the presence/absence of infectious EEV we therefore used methyl cellulose to inhibit the release of EEV and subsequently measured foci/plaque size of both VACV and MYXV infections in NDST1+ or deficient cells. Consistent with our results in the absence of methyl cellulose, under EEV-restricting conditions MYXV formed significantly smaller plaques in NDST1-/- cells than in NDST1+ cells. In contrast, in the presence of methyl cellulose, plaques formed by VACV were identical in size in both NDST1+ and deficient cells (Fig 6A and 6B) suggesting that the large plaque phenotype observed in our previous experiments (Fig 5) was the result of viral spread through EEV.

Fig 6. Increased spread seen during low affinity VACV infections is mediated by secreted virions.

Fig 6

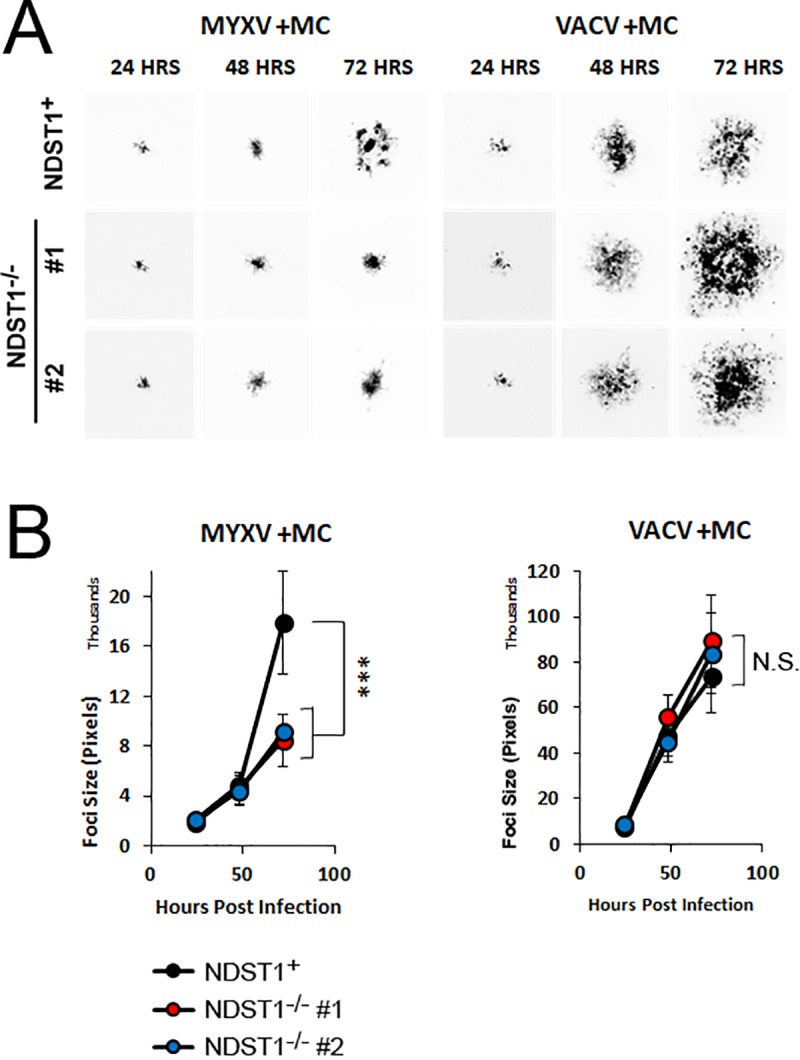
(A) Images of individual GFP+ foci formed in either NDST1+ or deficient cells covered with methyl cellulose. Images were taken 24, 48, or 72 hours post infection with the indicated virus. (B) Quantitation of individual foci size. Data is representative from at least three independent experiments. Statistical significance was determined using Students T-Test. *** = p<0.001.

Discussion

This major aim of this study was to determine how the progression of poxviral infection can be affected by cell-intrinsic factors which influence virion binding affinity. To accomplish this, we generated a cell line which is unable to add sulfates onto cell surface heparin proteoglycans due to the loss of the enzyme NDST1, which is essential for heparin sulfation. Interestingly, while GAG sulfation has been shown to play a major role in a wide array of cellular processes [22, 23], loss of NDST1 did not appear to grossly alter either the morphology or growth properties of B16/F10 cells in vitro (Fig 1) suggesting that these cells represent a feasible model to study poxviral infection under either high affinity (NDST1+) or low affinity (NDST1-/-) conditions.

Consistent with a role for negatively charged GAGs in poxviral binding, the loss of NDST1 correlated with a significant reduction in virion binding for both MXYV and VACV. Interestingly, this reduction was much more dramatic for MYXV than for VACV (Fig 2) which is similar to results from previous studies demonstrating that these two viruses display differential binding specificities for certain cell types [24]. This reduction in binding affinity resulted in reduced rates of infection in NDST1-/- cells across a range of MOIs. This decreased infection, however, could be overcome with high concentrations of virus (MOI’s > 3). This could be due to incomplete loss of heparin sulfation following NDST1 removal or to a HS-independent binding mechanism. In support of the second hypothesis, a recent study found that VACV infection was only moderately reduced when HS was removed by heparinase digestion, as opposed to near complete inhibition following treatment of virions with soluble heparin [25]. The authors of this work suggested that the difference might be due to incomplete heparinase digestion, however, our work suggests it is more likely due to an inherent property of VACV binding. In general, both this work and our current results suggest that VACV is effectively able to bind cells in the absence of sulfated heparin, while MYXV binding is much more HS dependent. This could be due to a VACV having an inherent affinity for other sulfated GAGs, such as chondroitin sulfate, however our work does not explore this possibility.

Even at high MOI’s, where the defects in early viral infection appeared to be overcome, lack of GAG sulfation was still associated with delayed early gene expression, genome synthesis, and assembly of new progeny virions (Fig 4A–4C). There are two possible explanations for these results. First is that progression through the viral replication cycle is dose dependent. This is supported by the general trend of poxviruses to display particle: PFU ratios above 10 without any obvious presence of defective interfering particles [26]. Alternatively, the presence of cell surface HS could be involved in directing post-binding steps of the poxviral replication cycle, most likely the early post-binding steps such as viral entry and/or uncoating. The observed delays in subsequent steps, such as genome replication and assembly, would then likely be the result of delayed early replication without requiring a direct involvement of HS in these processes. This model is partially supported by the delayed early gene expression, as measured by GFP, seen in Fig 4A, however, more direct measures of viral entry and/or uncoating would likely help clarify this point.

While the previous results could likely be anticipated based on existing studies, our data also show that the reduced binding affinity caused by loss of heparin sulfation has completely opposite effects on the spread of the two model poxviruses studied. In the case of MYXV, we found spread to be greater in NDST1+ than NDST1-/- cells and this trend remained consistent with the addition of methyl cellulose. In sharp contrast, we found that the spread of VACV was actually greater in NDST1-/- cells and that this difference was eliminated by the presence of methyl cellulose (Figs 5 and 6). We hypothesize that the differential impact of heparin sulfation on the foci/plaque size of MYXV and VACV may be attributed to the mechanisms of how each virus spreads. It is well established that most poxviruses produce two forms of infectious particles: intracellular mature virion (IMV) as well as EEV, which is IMV wrapped in an at least one additional cell membrane layer. Each of these forms differs in their physical and chemical structure and displays a distinct set of proteins on their surface, [27]. These differences can translate to distinct binding properties, with EEV having a greater affinity for interactions with highly sulfated HS than IMV [25]. VACV produces typical amounts of EEV which are involved in viral transmission. In contrast, MYXV produces little to no EEV, although it can produce extracellular, cell associated enveloped virus (CEV). In the case of MYXV, this strictly limits spread to direct cell to cell contact. Under low affinity binding conditions, this likely reduces the efficacy of spread during every round of viral replication resulting in an overall reduced foci size. In contrast, while VACV can also spread through direct cell to cell contact, it produces a more substantial amount of EEV which can transmit virus through the extracellular space to non-neighboring cells. Under high affinity conditions, these extracellular particles are likely to bind rapidly to neighboring cells since they readily adsorb to the cell surface. In contrast, under low affinity conditions, each cell is less susceptible to acute viral adsorption allowing EEV particles to potentially bypass neighboring cells and instead continue trafficking to sites further from their initial release. This model explains why VACV generates larger plaques in NDST1-/- deficient settings without actually infecting a greater number of cells (Fig 5). Interestingly, this effect is similar to the viral repulsion effect which was previously proposed as a mechanism to enhance the spread of VACV by preventing superinfection [28]. In the previous work, however, the mechanism of repulsion was expression of two viral proteins (A33 and A36) while in our work the mechanism is cell-intrinsic. This model also explains why VACV foci formed in the presence of methyl cellulose appear to display increased overall density compared to foci formed in the absence of methyl cellulose (compare Figs 5 and 6). Numerous studies have shown that the particle to PFU ratio for poxviruses ranges from 10–100:1. Since no obvious defective poxviral particles have been identified, this suggests that the number of particles required to induce a productive infection within a single cell is greater than one. We hypothesize that methyl cellulose traps viral particles increasing the localized concentration, thus enhancing the rates of infection within a limited area.

An interesting correlate of this work is the possibility that proteins within the poxviral virion itself might contain sulfated GAG’s that play a role in the poxviral life cycle. Numerous cellular proteins have been shown to be incorporated into the VACV and MYXV virions [29, 30] and several of these are likely candidates for GAG modification. Given the wide-spread impact of GAGs on numerous biological processes, such modifications could play any number of roles in poxviral infection. It is interesting to note, however, that poxviral particle binding is generally thought to be dependent on the virion carrying a large positive charge. Sulfation of virion GAG’s would likely disrupt this charge thus possibly acting as a negative regulatory mechanism. Future studies into the potential role of poxviral protein sulfation might therefore yield interesting results.

Overall, these results highlight the importance of understanding poxviral binding and infection as a two-way interaction between the virus and host cell. While many studies have utilized genetically modified viruses or the addition of exogenous compounds, such as soluble HS, this research focused on how cell intrinsic factors influence poxviral biology. These findings highlight an unanticipated result of reducing poxviral binding affinity which could have a significant impact on how these viruses impact either human disease or poxviral mediated oncolytic virotherapy.

Supporting information

S1 Fig. Examples of foci/plaque quantitation.

Shown are regions drawn around individual VACV plaques 48 hour after infection of the indicated cells (region shown as white circle) given as examples of how foci/plaque size was determined. Foci area calculated for each region using ImageJ is shown below image. Note that these specific images/regions are presented only as after the fact examples of how regions were drawn. The specific visual images of the regions drawn for data acquisition were not saved in ImageJ and therefore only the calculated areas for each foci/plaque remain.

(DOCX)

S2 Fig. Expression of NDST1-4 in B16/F10 cells.

mRNA was extracted from untreated wild-type B16/F10 cells and used to synthesizes cDNA. Two different primer sets (corresponding to each previously reported NDST enzyme—NDST1, NDST2, NDST3, and NDST4) were then used to attempt to amplify regions of each gene from the cDNA. Successful PCR amplification was observed with both primer sets corresponding to NDST1 and NDST2. No specific PCR products were observed in either primer set against NDST3 or NDST4. Note that due to low technical quality the image shown has been enhanced for both brightness and contrast as well as cropped to remove irrelevant lanes on the right side.

(DOCX)

S3 Fig. Original scan of Actin western blot used in Fig 1B.

Original scan of NDST western blot used in Fig 1B.

(PDF)

Acknowledgments

We would like to thank Dr. Paula Traktman for valuable discussion about this project.

Data Availability

All relevant data are within the manuscript and its Supporting Information files.

Funding Statement

EB R21AI123803 NIH (NIAID) https://www.niaid.nih.gov/ The funders had no role in study design, data collection and analysis, decision to publish, or preparation of the manuscript. EB R01CA194090 NIH (NCI) https://www.cancer.gov/ The funders had no role in study design, data collection and analysis, decision to publish, or preparation of the manuscript. EB RSG-17-047-01 American Cancer Society https://www.cancer.org The funders had no role in study design, data collection and analysis, decision to publish, or preparation of the manuscript.

References

  • 1.Knipe DM, Howley PM. 2013. Fields virology, 6th ed. Wolters Kluwer/Lippincott Williams & Wilkins Health, Philadelphia, PA. [Google Scholar]
  • 2.Esko JD, Selleck SB. 2002. Order out of chaos: assembly of ligand binding sites in heparan sulfate. Annu Rev Biochem 71:435–71. 10.1146/annurev.biochem.71.110601.135458 [DOI] [PubMed] [Google Scholar]
  • 3.Kwon MJ, Jang B, Yi JY, Han IO, Oh ES. 2012. Syndecans play dual roles as cell adhesion receptors and docking receptors. FEBS Lett 586:2207–11. 10.1016/j.febslet.2012.05.037 [DOI] [PubMed] [Google Scholar]
  • 4.Lindahl U, Kjellen L. 2013. Pathophysiology of heparan sulphate: many diseases, few drugs. J Intern Med 273:555–71. 10.1111/joim.12061 [DOI] [PubMed] [Google Scholar]
  • 5.Whitelock JM, Iozzo RV. 2005. Heparan sulfate: a complex polymer charged with biological activity. Chem Rev 105:2745–64. 10.1021/cr010213m [DOI] [PubMed] [Google Scholar]
  • 6.Habuchi H, Habuchi O, Kimata K. 2004. Sulfation pattern in glycosaminoglycan: does it have a code? Glycoconj J 21:47–52. 10.1023/B:GLYC.0000043747.87325.5e [DOI] [PubMed] [Google Scholar]
  • 7.Chen Y, Maguire T, Hileman RE, Fromm JR, Esko JD, Linhardt RJ, et al. 1997. Dengue virus infectivity depends on envelope protein binding to target cell heparan sulfate. Nat Med 3:866–71. 10.1038/nm0897-866 [DOI] [PubMed] [Google Scholar]
  • 8.Cooper A, Tal G, Lider O, Shaul Y. 2005. Cytokine induction by the hepatitis B virus capsid in macrophages is facilitated by membrane heparan sulfate and involves TLR2. J Immunol 175:3165–76. 10.4049/jimmunol.175.5.3165 [DOI] [PubMed] [Google Scholar]
  • 9.Hallak LK, Collins PL, Knudson W, Peeples ME. 2000. Iduronic acid-containing glycosaminoglycans on target cells are required for efficient respiratory syncytial virus infection. Virology 271:264–75. 10.1006/viro.2000.0293 [DOI] [PubMed] [Google Scholar]
  • 10.Spear PG, Shieh MT, Herold BC, WuDunn D, Koshy TI. 1992. Heparan sulfate glycosaminoglycans as primary cell surface receptors for herpes simplex virus. Adv Exp Med Biol 313:341–53. 10.1007/978-1-4899-2444-5_33 [DOI] [PubMed] [Google Scholar]
  • 11.Chung CS, Hsiao JC, Chang YS, Chang W. 1998. A27L protein mediates vaccinia virus interaction with cell surface heparan sulfate. J Virol 72:1577–85. [DOI] [PMC free article] [PubMed] [Google Scholar]
  • 12.Hsiao JC, Chung CS, Chang W. 1999. Vaccinia virus envelope D8L protein binds to cell surface chondroitin sulfate and mediates the adsorption of intracellular mature virions to cells. J Virol 73:8750–61. [DOI] [PMC free article] [PubMed] [Google Scholar]
  • 13.Lin CL, Chung CS, Heine HG, Chang W. 2000. Vaccinia virus envelope H3L protein binds to cell surface heparan sulfate and is important for intracellular mature virion morphogenesis and virus infection in vitro and in vivo. J Virol 74:3353–65. 10.1128/jvi.74.7.3353-3365.2000 [DOI] [PMC free article] [PubMed] [Google Scholar]
  • 14.Bartee E, Chan WM, Moreb JS, Cogle CR, McFadden G. 2012. Selective purging of human multiple myeloma cells from autologous stem cell transplantation grafts using oncolytic myxoma virus. Biol Blood Marrow Transplant 18:1540–51. 10.1016/j.bbmt.2012.04.004 [DOI] [PMC free article] [PubMed] [Google Scholar]
  • 15.Johnston JB, Barrett JW, Chang W, Chung CS, Zeng W, Masters J, et al. 2003. Role of the serine-threonine kinase PAK-1 in myxoma virus replication. J Virol 77:5877–88. 10.1128/JVI.77.10.5877-5888.2003 [DOI] [PMC free article] [PubMed] [Google Scholar]
  • 16.Bartee MY, Dunlap KM, Bartee E. 2017. Tumor-Localized Secretion of Soluble PD1 Enhances Oncolytic Virotherapy. Cancer Res 77:2952–2963. 10.1158/0008-5472.CAN-16-1638 [DOI] [PMC free article] [PubMed] [Google Scholar]
  • 17.Wolfe AM, Dunlap KM, Smith AC, Bartee MY, Bartee E. 2018. Myxoma Virus M083 Is a Virulence Factor Which Mediates Systemic Dissemination. J Virol 92. [DOI] [PMC free article] [PubMed] [Google Scholar]
  • 18.Burton C, Das A, McDonald D, Vandergrift WA 3rd, Patel SJ, Cachia D, et al. 2018. Oncolytic myxoma virus synergizes with standard of care for treatment of glioblastoma multiforme. Oncolytic Virother 7:107–116. 10.2147/OV.S179335 [DOI] [PMC free article] [PubMed] [Google Scholar]
  • 19.Kjellen L. 2003. Glucosaminyl N-deacetylase/N-sulphotransferases in heparan sulphate biosynthesis and biology. Biochem Soc Trans 31:340–2. 10.1042/bst0310340 [DOI] [PubMed] [Google Scholar]
  • 20.Dou W, Xu Y, Pagadala V, Pedersen LC, Liu J. 2015. Role of Deacetylase Activity of N-Deacetylase/N-Sulfotransferase 1 in Forming N-Sulfated Domain in Heparan Sulfate. J Biol Chem 290:20427–37. 10.1074/jbc.M115.664409 [DOI] [PMC free article] [PubMed] [Google Scholar]
  • 21.Irwin CR, Favis NA, Agopsowicz KC, Hitt MM, Evans DH. 2013. Myxoma virus oncolytic efficiency can be enhanced through chemical or genetic disruption of the actin cytoskeleton. PLoS One 8:e84134 10.1371/journal.pone.0084134 [DOI] [PMC free article] [PubMed] [Google Scholar]
  • 22.Ringvall M, Kjellen L. 2010. Mice deficient in heparan sulfate N-deacetylase/N-sulfotransferase 1. Prog Mol Biol Transl Sci 93:35–58. 10.1016/S1877-1173(10)93003-2 [DOI] [PubMed] [Google Scholar]
  • 23.Ringvall M, Ledin J, Holmborn K, van Kuppevelt T, Ellin F, Eriksson I, et al. 2000. Defective heparan sulfate biosynthesis and neonatal lethality in mice lacking N-deacetylase/N-sulfotransferase-1. J Biol Chem 275:25926–30. 10.1074/jbc.C000359200 [DOI] [PubMed] [Google Scholar]
  • 24.Villa NY, Bartee E, Mohamed MR, Rahman MM, Barrett JW, McFadden G. 2010. Myxoma and vaccinia viruses exploit different mechanisms to enter and infect human cancer cells. Virology 401:266–79. 10.1016/j.virol.2010.02.027 [DOI] [PMC free article] [PubMed] [Google Scholar]
  • 25.Khanna M, Ranasinghe C, Jackson R, Parish CR. 2017. Heparan sulfate as a receptor for poxvirus infections and as a target for antiviral agents. J Gen Virol 10.1099/jgv.0.000921 [DOI] [PubMed] [Google Scholar]
  • 26.Payne LG, Norrby E. 1978. Adsorption and penetration of enveloped and naked vaccinia virus particles. J Virol 27:19–27. [DOI] [PMC free article] [PubMed] [Google Scholar]
  • 27.Condit RC, Moussatche N, Traktman P. 2006. In a nutshell: structure and assembly of the vaccinia virion. Adv Virus Res 66:31–124. 10.1016/S0065-3527(06)66002-8 [DOI] [PubMed] [Google Scholar]
  • 28.Doceul V, Hollinshead M, van der Linden L, Smith GL. 2010. Repulsion of superinfecting virions: a mechanism for rapid virus spread. Science 327:873–876. 10.1126/science.1183173 [DOI] [PMC free article] [PubMed] [Google Scholar]
  • 29.Zachertowska A, Brewer D, Evans DH. 2006. Characterization of the major capsid proteins of myxoma virus particles using MALDI-TOF mass spectrometry. J Virol Methods 132:1–12. 10.1016/j.jviromet.2005.08.015 [DOI] [PubMed] [Google Scholar]
  • 30.Chung CS, Chen CH, Ho MY, Huang CY, Liao CL, Chang W. 2006. Vaccinia virus proteome: identification of proteins in vaccinia virus intracellular mature virion particles. J Virol 80:2127–40. 10.1128/JVI.80.5.2127-2140.2006 [DOI] [PMC free article] [PubMed] [Google Scholar]

Decision Letter 0

Luis M Schang

21 Jan 2020

PONE-D-19-34908

Reduced cellular binding affinity has profoundly different impacts on the spread of distinct poxviruses.

PLOS ONE

Dear Associate Professor Bartee,

Thank you for submitting your manuscript to PLOS ONE. After careful consideration, we feel that it has merit but does not fully meet PLOS ONE’s publication criteria as it currently stands. Therefore, we invite you to submit a revised version of the manuscript that addresses the points raised during the review process.

Please see the enclosed editor's comments below to guide your in preparing the resubmission.

We would appreciate receiving your revised manuscript by Mar 06 2020 11:59PM. When you are ready to submit your revision, log on to https://www.editorialmanager.com/pone/ and select the 'Submissions Needing Revision' folder to locate your manuscript file.

If you would like to make changes to your financial disclosure, please include your updated statement in your cover letter.

To enhance the reproducibility of your results, we recommend that if applicable you deposit your laboratory protocols in protocols.io, where a protocol can be assigned its own identifier (DOI) such that it can be cited independently in the future. For instructions see: http://journals.plos.org/plosone/s/submission-guidelines#loc-laboratory-protocols

Please include the following items when submitting your revised manuscript:

  • A rebuttal letter that responds to each point raised by the academic editor and reviewer(s). This letter should be uploaded as separate file and labeled 'Response to Reviewers'.

  • A marked-up copy of your manuscript that highlights changes made to the original version. This file should be uploaded as separate file and labeled 'Revised Manuscript with Track Changes'.

  • An unmarked version of your revised paper without tracked changes. This file should be uploaded as separate file and labeled 'Manuscript'.

Please note while forming your response, if your article is accepted, you may have the opportunity to make the peer review history publicly available. The record will include editor decision letters (with reviews) and your responses to reviewer comments. If eligible, we will contact you to opt in or out.

We look forward to receiving your revised manuscript.

Kind regards,

Luis M Schang, MV. Ph.D.

Academic Editor

PLOS ONE

Journal requirements:

When submitting your revision, we need you to address these additional requirements.

1. Please ensure that your manuscript meets PLOS ONE's style requirements, including those for file naming. The PLOS ONE style templates can be found at

http://www.journals.plos.org/plosone/s/file?id=wjVg/PLOSOne_formatting_sample_main_body.pdf and http://www.journals.plos.org/plosone/s/file?id=ba62/PLOSOne_formatting_sample_title_authors_affiliations.pdf

2. PLOS ONE now requires that authors provide the original uncropped and unadjusted images underlying all blot or gel results reported in a submission’s figures or Supporting Information files. This policy and the journal’s other requirements for blot/gel reporting and figure preparation are described in detail at https://journals.plos.org/plosone/s/figures#loc-blot-and-gel-reporting-requirements and https://journals.plos.org/plosone/s/figures#loc-preparing-figures-from-image-files. When you submit your revised manuscript, please ensure that your figures adhere fully to these guidelines and provide the original underlying images for all blot or gel data reported in your submission. See the following link for instructions on providing the original image data: https://journals.plos.org/plosone/s/figures#loc-original-images-for-blots-and-gels.

In your cover letter, please note whether your blot/gel image data are in Supporting Information or posted at a public data repository, provide the repository URL if relevant, and provide specific details as to which raw blot/gel images, if any, are not available. Email us at plosone@plos.org if you have any questions.

3. Please include your tables as part of your main manuscript and remove the individual files. Please note that supplementary tables (should remain/ be uploaded) as separate "supporting information" files

Additional Editor Comments (if provided):

As you can see in the enclosed reviews, both reviewers have favorable opinions of the submitted manuscript. However, both of them also noted that the q-PCR experiments should be repeated, and this editor concurs with that opinion. Please make sure to also address all the editorial comments from both reviewers, too, as these changes will add clarity to the manuscript. Looking forward to receiving the revised manuscript with the q-PCR experiments repeated.

[Note: HTML markup is below. Please do not edit.]

Reviewers' comments:

Reviewer's Responses to Questions

Comments to the Author

1. Is the manuscript technically sound, and do the data support the conclusions?

The manuscript must describe a technically sound piece of scientific research with data that supports the conclusions. Experiments must have been conducted rigorously, with appropriate controls, replication, and sample sizes. The conclusions must be drawn appropriately based on the data presented.

Reviewer #1: Yes

Reviewer #2: Partly

**********

2. Has the statistical analysis been performed appropriately and rigorously?

Reviewer #1: Yes

Reviewer #2: Yes

**********

3. Have the authors made all data underlying the findings in their manuscript fully available?

The PLOS Data policy requires authors to make all data underlying the findings described in their manuscript fully available without restriction, with rare exception (please refer to the Data Availability Statement in the manuscript PDF file). The data should be provided as part of the manuscript or its supporting information, or deposited to a public repository. For example, in addition to summary statistics, the data points behind means, medians and variance measures should be available. If there are restrictions on publicly sharing data—e.g. participant privacy or use of data from a third party—those must be specified.

Reviewer #1: Yes

Reviewer #2: Yes

**********

4. Is the manuscript presented in an intelligible fashion and written in standard English?

PLOS ONE does not copyedit accepted manuscripts, so the language in submitted articles must be clear, correct, and unambiguous. Any typographical or grammatical errors should be corrected at revision, so please note any specific errors here.

Reviewer #1: Yes

Reviewer #2: Yes

**********

5. Review Comments to the Author

Please use the space provided to explain your answers to the questions above. You may also include additional comments for the author, including concerns about dual publication, research ethics, or publication ethics. (Please upload your review as an attachment if it exceeds 20,000 characters)

Reviewer #1: The authors have used CRISPR/Cas9 technology to inactivate the sulfation enzyme NDST1 in mouse B16/F10 cells and then tested what effect this has on the growth and plaquing properties of VAC and MYX viruses. Mutating the gene delays establishing an infection but this can be compensated by using higher MOIs. They show that the two viruses differ somewhat in that the Leporipoxvirus forms relatively smaller plaques on k/o cells while the Orthopoxvirus forms larger and more diffuse plaques on NDST-/- cells versus NDST+ cells. The authors suggest that the differences between the two viruses might be due to somewhat different roles that EEV play in spreading VAC versus MYX from cell-to-cell.

On the whole I though that the work was well done and interpreted appropriately. The paper offers a useful counterpart to earlier studies concerning the roles of virus proteins. I did have a few comments:

1) Much of the discussion hinges on the measurement of "plaque size", but how this was determined by the authors is not clearly explained. This is actually quite tricky judging by the images shown in Fig5C or 6A, since there aren't clear margins to the plaques. Is it a measure of the diameter from the outermost of the GFP+ pixels or is it perhaps the area enclosing some % of the GFP+ signal? Some clarity here would be helpful.

2) The qPCR data in Fig 4B are odd. Given the discrepant measurements at 10 and 12 hr (in cell line #1 and 2), it's very difficult to come to any conclusions regarding whether DNA synthesis is affected by this mutation. This experiment should be repeated. Ideally one would like to know whether the replication kinetics are any different once the barrier to infection has been overcome (i.e post entry). That means identifying newly infected cells and measuring DNA synthesis in just those cells. Is there any way to determining this? For example, could one measure the rate of growth of DAPI strained virus factories once they are first detected?

3) Lines 251-62. The paragraph surrounding the role of EEV is confusing. The authors lead with a statement that MYX produce much less EEV than VAC, then use methyl cellulose to "inhibit release of EEV", see no effect of methyl cellulose on VAC plating in either cell type, and conclude that EEV play a major role in determining VAC spread. I can't follow the logic, there seems to be a non sequitur or circular reasoning somewhere. As an aside, VAC strain WR doesn't produce much EEV, the effect seen here might be more striking if strain IHD-W was used.

Lastly, one is still left uncertain whether this mutation is affecting binding alone or binding plus entry via the entry fusion complex. Fig 2 doesn't really help clarify this point and it's only briefly discussed in lines 296 - 300. Have the authors tried to measure a time lag between binding (for example on ice) and uncoating?

Minor points.

1) Abbreviations need to be explained (e.g. NTC)

2) The green plaque images (e.g. Fig 5A) would be better presented as black on white as in Fig 5C.

3) There's an NDST2 I gather, would it still be functional?

4) Can one call NDST1 "essential" as the authors do in the abstract? The k/o cells seem to grow fine.

As an experiment for another day I would be curious to know if virus grown on k/o cells have any subsequent problems infecting normal cells? Presumably the progeny aren't sulfated properly.

Reviewer #2: In this manuscript, Flores et al. evaluate the role of heparin sulfation in poxvirus entry, infection and spread. The authors used CRISPR to delete the sulfation enzyme NDST1 in murine B16/F10 cells. They show that deletion of NDST1 reduces binding and infection of two different poxviruses, MYXV and VACV, although the effect could be overcome by a high MOI. Notably, deletion of NDST1 inhibited spread of MYXV, but enhanced spread of VACV. Overall, the study is nicely designed, with experimental data that are appropriately interpreted and support the conclusions. However, a few additional experiments and explanations/clarifications would strengthen the manuscript.

Specific comments:

1. Can the authors explain the discrepancy in the results between Fig. 3A and Fig. 4A? In Fig. 3A, where viral GFP expression is measured at 24 hours post infection, ~100% of cells are infected regardless of NDST1 deletion at a high MOI (i.e., 3). However, in Fig. 4A, where cells were also infected at a high MOI (i.e., 10), but at 24 hours, only ~20% of NDST1-deleted cells were GFP+ compared to 100% in the NDST+ cells.

2. Figure 4B: The data would be better expressed as genome copies (based on comparison to a standard curve). Furthermore, the data are from one experiment. I would suggest repeating the experiment and showing data from three independent experiments, particularly considering the discrepancies observed between the two NDST1-deleted cell lines. In particular, the phenotype in NDST1-deleted cell line #1 appears strange, with viral genomes dropping between 10 and 12 hours.

3. Why were B16/F10 cells chosen for this study? A brief justification of the cell line chose may be helpful for non-experts. Furthermore, BSC40 cells appear to have been used in Figure 4 (as indicated on line 379). Why the change?

4. To confirm that the phenotypes observed are indeed due to the absence of NDST1 (and not clonal selection during cell line construction), I would suggest adding back NDST1 to confirm the effect is reversed by NDST1 expression. Similarly, do the authors see the same phenotype (reduced spread of MYXV, but enhanced spread of VACV) with heparase treatment?

5. The authors nicely explain in the introduction that VACV binds to both heparan sulfate and chondroitin sulfate. Is the reduced effect of NDST1 deletion on VACV compared to MYXV due to its binding to CS? And similarly is the enhanced spread of VACV in the absence of NDST1 facilitated by binding to CS in distant cells? It would be interesting to evaluate the effect of CS removal (i.e., by chondroitinase treatment) in the NDST1 deleted cells, to see whether the VACV phenotype becomes more like the MYXV phenotype.

Minor typographical comments:

1. Line 248: “context” should be “content”

2. Line 315: “typical amounts EEV” should be “typical amounts of EEV”

3. Line 378: “kinetic” should be capitalised to read “Kinetic”

**********

6. PLOS authors have the option to publish the peer review history of their article (what does this mean?). If published, this will include your full peer review and any attached files.

If you choose “no”, your identity will remain anonymous but your review may still be made public.

Do you want your identity to be public for this peer review? For information about this choice, including consent withdrawal, please see our Privacy Policy.

Reviewer #1: No

Reviewer #2: No

[NOTE: If reviewer comments were submitted as an attachment file, they will be attached to this email and accessible via the submission site. Please log into your account, locate the manuscript record, and check for the action link "View Attachments". If this link does not appear, there are no attachment files to be viewed.]

While revising your submission, please upload your figure files to the Preflight Analysis and Conversion Engine (PACE) digital diagnostic tool, https://pacev2.apexcovantage.com/. PACE helps ensure that figures meet PLOS requirements. To use PACE, you must first register as a user. Registration is free. Then, login and navigate to the UPLOAD tab, where you will find detailed instructions on how to use the tool. If you encounter any issues or have any questions when using PACE, please email us at figures@plos.org. Please note that Supporting Information files do not need this step.

PLoS One. 2020 Apr 30;15(4):e0231977. doi: 10.1371/journal.pone.0231977.r002

Author response to Decision Letter 0


2 Mar 2020

Response to Reviewer Comments

Editorial Comments:

1) Please ensure that your manuscript meets PLOS ONE's style requirements

We have edited the manuscript for style to conform to Plos One’s requirements (apologies). Note that these changes are not tracked on the marked up file.

2) PLOS ONE now requires that authors provide the original uncropped and unadjusted images underlying all blot or gel results

Our manuscript only contains 1 figure with western blot data (Fig 1B). The original files for the scanned in gels have now been included as supplemental figures 3 and 4. The scanned in images have been labeled for clarity but not altered in any other way. Note that these supplemental files are not referenced in the manuscript.

3) Please include your tables as part of your main manuscript and remove the individual files.

Table 1 has now been inserted into the manuscript file as requested.

Reviewer #1

1) Much of the discussion hinges on the measurement of "plaque size", but how this was determined by the authors is not clearly explained. This is actually quite tricky judging by the images shown in Fig5C or 6A, since there aren't clear margins to the plaques. Is it a measure of the diameter from the outermost of the GFP+ pixels or is it perhaps the area enclosing some % of the GFP+ signal? Some clarity here would be helpful.

We apologize for the lack of clarity. The reviewer is correct in their assumption that plaque size was determined by drawing an area around the outermost ring of GFP+ cells and subsequently determining the area of that region using post image processing (we used ImageJ for this). This is an approach that we have published on previously and we therefore did not include much discussion of this as we simply cited our previous work. We have now removed that citation and instead included a more complete methods section on measuring foci/plaque size. Examples of how we drew the regions around foci are also now included as supplemental Figure S1.

2) The qPCR data in Fig 4B are odd. Given the discrepant measurements at 10 and 12 hr (in cell line #1 and 2), it's very difficult to come to any conclusions regarding whether DNA synthesis is affected by this mutation. This experiment should be repeated. Ideally one would like to know whether the replication kinetics are any different once the barrier to infection has been overcome (i.e post entry). That means identifying newly infected cells and measuring DNA synthesis in just those cells. Is there any way to determining this? For example, could one measure the rate of growth of DAPI strained virus factories once they are first detected?

We fully agree with the reviewer that our genome quantitation data should have been repeated. We have therefore repeated the previous experiment two additional times as well as also conducted a similar experiment for VACV (which was not previously shown) three separate times. The summation of all three experiments is now shown as new data in Fig 4B. Interestingly, all three replicates for MYXV do show the previously observed decrease in genomes between 10 and 12 hours post infection. While we do not have an explanation for this phenomenon, we hypothesize that it could be due to cellular lysis during this time frame. We would also point out that it occurs in both control and NDST1 deficient cells and is therefore not likely to impact the conclusions of our work.

3) Lines 251-62. The paragraph surrounding the role of EEV is confusing. The authors lead with a statement that MYX produce much less EEV than VAC, then use methyl cellulose to "inhibit release of EEV", see no effect of methyl cellulose on VAC plating in either cell type, and conclude that EEV play a major role in determining VAC spread. I can't follow the logic, there seems to be a non sequitur or circular reasoning somewhere. As an aside, VAC strain WR doesn't produce much EEV, the effect seen here might be more striking if strain IHD-W was used.

We apologize for the lack of clarity. The phenotype under study was the increased size of VACV plaques seen in NDST1 deficient cells (Fig 5). The data in figure 6 shows that this phenotype goes away in the presence of MC and that under these conditions VACV forms identical sized plaques in both NDST+ and deficient cells. The effect of MC is therefore that it eliminates the previously observed phenotype. The corresponding results section has been edited to hopefully clarify this point.

4) Lastly, one is still left uncertain whether this mutation is affecting binding alone or binding plus entry via the entry fusion complex. Fig 2 doesn't really help clarify this point and it's only briefly discussed in lines 296 - 300. Have the authors tried to measure a time lag between binding (for example on ice) and uncoating?

We have not directly measured the lag between binding and entry/uncoating. However, our data in Fig 4A measures early gene expression following high MOI infection which is similar to the requested experiments (albeit a slightly more indirect measure). This data clearly shows a delay in GFP expression in NDST1 deficient cells for both VACV and MYXV. We interpreted this as a possible delay in entry in our discussion, however, we could not rule out the possibility that GFP expression in these experiments is virion dose dependent. We have edited the relevant section in the discussion to further emphasize this point.

5) Abbreviations need to be explained (e.g. NTC)

We apologize for this oversight. We have re-read the manuscript and now provide definitions for all abbreviations used in both the text and the figures upon their first usage.

6) The green plaque images (e.g. Fig 5A) would be better presented as black on white as in Fig 5C.

We have replaced the images of green foci/plaques in both Fig 5 and Fig 6 with inverted black and white images as requested.

7) There's an NDST2 I gather, would it still be functional?

These are actually 4 distinct NDST enzymes (NDST1-4). We have now tested expression of all of these enzymes in B16/F10 cells and find expression of NDST1 and 2 (but not 3 and 4). This data is now included as supplemental Figure S2. However, of these four enzymes, NDST1 is absolutely essential for heparin sulfation and this cannot be overcome by the presence of NDST2-4 in the absence of NDST1. Therefore, our KO of NDST1 efficiently prevents all heparin sulfation (Fig 1E) even though NDST2 should still be present in our KO cells (note that we have not directly tested expression of NDST2 in our NDST1 KO cells). A sentence has been added to the results section (line 143) to clarify this.

8) Can one call NDST1 "essential" as the authors do in the abstract? The k/o cells seem to grow fine.

We apologize for the lack of clarity. NDST1 is not essential for cell growth, however, it is completely essential for GAG sulfation (which is what we were attempting to refer to here). We have edited the referenced section of the abstract to clarify this point.

9) As an experiment for another day I would be curious to know if virus grown on k/o cells have any subsequent problems infecting normal cells? Presumably the progeny aren't sulfated properly.

This is a very interesting point that we had not initially considered! One would presume that some proteins within the poxviral virion are heparinated and therefore most likely sulfated as well and that this might play a role in poxviral binding or entry (based on the charges involved it might actually be a negative binding regulator). This could probably be examined be looking at the particle:PFU ratios of virions grown in NDST1+ and deficient cells, however, as noted by the reviewer, this likely falls outside the scope of the current manuscript. We’ve added a new paragraph into the discussion section on this issue.

Reviewer #2

1. Can the authors explain the discrepancy in the results between Fig. 3A and Fig. 4A? In Fig. 3A, where viral GFP expression is measured at 24 hours post infection, ~100% of cells are infected regardless of NDST1 deletion at a high MOI (i.e., 3). However, in Fig. 4A, where cells were also infected at a high MOI (i.e., 10), but at 24 hours, only ~20% of NDST1-deleted cells were GFP+ compared to 100% in the NDST+ cells.

We assume that the review is referring to the VACV results in these figures as the MYXV results appear fairly consistent. Regarding the VACV infection, we completely agree with the reviewer that the results of the two experiments are slightly different. We have attribute these differences to slight experimental variation. Overall infection with VACV in the experiment shown in Fig 4 was inefficient compared to that seen in Fig 3 (Note that the rate of infection at 24 hours in the control NDST1+ cells seen in Fig 4 is actually only 71% which is significantly lower than the 91% seen in Fig 3). While we do not have a concrete explanation for these experimental changes, we would note that poxviral infection is highly dependent on both concentration and the number of freeze thaws a specific stock has undergone (both variables which are difficult to get completely identical over the course of multiple experiments). Regardless of these differences, we do feel that we have included the appropriate control groups in both Fig 3 and Fig 4 and that the results of these groups (while not identical) are within the realm of biological variation and result in fairly consistent conclusions. We therefore feel that the conclusions drawn from these results remain valid. We have included a sentence in the results section (line 202-203) indicating that we believe these differences are due to minor biological variations across experiments.

2. Figure 4B: The data would be better expressed as genome copies (based on comparison to a standard curve). Furthermore, the data are from one experiment. I would suggest repeating the experiment and showing data from three independent experiments, particularly considering the discrepancies observed between the two NDST1-deleted cell lines. In particular, the phenotype in NDST1-deleted cell line #1 appears strange, with viral genomes dropping between 10 and 12 hours.

Replication of our real time PCR quantitation of viral genomes has been addressed in reviewer #1’s comment #2 above.

We have previously considered the possibility of generating standard genome curves to present our data as genomes copies. Unfortunately, our experience is that using whole virions for a standard is not accurate due to poor PCR efficiency from intact virus particles (compared to free viral genomes within a cell) and extraction of viral DNA from infected cells yields high levels of cellular genome contamination. We therefore feel that our use of differential CT values represents the most accurate method to display this data.

3. Why were B16/F10 cells chosen for this study? A brief justification of the cell line chose may be helpful for non-experts. Furthermore, BSC40 cells appear to have been used in Figure 4 (as indicated on line 379). Why the change?

The reviewer raises an excellent point concerning the origination of our study and the reason why B16/F10 cells were chosen. In full disclosure, our lab is primarily interested in oncolytic immunotherapy. In this context, B16/F10 cells represent a standard model for melanoma tumors which represent one of the major targets for virotherapy. The original purpose of removing NDST1 from these cells was to study the role of susceptibility to viral infection during oncolytic treatment (note that a separate manuscript using the NDST1-/- cells in this context is current under preparation). In the process of doing this oncolytic work, we kind of stumbled upon the differential effects of NDST1 loss on MYXV and VACV infection. Due to this background, there is really not a strong scientific rationale for undertaking the basic virology aspect of this work in B16/F10 cells. However, despite the poor initial justification for the cell type used, we do feel that the work remains scientifically strong and that the results obtained are interesting enough to warrant publication. Note that I’m not really sure how to clarify this point coherently in the actual manuscript and so no changes have been made in the text regarding this particular issue.

The reference to BSC40 cells on line 379 was a typo and has been corrected to refer to NDST1+ or deficient B16/F10 cells.

4. To confirm that the phenotypes observed are indeed due to the absence of NDST1 (and not clonal selection during cell line construction), I would suggest adding back NDST1 to confirm the effect is reversed by NDST1 expression. Similarly, do the authors see the same phenotype (reduced spread of MYXV, but enhanced spread of VACV) with heparase treatment?

We agree with the reviewer that reconstitution experiments are one method to demonstrate the specificity of CRISPR-based genetic mutations. However, these reconstitution experiments are often not trivial since overexpression comes with numerous caveats. This is one of the major reasons that these types of experiments are rarely performed in any study using CRISPR. In the absence of this type of data, we would argue that both our NDST1 KO cells lines are clonally derived and display identical phenotypes in basically all of our proposed experiments. The chances of this occurring form an off-target, CRISPR mutation in two distinct cell lines is extremely small. Additionally, the phenotypes observed in our studies are highly consistent with previous work on the biology of NDST1 and poxviruses. We therefore feel confident that our results are due to specific loss of NDST1.

5. The authors nicely explain in the introduction that VACV binds to both heparan sulfate and chondroitin sulfate. Is the reduced effect of NDST1 deletion on VACV compared to MYXV due to its binding to CS? And similarly is the enhanced spread of VACV in the absence of NDST1 facilitated by binding to CS in distant cells? It would be interesting to evaluate the effect of CS removal (i.e., by chondroitinase treatment) in the NDST1 deleted cells, to see whether the VACV phenotype becomes more like the MYXV phenotype.

We agree that the possibility of VACV having a higher binding affinity to CS could play a role in our observed outcomes. Unfortunately, we are not aware of any genetic methodology to specifically eliminate sulfation on CS and genetically eliminating chondroitin itself is likely to have widespread effects which would be difficult to interpret. It would likely be possible to partially overcome this with enzymatic digestion (chondroitinase), however, it’s a fairly large amount of work to do this type of study well and we therefore feel that it is outside the scope of the current manuscript. A sentence has been added to the discussion section concerning the possible role of CS in VACV binding.

6. Line 248: “context” should be “content”

This typo has been corrected

7. Line 315: “typical amounts EEV” should be “typical amounts of EEV”

This typo has been corrected

8. Line 378: “kinetic” should be capitalized to read “Kinetic”

This typo has been corrected

Attachment

Submitted filename: Response to Reviewer Comments.docx

Decision Letter 1

Luis M Schang

5 Mar 2020

PONE-D-19-34908R1

Reduced cellular binding affinity has profoundly different impacts on the spread of distinct poxviruses.

PLOS ONE

Dear Associate Professor Bartee,

Thank you for submitting your manuscript to PLOS ONE. After careful consideration, we feel that it has merit but does not fully meet PLOS ONE’s publication criteria as it currently stands. Therefore, we invite you to submit a revised version of the manuscript that addresses the points raised during the review process.

Please refer to the Additional Editor Comments below for a full discussion of the issues that need to be addressed.

We would appreciate receiving your revised manuscript by Apr 19 2020 11:59PM. When you are ready to submit your revision, log on to https://www.editorialmanager.com/pone/ and select the 'Submissions Needing Revision' folder to locate your manuscript file.

If you would like to make changes to your financial disclosure, please include your updated statement in your cover letter.

To enhance the reproducibility of your results, we recommend that if applicable you deposit your laboratory protocols in protocols.io, where a protocol can be assigned its own identifier (DOI) such that it can be cited independently in the future. For instructions see: http://journals.plos.org/plosone/s/submission-guidelines#loc-laboratory-protocols

Please include the following items when submitting your revised manuscript:

  • A rebuttal letter that responds to each point raised by the academic editor and reviewer(s). This letter should be uploaded as separate file and labeled 'Response to Reviewers'.

  • A marked-up copy of your manuscript that highlights changes made to the original version. This file should be uploaded as separate file and labeled 'Revised Manuscript with Track Changes'.

  • An unmarked version of your revised paper without tracked changes. This file should be uploaded as separate file and labeled 'Manuscript'.

Please note while forming your response, if your article is accepted, you may have the opportunity to make the peer review history publicly available. The record will include editor decision letters (with reviews) and your responses to reviewer comments. If eligible, we will contact you to opt in or out.

We look forward to receiving your revised manuscript.

Kind regards,

Luis M Schang, MV. Ph.D.

Academic Editor

PLOS ONE

Additional Editor Comments (if provided):

Thank you very much for paying so close attention to all the reviewers and addressing all issues raised by both reviewers. The manuscript has been improved as a result. However, a couple of issues still need some attention, as listed below.

1. Statistics. A few figures show error bars, which are described as SD, and present p values, but are described as presenting the sum of two independent experiments (figure 2B, 3A, 4), or the number of experiments is not presented (figure 5). SD and p values using Student's T test or similar requiere a minimum of 3 independent experiments to test the biological reproducibility of a result. Please clarify what are the error bars and p values. If only two or one biologically independent experiments are presented, then SD and p values cannot be calculated.

2. Wording. "Semi-quantitative", although used in biology, is actually a self-contradictory world: an approach is by definition quantitative or qualitative. In this particular paper, the word does not add much, and it can well be removed (line 178)

3. Clarity to the reader. Although discussed in the discussion section, the presentation of Figure 4 in the results appears contradictory to the results from figure 3. Perhaps you may want to anticipate the likely explanation in the results section, and then present, as you do now, the full discussion in the discussion section? I am of the opinion that it would be helpful to the reader.

4. Lastly, although the discussion about the effects of MC is now far more clear, there is an issue that is not actually discussed. The effect adding MC on VACV plaque size is not by decreasing the size of the plaques in the knockout cells, but rather by increasing the size in the wild-type ones. This may perhaps be a result of experimental variability, but it does not appear to affect the size of MYXV. This unexpected observation deserves some discussion, even it it were just to state that it is an intrinsic experimental variability.

Once again, thank you for paying so close attention to all comments by both reviewers.

[Note: HTML markup is below. Please do not edit.]

[NOTE: If reviewer comments were submitted as an attachment file, they will be attached to this email and accessible via the submission site. Please log into your account, locate the manuscript record, and check for the action link "View Attachments". If this link does not appear, there are no attachment files to be viewed.]

While revising your submission, please upload your figure files to the Preflight Analysis and Conversion Engine (PACE) digital diagnostic tool, https://pacev2.apexcovantage.com/. PACE helps ensure that figures meet PLOS requirements. To use PACE, you must first register as a user. Registration is free. Then, login and navigate to the UPLOAD tab, where you will find detailed instructions on how to use the tool. If you encounter any issues or have any questions when using PACE, please email us at figures@plos.org. Please note that Supporting Information files do not need this step.

PLoS One. 2020 Apr 30;15(4):e0231977. doi: 10.1371/journal.pone.0231977.r004

Author response to Decision Letter 1


5 Mar 2020

Additional Editor Comments (if provided):

Thank you very much for paying so close attention to all the reviewers and addressing all issues raised by both reviewers. The manuscript has been improved as a result. However, a couple of issues still need some attention, as listed below.

Please see responses to specific comments below. Note that no changes needed to be made to the figures based on these comments.

1. Statistics. A few figures show error bars, which are described as SD, and present p values, but are described as presenting the sum of two independent experiments (figure 2B, 3A, 4), or the number of experiments is not presented (figure 5). SD and p values using Student's T test or similar require a minimum of 3 independent experiments to test the biological reproducibility of a result. Please clarify what are the error bars and p values. If only two or one biologically independent experiments are presented, then SD and p values cannot be calculated.

We apologize for the confusion. The references in the figure legends to two independent experiments refers to completely separate experiments done on different days. Each experiment was conducted in at least triplicate giving us a total n of 6+. Stats are calculated for the total n which actually gives us relatively solid statistical power. We have amended the figure legends to make this clearer.

2. Wording. "Semi-quantitative", although used in biology, is actually a self-contradictory word: an approach is by definition quantitative or qualitative. In this particular paper, the word does not add much, and it can well be removed (line 178)

We totally agree with this assessment. We included the semi-quantitative phrase, simply because that is typically how agarose gels are referred to. This has now been replaced with ‘Qualitative” as requested.

3. Clarity to the reader. Although discussed in the discussion section, the presentation of Figure 4 in the results appears contradictory to the results from figure 3. Perhaps you may want to anticipate the likely explanation in the results section, and then present, as you do now, the full discussion in the discussion section? I am of the opinion that it would be helpful to the reader.

We have now included the following phrase in the results section describing Fig 4. “Indeed, overall VACV infection in this experiment was inefficient compared to other previous infections (Fig 3) which is likely due to minor experimental variation.” Combined with the previously included section about this issue in the discussion we hope that this provides sufficient clarity to the reader concerning the observed results.

4. Lastly, although the discussion about the effects of MC is now far more clear, there is an issue that is not actually discussed. The effect adding MC on VACV plaque size is not by decreasing the size of the plaques in the knockout cells, but rather by increasing the size in the wild-type ones. This may perhaps be a result of experimental variability, but it does not appear to affect the size of MYXV. This unexpected observation deserves some discussion, even it were just to state that it is an intrinsic experimental variability.

You had to go there. Unlike the data in Figs 3 and 4, this phenotype is highly reproducible suggesting it is not due to experimental variation. We did not discuss it in the previous version of the manuscript since we don’t have a true explanation for it. Our working hypothesis is that this phenotype is the result of MC trapping viral particles close to the site of initial infection thus increasing the local concentration of virus (resulting in more infection). This is actually fairly consistent with our overall model which proposed that NDST1 deficiency causes reduced binding efficacy effectively spreading out VACV infections. While this is only hypothetical, I have added a new paragraph into the discussion regarding this possibility (note that I also had to rearrange some of the surrounding sentences to make the grammer flow properly).

Attachment

Submitted filename: Response to Editorial Comments.pdf

Decision Letter 2

Luis M Schang

6 Mar 2020

PONE-D-19-34908R2

Reduced cellular binding affinity has profoundly different impacts on the spread of distinct poxviruses.

PLOS ONE

Dear Associate Professor Bartee,

Thank you for submitting your manuscript to PLOS ONE. After careful consideration, we feel that it has merit but does not fully meet PLOS ONE’s publication criteria as it currently stands. Therefore, we invite you to submit a revised version of the manuscript that addresses the points raised during the review process.

Please see the "Additional Editor Comments" below.

We would appreciate receiving your revised manuscript by Apr 20 2020 11:59PM. When you are ready to submit your revision, log on to https://www.editorialmanager.com/pone/ and select the 'Submissions Needing Revision' folder to locate your manuscript file.

If you would like to make changes to your financial disclosure, please include your updated statement in your cover letter.

To enhance the reproducibility of your results, we recommend that if applicable you deposit your laboratory protocols in protocols.io, where a protocol can be assigned its own identifier (DOI) such that it can be cited independently in the future. For instructions see: http://journals.plos.org/plosone/s/submission-guidelines#loc-laboratory-protocols

Please include the following items when submitting your revised manuscript:

  • A rebuttal letter that responds to each point raised by the academic editor and reviewer(s). This letter should be uploaded as separate file and labeled 'Response to Reviewers'.

  • A marked-up copy of your manuscript that highlights changes made to the original version. This file should be uploaded as separate file and labeled 'Revised Manuscript with Track Changes'.

  • An unmarked version of your revised paper without tracked changes. This file should be uploaded as separate file and labeled 'Manuscript'.

Please note while forming your response, if your article is accepted, you may have the opportunity to make the peer review history publicly available. The record will include editor decision letters (with reviews) and your responses to reviewer comments. If eligible, we will contact you to opt in or out.

We look forward to receiving your revised manuscript.

Kind regards,

Luis M Schang, MV. Ph.D.

Academic Editor

PLOS ONE

Additional Editor Comments (if provided):

Thank you very much for your prompt response addressing all the previous questions. Regarding the vaccinia plaque size, the discussion added will alleviate the questions that many a reader might have had otherwise. There is one issue that still needs attention, though, regarding statistics. It is not proper to combine replicates of one experiment with biological repeats. Replicates of one experiment test the reproducibility of the measurements, whereas biologically independent experiments test the biological reproducibility of the system. If the experiments were performed twice in triplicates, then, the n is 2, not 6, for the biological reproducibility, and 3, not 6, for the precision of the measurement (which can only be calculated in each experiments separately).

In the case presented in figures 2B, 3A or 4, if they were indeed performed in just two independent experiments, either present the results as average plus/minus ranges or present the results of a single experiment. Unfortunately, it won't be possible to calculate the p values, but this is not critical to the conclusions.

[Note: HTML markup is below. Please do not edit.]

[NOTE: If reviewer comments were submitted as an attachment file, they will be attached to this email and accessible via the submission site. Please log into your account, locate the manuscript record, and check for the action link "View Attachments". If this link does not appear, there are no attachment files to be viewed.]

While revising your submission, please upload your figure files to the Preflight Analysis and Conversion Engine (PACE) digital diagnostic tool, https://pacev2.apexcovantage.com/. PACE helps ensure that figures meet PLOS requirements. To use PACE, you must first register as a user. Registration is free. Then, login and navigate to the UPLOAD tab, where you will find detailed instructions on how to use the tool. If you encounter any issues or have any questions when using PACE, please email us at figures@plos.org. Please note that Supporting Information files do not need this step.

PLoS One. 2020 Apr 30;15(4):e0231977. doi: 10.1371/journal.pone.0231977.r006

Author response to Decision Letter 2


13 Mar 2020

Dear Plos Editorial Staff,

As requested, I am returning our manuscript titled “Reduced cellular binding affinity has profoundly different impacts on the spread of distinct poxviruses” to allow for statistical examination by the Plos One statistical advisory board.

At issue appears to be our tendency to combine data sets across multiple experiments and subsequently run statistical analysis on the combined data. An example of this has also been uploaded (the example includes the data used in Fig 2B). In this data set we conducted 2 independent experiments with each experiment done in triplicate (note that triplicate here refers to 3 independent wells of cells treated with virus in 3 independent infections with all plating and infections done at the same time). The experiment is analyzed on the flow cytometer which gives us the critical measure for this assay which is reported from the flow cytometer as (Mean : Comp-APC-A = value). The raw data from both experiments is contained in the attached file as well as the analysis leading to the generation of the figure and statistical analysis (note that the data was normalized within each experiment to account for an observed batch effect and hence reported as MFI relative to control). The results indicate strong statistical significance across the total data set which reported in the figure (note that you also get significance across each individual experiment if analyzed separately).

The Plos One editorial staff objected to this practice claiming that

“It is not proper to combine replicates of one experiment with biological repeats. Replicates of one experiment test the reproducibility of the measurements, whereas biologically independent experiments test the biological reproducibility of the system. If the experiments were performed twice in triplicates, then, the n is 2, not 6, for the biological reproducibility, and 3, not 6, for the precision of the measurement (which can only be calculated in each experiments separately).

We understand the issue raised by the editor, however, we think our method of presenting all the data would seem to be superior to what many authors use, including authors published in Plos One, which is to present data from one experiment and run stats on the replicates within that experiment. We also don’t feel that there is anything statistically wrong with our method since we do not believe that our samples would be considered ‘linked’ for mathematical purposes (note that I’m not entirely sure what the mathematical definition of a linked sample is, but for the biological purposes of the experiment in question it would likely refer to a single sample which was run on the flow cytometer 3 separate times to yield 3 separate data points – which is not what we did).

Obviously, I don’t want to publish data which is analyzed correctly and if the Plos One editorial staff feels that the issue raised is valid, we can fairly easily revise the manuscript to address it. I simply want to make sure that this request is both correct and consistent with normal Plos One editorial practices.

As a final note: we’ve also reexamined all the data contained within our paper and believe that the only place this issue is relevant is in the data contained in Fig 2B. Other instances raised by the editor are examined below.

Fig 2B: this experiment is done as the editor detailed

Fig 3A: There are no claims of significance made about this data so the statistical analysis can’t really be incorrect (since there are no stats applied).

Fig 4: Similar to 3A 4A and 4B do not have claims of significance. 4C does claim significance for the myxoma data. For myxoma, this experiment was actually conducted 3 independent times and the stats are therefore run on the averages of all 3 experiments as is being requested by the editor. The vaccinia experiment was only run twice. Since there was not hint of a difference in either experiment we did not run it a third time and no claim of significance was made. The issue here appears to be that the figure legend currently indicates that this experiment were done twice for both viruses which is technically incorrect as one was done twice and one was done 3 times.

Fig 5 and 6: These figures analyze individual foci measurements. Given the biology of viral foci formation, it’s pretty hard to envision that these would be considered mathematically linked data sets.

As I mentioned above, we will certainly accept whatever decision is rendered by the editorial staff and can easily revise the manuscript in whatever way is requested.

Sincerely,

Eric Bartee

Associate Professor

University of New Mexico Health Science Center

Decision Letter 3

Luis M Schang

31 Mar 2020

PONE-D-19-34908R3

Reduced cellular binding affinity has profoundly different impacts on the spread of distinct poxviruses.

PLOS ONE

Dear Associate Professor Bartee,

Thank you for submitting your manuscript to PLOS ONE. After careful consideration, we feel that it has merit but does not fully meet PLOS ONE’s publication criteria as it currently stands. Therefore, we invite you to submit a revised version of the manuscript that addresses the points raised during the review process.

Please, see the Additional Editor's comment below

We would appreciate receiving your revised manuscript by May 15 2020 11:59PM. When you are ready to submit your revision, log on to https://www.editorialmanager.com/pone/ and select the 'Submissions Needing Revision' folder to locate your manuscript file.

If you would like to make changes to your financial disclosure, please include your updated statement in your cover letter.

To enhance the reproducibility of your results, we recommend that if applicable you deposit your laboratory protocols in protocols.io, where a protocol can be assigned its own identifier (DOI) such that it can be cited independently in the future. For instructions see: http://journals.plos.org/plosone/s/submission-guidelines#loc-laboratory-protocols

Please include the following items when submitting your revised manuscript:

  • A rebuttal letter that responds to each point raised by the academic editor and reviewer(s). This letter should be uploaded as separate file and labeled 'Response to Reviewers'.

  • A marked-up copy of your manuscript that highlights changes made to the original version. This file should be uploaded as separate file and labeled 'Revised Manuscript with Track Changes'.

  • An unmarked version of your revised paper without tracked changes. This file should be uploaded as separate file and labeled 'Manuscript'.

Please note while forming your response, if your article is accepted, you may have the opportunity to make the peer review history publicly available. The record will include editor decision letters (with reviews) and your responses to reviewer comments. If eligible, we will contact you to opt in or out.

We look forward to receiving your revised manuscript.

Kind regards,

Luis M Schang, MV. Ph.D.

Academic Editor

PLOS ONE

Additional Editor Comments (if provided):

Thank you very much for your prompt reply to the previous review. Please address the question raised by the statistical expert reviewer, whom as you can see consider it appropriate to pool the results.

[Note: HTML markup is below. Please do not edit.]

Reviewers' comments:

Reviewer's Responses to Questions

Comments to the Author

1. If the authors have adequately addressed your comments raised in a previous round of review and you feel that this manuscript is now acceptable for publication, you may indicate that here to bypass the “Comments to the Author” section, enter your conflict of interest statement in the “Confidential to Editor” section, and submit your "Accept" recommendation.

Reviewer #3: All comments have been addressed

**********

2. Is the manuscript technically sound, and do the data support the conclusions?

The manuscript must describe a technically sound piece of scientific research with data that supports the conclusions. Experiments must have been conducted rigorously, with appropriate controls, replication, and sample sizes. The conclusions must be drawn appropriately based on the data presented.

Reviewer #3: Yes

**********

3. Has the statistical analysis been performed appropriately and rigorously?

Reviewer #3: No

**********

4. Have the authors made all data underlying the findings in their manuscript fully available?

The PLOS Data policy requires authors to make all data underlying the findings described in their manuscript fully available without restriction, with rare exception (please refer to the Data Availability Statement in the manuscript PDF file). The data should be provided as part of the manuscript or its supporting information, or deposited to a public repository. For example, in addition to summary statistics, the data points behind means, medians and variance measures should be available. If there are restrictions on publicly sharing data—e.g. participant privacy or use of data from a third party—those must be specified.

Reviewer #3: Yes

**********

5. Is the manuscript presented in an intelligible fashion and written in standard English?

PLOS ONE does not copyedit accepted manuscripts, so the language in submitted articles must be clear, correct, and unambiguous. Any typographical or grammatical errors should be corrected at revision, so please note any specific errors here.

Reviewer #3: Yes

**********

6. Review Comments to the Author

Please use the space provided to explain your answers to the questions above. You may also include additional comments for the author, including concerns about dual publication, research ethics, or publication ethics. (Please upload your review as an attachment if it exceeds 20,000 characters)

Reviewer #3: I was asked to look at the statistical issue around the analysis of this basic science paper examining how the loss of GAG sulfation might have impacted on the replication cycles of two model poxviruses, the classic orthopoxvirus VACV as well as the leporipoxvirus myxom (MYXV). I am somewhat surprised that the mechanism for successful binding of these virion families to a host cell remains poorly understood. The magnitude of the effect is large so if proved correct it makes these results potentially useful for developing treatment able to reduce the risk of entry into humans.

The main issue seems to revolve around how the experiment was conducted which led to the key results shown in Figure 2B. The authors uploaded their explanation of the experiment procedure as well as the raw data which were used to draft Figure 2B.

In my opinion, some confusion raised from the term ‘replicate’ as opposed to ‘repeat’. Repeat and replicate measurements are both multiple response measurements taken at the same combination of factor settings; in this case, the settings are the wells of cells treated with viruses in 3 independent infections with all plating and infections done at the same time. However, while repeat measurements are taken during the same experimental run or consecutive runs, replicate measurements are taken during identical but different experimental runs. Repeats are done to increase precision on the same run while replicates are separate experiments all contributing to the overall variability. Form the authors’ explanation it appears that they have used replicates and not repeats so I believe that the Editor’s main comment has been addressed properly.

Therefore, it is correct to treat them as independent and to combine them to obtain the final estimate and use statistical tests for independent statistical units such as the Student t-test. My only suggestion is that because of the small sample size the authors should consider using a non-parametric test instead of the Student T-test which relies on the distribution of the data be approximately normal.

**********

7. PLOS authors have the option to publish the peer review history of their article (what does this mean?). If published, this will include your full peer review and any attached files.

If you choose “no”, your identity will remain anonymous but your review may still be made public.

Do you want your identity to be public for this peer review? For information about this choice, including consent withdrawal, please see our Privacy Policy.

Reviewer #3: No

[NOTE: If reviewer comments were submitted as an attachment file, they will be attached to this email and accessible via the submission site. Please log into your account, locate the manuscript record, and check for the action link "View Attachments". If this link does not appear, there are no attachment files to be viewed.]

While revising your submission, please upload your figure files to the Preflight Analysis and Conversion Engine (PACE) digital diagnostic tool, https://pacev2.apexcovantage.com/. PACE helps ensure that figures meet PLOS requirements. To use PACE, you must first register as a user. Registration is free. Then, login and navigate to the UPLOAD tab, where you will find detailed instructions on how to use the tool. If you encounter any issues or have any questions when using PACE, please email us at figures@plos.org. Please note that Supporting Information files do not need this step.

PLoS One. 2020 Apr 30;15(4):e0231977. doi: 10.1371/journal.pone.0231977.r008

Author response to Decision Letter 3


2 Apr 2020

Comment from Reviewer 3:

“…Therefore, it is correct to treat them as independent and to combine them to obtain the final estimate and use statistical tests for independent statistical units such as the Student t-test. My only suggestion is that because of the small sample size the authors should consider using a non-parametric test instead of the Student T-test which relies on the distribution of the data be approximately normal.”

Based on the statistical review of our previous data analysis, it appears that our previously utilized approach of combining multiple experiments is statistically valid. As requested, we have reanalyzed the combined data set using the non-parametric Mann-Whitney test (which also yields significance for the data) and adjusted the figure legend and figure accordingly.

Attachment

Submitted filename: Response to Reviewre Comments.docx

Decision Letter 4

Luis M Schang

6 Apr 2020

Reduced cellular binding affinity has profoundly different impacts on the spread of distinct poxviruses.

PONE-D-19-34908R4

Dear Dr. Bartee,

We are pleased to inform you that your manuscript has been judged scientifically suitable for publication and will be formally accepted for publication once it complies with all outstanding technical requirements.

Within one week, you will receive an e-mail containing information on the amendments required prior to publication. When all required modifications have been addressed, you will receive a formal acceptance letter and your manuscript will proceed to our production department and be scheduled for publication.

Shortly after the formal acceptance letter is sent, an invoice for payment will follow. To ensure an efficient production and billing process, please log into Editorial Manager at https://www.editorialmanager.com/pone/, click the "Update My Information" link at the top of the page, and update your user information. If you have any billing related questions, please contact our Author Billing department directly at authorbilling@plos.org.

If your institution or institutions have a press office, please notify them about your upcoming paper to enable them to help maximize its impact. If they will be preparing press materials for this manuscript, you must inform our press team as soon as possible and no later than 48 hours after receiving the formal acceptance. Your manuscript will remain under strict press embargo until 2 pm Eastern Time on the date of publication. For more information, please contact onepress@plos.org.

With kind regards,

Luis M Schang, MV. Ph.D.

Section Editor

PLOS ONE

Additional Editor Comments (optional):

Thank you very much for introducing the minor edition recommended by the statistician. The manuscript is now ready for publication. Thank you very much for considering PLOS One for the manuscript.

Reviewers' comments:

Acceptance letter

Luis M Schang

13 Apr 2020

PONE-D-19-34908R4

Reduced cellular binding affinity has profoundly different impacts on the spread of distinct poxviruses.

Dear Dr. Bartee:

I am pleased to inform you that your manuscript has been deemed suitable for publication in PLOS ONE. Congratulations! Your manuscript is now with our production department.

If your institution or institutions have a press office, please notify them about your upcoming paper at this point, to enable them to help maximize its impact. If they will be preparing press materials for this manuscript, please inform our press team within the next 48 hours. Your manuscript will remain under strict press embargo until 2 pm Eastern Time on the date of publication. For more information please contact onepress@plos.org.

For any other questions or concerns, please email plosone@plos.org.

Thank you for submitting your work to PLOS ONE.

With kind regards,

PLOS ONE Editorial Office Staff

on behalf of

Dr. Luis M Schang

Section Editor

PLOS ONE

Associated Data

    This section collects any data citations, data availability statements, or supplementary materials included in this article.

    Supplementary Materials

    S1 Fig. Examples of foci/plaque quantitation.

    Shown are regions drawn around individual VACV plaques 48 hour after infection of the indicated cells (region shown as white circle) given as examples of how foci/plaque size was determined. Foci area calculated for each region using ImageJ is shown below image. Note that these specific images/regions are presented only as after the fact examples of how regions were drawn. The specific visual images of the regions drawn for data acquisition were not saved in ImageJ and therefore only the calculated areas for each foci/plaque remain.

    (DOCX)

    S2 Fig. Expression of NDST1-4 in B16/F10 cells.

    mRNA was extracted from untreated wild-type B16/F10 cells and used to synthesizes cDNA. Two different primer sets (corresponding to each previously reported NDST enzyme—NDST1, NDST2, NDST3, and NDST4) were then used to attempt to amplify regions of each gene from the cDNA. Successful PCR amplification was observed with both primer sets corresponding to NDST1 and NDST2. No specific PCR products were observed in either primer set against NDST3 or NDST4. Note that due to low technical quality the image shown has been enhanced for both brightness and contrast as well as cropped to remove irrelevant lanes on the right side.

    (DOCX)

    S3 Fig. Original scan of Actin western blot used in Fig 1B.

    Original scan of NDST western blot used in Fig 1B.

    (PDF)

    Attachment

    Submitted filename: Response to Reviewer Comments.docx

    Attachment

    Submitted filename: Response to Editorial Comments.pdf

    Attachment

    Submitted filename: Response to Reviewre Comments.docx

    Data Availability Statement

    All relevant data are within the manuscript and its Supporting Information files.


    Articles from PLoS ONE are provided here courtesy of PLOS

    RESOURCES