Introduction:
Ammonia levels are used to assess hepatic encephalopathy, but their levels are highly variable in clinical practice.
Methods:
We studied factors associated with variation in ammonia values in cirrhotic patients without previous hepatic encephalopathy and healthy volunteers (HVs).
Results:
Ammonia increased by 12% and 18% at 1 and 2 hour, respectively, after a protein meal in 64 cirrhotic patients (P < 0.001). In 237 HVs, ammonia levels varied significantly between sites (P < 0.0001). New site-specific ammonia upper limits based on HV levels using a strict analysis protocol differed from routinely used values. Correlation between paired fresh samples was high (r = 0.83) but modest between fresh and frozen samples (r = 0.62).
Discussion:
Sample handling, processing, and protein intake impact ammonia levels across sites.
INTRODUCTION
The pathogenesis of hepatic encephalopathy (HE) is related to inflammation and ammonia (1). Although there is a statistical correlation between ammonia levels and HE grade, the overlap makes their clinical translation difficult (2). Careful pretrial planning and interpretation of results obtained from trials that depend on standardized ammonia levels requires evaluation of potential confounding factors (3). Therefore, we examined ammonia levels in cirrhotic patients (CPs) without previous overt HE. We specifically aimed to determine (i) the level and interindividual variability of fasting spot venous ammonia, (ii) impact of a standardized protein meal on the level of spot venous ammonia, and (iii) compare samples analyzed immediately or after flash freezing. We also compared the local reference range for ammonia in healthy volunteers (HVs) using standardized procedures for sampling and processing to each laboratory's routine processes.
METHODS
Protocols were approved by the Institutional Review Board, and all subjects gave informed consent. The study had 2 parts:
Part 1: Ammonia levels and protein meal
CPs without previous overt HE aged between 18 and 74 years were enrolled. We excluded patients with a history of liver transplantation, Child-Turcotte-Pugh score >9, model for end-stage liver disease (MELD) >23, body mass index <18.5 or ≥40 kg/m2, previous transjugular intra-hepatic porto-systemic shunt, on any antibiotics including rifaximin within 4 weeks, on laxatives within 2 weeks, and currently on valproate, corticosteroids, or cytotoxic drugs. Because we aimed to study delta ammonia, after fasting for >4 hours, a venous ammonia was measured using standard laboratory procedures. After a standardized 20 g protein meal (Ensure Enlive shake), spot ammonia was measured at 1 and 2 hours postmeal.
Part 2: Defining local reference ranges and comparing fresh to flash-frozen sample analysis
We enrolled healthy men and women aged between 18 and 74 years without chronic diseases or regular medication use, excessive alcohol consumption, and those free of acute illnesses within the last month. Subjects were screened for normal liver enzymes and bilirubin. After fasting for >4 hours, duplicate ammonia samples were obtained by venipuncture from a free-flowing venous blood sample without tourniquet and collected into prechilled 4.0 mL lithium heparin specimen tubes. Samples remained on ice until processing; analysis was within 60 minutes from blood draw. Each site used its routine ammonia assay for analysis. A subset of fresh samples (N = 29 per site) was flash-frozen and analyzed within 48 hours.
Statistical analysis
For part 1, a linear, mixed-effects model was used to estimate the significance of the described covariates. The model had a random effect by subject and fixed effects for time point and the current covariate tested. Significance for covariate effects was determined by the minimum Akaike Information Criterion. For part 2, the 95th percentile of HV at each site was used as the upper limit of normal (ULN). Analysis of variance was used to compare differences in demographics and ammonia levels between sites. Correlations between ammonia aliquots were analyzed using R (version 3.5.1).
RESULTS
Part 1
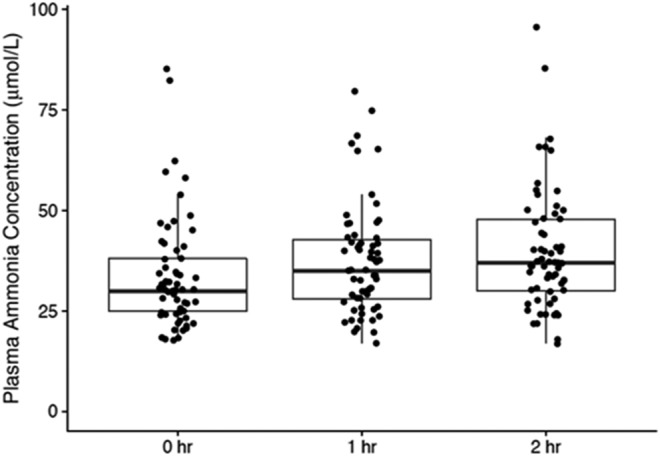
We enrolled 64 CPs (age 59.8 ± 7.0 years, 58% male, MELD 8.43 ± 2.21) from 3 centers. All patients tolerated the protein load without any signs of HE or confusion during the postmeal period. Baseline fasted venous ammonia levels were 33.71 (SD 13.78; range 18–85) μmol/L, which increased to 37.71 (13.86; 17–80) and 39.82 (15.20; 17–96) μmol/L 1 and 2 hours postmeal, respectively. This represented a 12% and 18% increase relative to baseline (P < 0.001, Figure 1). Interindividual variability was 71% of the total variance (SD = 9.3 μmol/L), whereas intraindividual variability was 29% (SD = 5.9 μmol/L). These changes were independent of age and sex. The MELD score was correlated with ammonia levels at baseline and at all time points with an 8% increase in ammonia levels with every point MELD rise.
Figure 1.

In cirrhotic patients without previous overt hepatic encephalopathy, the change in ammonia levels 1 and 2 hours after 20 g standardized protein meal are presented. Individual data, median, and 95% CI are shown, demonstrating a significant increase over baseline at 1- and 2-hour time points.
Part 2
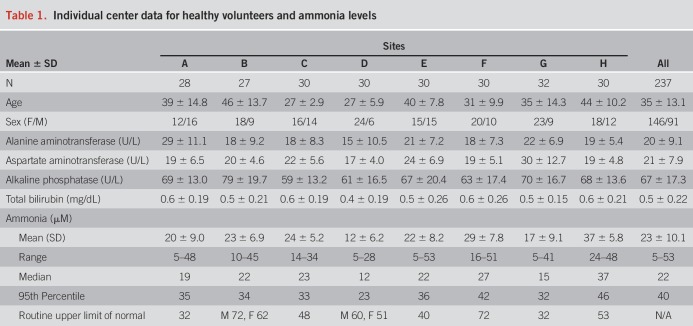
We enrolled 237 HVs from 8 sites with statistically significant variations in age and sex (P < 0.001) but similar liver enzymes (Table 1). There was significant variation in ammonia levels between sites using fresh ammonia aliquots (P < 0.0001 Kruskal-Wallis Figure 2A). The ULN defined as the 95th percentile of the HV data was mostly lower than the locally used routine ULN (Figure 2A and Table 1). The correlation coefficient between paired freshly analyzed ammonia levels was 0.83 (P < 0.0001) (Figure 2B), whereas the correlation between fresh and frozen samples was only modest (r = 0.62, Figure 2C). Ammonia was not correlated with age (P = 0.88, R = 0.01).
Table 1.
Individual center data for healthy volunteers and ammonia levels
Figure 2.
Healthy volunteer (HV) ammonia level analyses. (a) Median and 95% CI of fasting plasma ammonia values from HVs from 8 sites showing upper limit of normal (ULN) from the local laboratories in red lines, whereas the ULN calculated from the 95% CI upper limit is in blue. (b) Significant positive correlation between 2 freshly analyzed ammonia level replicates in HVs according to individual sites (r = 0.83). (c) Modest positive correlation between ammonia levels generated through freeze-thawing and freshly analyzed samples from the same blood draw in a subset of HVs (r = 0.62).
DISCUSSION
The current multicenter experience demonstrates that wide variability and lability of serum ammonia levels can confound interpretation, which highlights the unreliability of ammonia as a clinical measure. These results are consistent with American Association for Study of Liver Disease/European Association for the Study of Liver guidelines recommending against using ammonia levels alone for managing HE (1). This is relevant when ammonia levels are used as the major determinant of trial entry or success/failure (1,4). Variation in ammonia levels between sites additionally confounds ammonia level interpretation, particularly because it biases uniformity of the ULN (3). Correlation with MELD likely reflects hepatic synthetic dysfunction. Interestingly, this variation was reduced but not eliminated even with a detailed protocol for blood draw and analysis, rarely followed in routine clinical practice. Moreover, norms generated using ULN from healthy controls were largely different from those that were followed locally. This further demonstrates the need to restandardize ammonia measurements (as has been encouraged for aspartate aminotransferase, alanine aminotransferase, and international normalized ratio) for research (5,6).
We also found a major discordance between frozen-thawed and freshly drawn ammonia samples. This poses a challenge to multicenter trials using central laboratories to analyze flash-frozen samples. These results further suggest that if ammonia levels are to be used as an outcome measure in clinical trials, local analytic parameters must likely be standardized.
Previous single-center HV studies have demonstrated an increase in ammonia with high protein loads (30 and 60 g), as have single-center studies with glutamine and other amino acids (7,8). Our study extends this experience of ammonia lability using a shake with only 20 g of protein, which better replicates a “real-world” experience (9). This result could inform studies that rely on multiple inpatient and outpatient blood draws to time ammonia sampling with respect to meals.
CONCLUSION
We conclude that sample handling, processing, and protein intake have a major impact on ammonia levels and are important to account for in multicenter studies, which highlight the unreliability of ammonia measures for clinical practice.
CONFLICTS OF INTEREST
Guarantor of the article: Marja K. Puurunen, MD, PhD.
Specific author contributions: All authors apart from M.P., L.B., A.B., and C.A. were involved in study recruitment and conduct at sites. M.P., L.B., A.B., and C.A. were involved in design, funding, and sponsoring the study.
Financial support: Synlogic Inc.
Potential competing interests: C.A., L.B., A.M.B., and M.K.P. are employees of Synlogic Inc. No other COIs exist for this study.
REFERENCES
- 1.Vilstrup H, Amodio P, Bajaj J, et al. Hepatic encephalopathy in chronic liver disease: 2014 practice guideline by the American Association for the Study of Liver Diseases and the European Association for the Study of the Liver. Hepatology 2014;60:715–35. [DOI] [PubMed] [Google Scholar]
- 2.Ong JP, Aggarwal A, Krieger D, et al. Correlation between ammonia levels and the severity of hepatic encephalopathy. Am J Med 2003;114:188–93. [DOI] [PubMed] [Google Scholar]
- 3.Ge PS, Runyon BA. Serum ammonia level for the evaluation of hepatic encephalopathy. JAMA 2014;312:643–4. [DOI] [PubMed] [Google Scholar]
- 4.Bajaj JS, Cordoba J, Mullen KD, et al. Review article: The design of clinical trials in hepatic encephalopathy—An International Society for Hepatic Encephalopathy and Nitrogen Metabolism (ISHEN) consensus statement. Aliment Pharmacol Ther 2011;33:739–47. [DOI] [PMC free article] [PubMed] [Google Scholar]
- 5.Trotter JF, Olson J, Lefkowitz J, et al. Changes in international normalized ratio (INR) and model for endstage liver disease (MELD) based on selection of clinical laboratory. Am J Transpl 2007;7:1624–8. [DOI] [PubMed] [Google Scholar]
- 6.Kwo PY, Cohen SM, Lim JK. ACG Clinical Guideline: Evaluation of abnormal liver chemistries. Am J Gastroenterol 2017;112:18–35. [DOI] [PubMed] [Google Scholar]
- 7.Douglass A, Al Mardini H, Record C. Amino acid challenge in patients with cirrhosis: A model for the assessment of treatments for hepatic encephalopathy. J Hepatol 2001;34:658–64. [DOI] [PubMed] [Google Scholar]
- 8.Romero-Gomez M, Grande L, Camacho I. Prognostic value of altered oral glutamine challenge in patients with minimal hepatic encephalopathy. Hepatology 2004;39:939–43. [DOI] [PubMed] [Google Scholar]
- 9.Amodio P, Bemeur C, Butterworth R, et al. The nutritional management of hepatic encephalopathy in patients with cirrhosis: International Society for Hepatic Encephalopathy and Nitrogen Metabolism Consensus. Hepatology 2013;58:325–36. [DOI] [PubMed] [Google Scholar]


