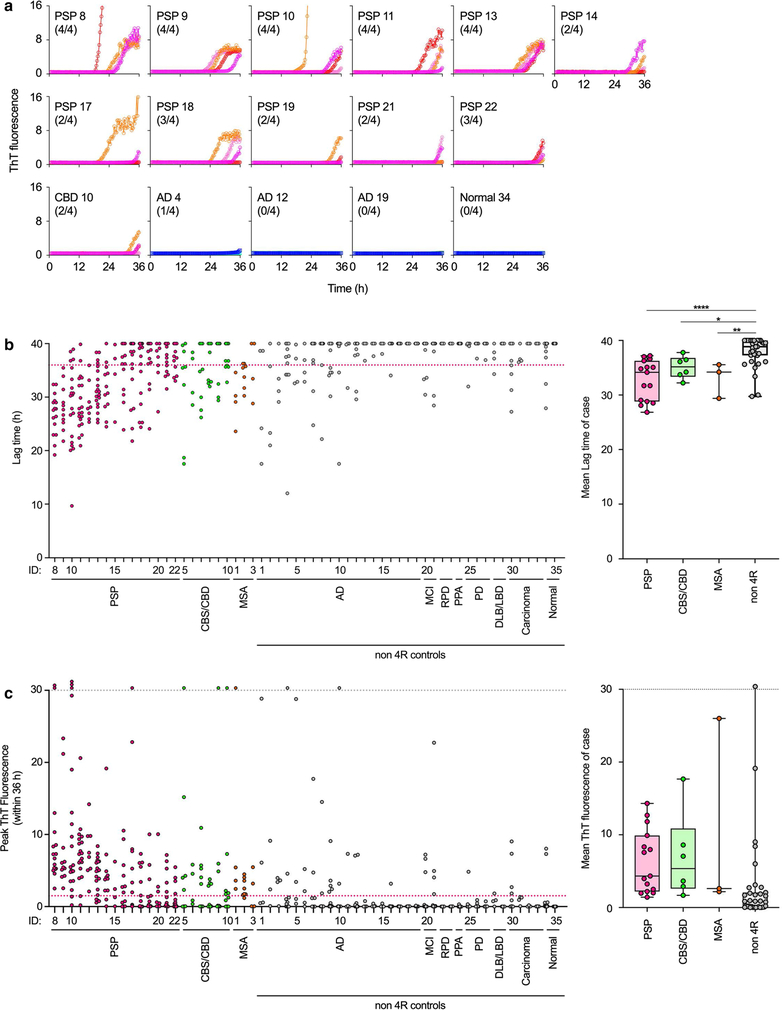
The original version of this article unfortunately contained a mistake. The Panel A in the published figure 5 is incorrect. The corrected Fig. 5 is placed in the following page.
Fig. 5.
4R seeding activities detected in intra-vitam PSP and CBD CSF by 4R RT-QuIC. a Representative CSF samples (12 μL) from PSP, CBD, AD, and non-neurological (normal) control cases, identified by their ID numbers from Online Resource Table 3, were analyzed by 4R RT-QuIC. Traces from individual quadruplicate reactions are plotted with ThT rfu indicated in thousands. The fraction of the quadruplicate reactions exceeding the 1500 rfu threshold is shown in parentheses. b Lag times (times to 1500 rfu within 40 h) for individual reactions seeded with CSF from the designated PSP, CBS/CBD, MSA, AD, MCI mild cognitive impairment, RPD rapidly progressive dementia, PPA primary progressive aphasia, PD Parkinson disease, dementia with Lewy bodies/Lewy body dementia (DLB/LBD), carcinoma and normal control cases (ID numbers on x-axis) were shown in the dot plot. Right graph: data points show average lag times for each case with the designated diagnosis. Boxes indicate the median and interquartile range, and whiskers indicate the maximum and minimum case averages. Significance of differences between means by one-way ANOVA followed by uncorrected Fisher’s LSD test: *p < 0.05, **p < 0.001, ****p < 0.0001. c Baseline-subtracted rfu values within 36 h. Off-scale values exceeding 30,000 rfu are stacked above the grey dotted line. Magenta dotted line:1500 rfu threshold. Box plots as described in b, but for peak rfu values instead of lag times
Footnotes
Publisher’s Note Springer Nature remains neutral with regard to jurisdictional claims in published maps and institutional affiliations.


