

Abstract
Objective:
To determine blood pressure (BP) patterns in the immediate postpartum period in preeclampsia with severe features (sPE), and normotensive pregnant women who had caesarean deliveries (CD).
Study design:
The BP levels of two groups comprising 50 sPE and 90 normotensive pregnant women who had CD were measured before delivery and on days 0–3 postpartum at 4 time points (05:00, 08:00, 14:00 and 22:00). Soluble fms-like tyrosine kinase-1 (sFlt-1) and placental growth factor (PIGF) were measured in the maternal serum ≤ 48 hours before delivery.
Results:
Antihypertensive therapy was administered to 98%, 96%, 82%, 78% and 56% of sPE antepartum and on postpartum days 0–3 respectively. De novo postpartum hypertension (BP ≥ 140/90 mmHg) occurred in 24.4% (22/90) of the normotensive group but only one required antihypertensive therapy. The occurrence of de novo postpartum hypertension was associated with maternal weight before delivery ≥ 84.5 kg (RR 2.6, CI 95% 1.2 – 5.8, p = 0.017), and body mass index before delivery ≥ 33.3 kg/m2 (RR 2.9, CI 95% 1.3 – 6.4, p = 0.008). In sPE, the BP decreased between predelivery period and postpartum day 0. From days 1–3 postpartum, there was a continuous increase in the daily mean BPs in both groups, with average daily increments (systolic/diastolic) being 5.6/4.6 mmHg and 0.6/1.3 mmHg in the sPE and normotensive women respectively. Patient’s group and time had a significant effect on BP, p<0.001. Overall, daily mean BPs were higher in the sPE than the normotensive group (p<0.001). Perceived stress (p=0.022), low birth weight (P=0.002), 5 minutes Apgar score ≤ 6 (p<0.001) were significantly higher in the sPE group. sFlt-1/PIGF ratio was high in the hypertensive groups: sPE versus and normotensive group, p <0.001; de novo postpartum hypertension versus normotensives group that remained normotensive, p = 0.102.
Conclusion:
Postpartum BP and antihypertensive requirements are important considerations in managing sPE and normotensive pregnancies. sPE is associated with increased maternal stress and poor perinatal outcomes.
Keywords: Caesarean delivery, preeclampsia with severe features, perceived stress scale, perinatal outcomes, postpartum hypertension
Introduction
Hypertensive disorders of pregnancy (HDP) particularly preeclampsia are major causes of perinatal and maternal morbidity and mortality. The HDP accounted for 14% of global maternal deaths in 2015 [1], and resulted in 2.9%, 6.5% and 7% stillbirths in high, middle and low-income countries respectively between 2009 and 2016 [2]. In South Africa (SA), HDP, mainly severe preeclampsia (referred to as preeclampsia with severe features [sPE]) and eclampsia, are the commonest direct cause of maternal deaths, and accounted for an institutional maternal mortality ratio of 24 per 100 000 live births in the 2014 – 2016 triennium [3]. The exact cause of preeclampsia is unknown, but may be due to abnormal uteroplacental blood flow [4], resulting in endothelial activation by mediators in a susceptible mother [5, 6].
Whether or not hemodynamic changes occur postpartum remains controversial [7]; with the administration of oxytocic agents reported to be associated with a reduction in mean arterial pressure while other reports suggest that lack of such therapy results in no change [7, 8]. Understandably, fluid therapy, vasoactive medications, postpartum stress and aberrant pregnancy physiology may affect blood pressure (BP) levels [9, 10]. Therefore, it is important to investigate postpartum BP changes in sPE as this condition makes a major contribution to maternal deaths.
Additionally, given the global increase in the numbers of adults being overweight and obese [11] (68% among adult women in SA) [12], it is important to determine contemporary postpartum BP patterns. Furthermore, most cases of postpartum eclampsia occur in the first 48–72 hours following delivery [13, 14], which suggests the need for intense BP monitoring in settings with a high burden of sPE, such as SA [15]. Findings of studies on the levels of BP patterns during this critical time will alert clinicians to their anticipated postpartum changes and assist in clinical management plans. This is important, given that high BP levels may act as an early warning sign for adverse pregnancy outcomes and signal an increased risk of future impaired functioning [16], including cardiovascular and metabolic diseases. The objectives of the present study were to determine the patterns of BP levels on days zero, one, two and three postpartum in a group of sPE who had caesarean deliveries (CD), and to compare these with a normotensive control group. Perinatal outcomes and antihypertensive drug usage were also determined.
Materials and methods
The study site was a regional hospital in SA that conducts approximately 7533 deliveries per year. Ethics approval was granted by Biomedical Research Ethics Committee of the University of KwaZulu-Natal (reference BE236/14), and data collection occurred between August and December 2015. The STROBE recommendations for reporting a cohort study [17] have been adhered to in this report (Supplemental material 1). The study was a cohort study, and the participants consisted of two groups: those having sPE during the antepartum period (group 1: n = 50) and a normotensive healthy pregnant group (group 2: n = 90). Preeclampsia was defined as new-onset hypertension (BP ≥140/90 mmHg) at or after 20 weeks gestational age with significant proteinuria, or either maternal organ or uteroplacental dysfunction [18]; the severe features according to our institutional guidelines being: systolic BP ≥160 mmHg and or diastolic BP of ≥110 mmHg, impending eclampsia, pulmonary oedema, heart failure, HELLP syndrome, low platelet count (< 100 × 109/L), serum creatinine and/or liver transaminases concentrations more than twice the normal values, [19] fetal growth restriction [6] and 24 hours urine protein ≥ 3 g. We are aware of the organizational differences in the diagnostic features of sPE [6, 18, 20] and thresholds for increased vigilance including the recent recommendation for close monitoring if daily proteinuria exceeds 2 g [21]. Notably, proteinuria was not used as an indication for delivery. In our setting, however, sPE tends to deteriorate rapidly [22] and this supports our diagnostic features. De novo postpartum hypertension was defined as hypertension (BP ≥140/90 mmHg) that occurred after the patient had been transferred from the recovery room of the operating theatre. Given the aim of the study, we did not wait 48 hours to elapse before categorizing BP levels as hypertensive, this approach is regarded as acceptable [23].
Pregnant women with other categories of HDP (including eclampsia), were excluded. An arm of the current study, yet to be published, evaluates severe angiogenic imbalance in preeclampsia, which is usually more intense in sPE [24], and we, therefore, excluded preeclampsia without severe features. In this process, soluble fms-like tyrosine kinase-1 (sFlt-1) and placental growth factor (PIGF) were measured in the maternal serum ≤ 24 – 48 hours before delivery using Roche elecsys platform (Roche Diagnostics, Germany) according to the manufacturer’s instruction (sandwich principle) [25, 26]. The venous serum from each participant was stored at −20°C and analysed within one month. No patient identifier or clinical information was provided to the laboratory (Ampath, Durban) that analyzed the blood samples. Nonetheless, women with multiple pregnancies and other medical conditions were also excluded. Additionally, it was not feasible at the time of the present study to investigate postpartum BP patterns of women who had vaginal deliveries. This was due to the limited availability of beds for inpatient care [27], the short duration of hospital-stay following vaginal birth, and local challenges associated with outpatient follow-up of research participants at the study site.
All pregnant women likely to meet the inclusion criteria were informed of the study in the antenatal period. In the pre-delivery period, consecutively accruing eligible participants gave informed consent and were included in the study. Each participant had her BP measured before delivery. Postpartum, the BP level of each participant was routinely measured four times a day [28] (at 05:00, 08:00, 14:00 and 22:00 hours) by midwives using an automated device, the iMEC12 patient monitor (Shenzhen Mindray Bio-Medical Electronics Co., Ltd) [29]. The technique of BP measurement followed the South African Hypertension Society guidelines [30]. Trained healthcare practitioners retrieved clinical data from each patient’s hospital chart and completed a structured data extraction sheet. Each patient was followed up as an inpatient until day three postpartum. The day of childbirth was regarded as day zero, while the following successive days were one, two and three postpartum. Perinatal outcomes were adjudged by Apgar scores and birth weight. The peri-operative care was based on the National Department of Health’s guidelines [19, 31] with aspects that may affect BP being shown in the supplemental material 2. Data on 4-item Perceived Stress Scale [32] were also collected within 48 – 72 hours postpartum. This tool has been previously validated in pregnancy [33] and assesses a respondent’s stress in the last one month. The scale comprises of 4 questions with each scored 0 to 4 points. The maximum score from the 4 questions is 16, and higher score reflects greater stress [34].
Statistical analysis:
Sample size calculation showed that 50 sPE and 90 normotensive pregnant women were required for the study as detailed in Supplemental material 3. The data were analyzed using SPSS version 24 (IBM, Armonk, NY, USA), with normality assessed using a combination of measures, including the Shapiro-Wilk test. Descriptive statistics was performed, and the comparison between two groups was assessed using t-tests for continuous normally distributed data. The Mann-Whitney U test was utilized to compare continuous but skewed as well as ranked data [35]. The categorical variables in two groups were assessed using Pearson’s chi-square test and Fischer’s exact test, as appropriate. Repeated binary measures of postpartum antihypertensive usage in the sPE were assessed using Cochran’s Q test, with McNemar as a post hoc test [36]. Repeated postpartum BP and numeric pain scale measures were assessed using repeated measures two-way analysis of variance (ANOVA) for time and group. Possible predictors of de novo postpartum hypertension were assessed using receiver operating characteristic curve. Each optimal cut-off point was assessed using the following diagnostic tests: sensitivity, specificity, positive predictive value (PPV), and negative predictive value (NPV) [35]. The risk of occurrence of de novo postpartum hypertension was expressed as relative risks (RR).
Results
Of the sPE, 29/50 had multiple severe features of preeclampsia. However, the commonest diagnostic feature of sPE was severe hypertension (44/50), followed by impending eclampsia (21/50). Importantly, proteinuria and/or fetal growth restriction were utilized to diagnose sPE only in one participant who presented with both features. This occurred in a-18-year-old primigravida who was diagnosed with late-onset preeclampsia (>34 weeks’ gestation) but was delivered of a 1890 g male fetus with 5 minutes Apgar score of 10. The commonest indication for delivery was previous CD at term in normotensive group (50/90) and fetal compromise in sPE (20/50). The predelivery sFlt-1/PIGF ratio (median with interquartile range) was 7.3 (17.9) in normotensive and 179.1 (271.2) pg/ml in sPE group, p < 0.001.
The maternal and perinatal profiles are shown in Table 1, with 98% (49/50) of sPE being on antihypertensive medications antepartum. On days zero, one, two and three postpartum, 96% (48/50), 82% (41/50), 78% (39/50) and 56% (28/50) of sPE received antihypertensive therapy respectively, with significant differences occurring only between days zero and two (p = 0.004) and days zero and three (p < 0.001).
Table 1.
Maternal and Perinatal Profiles
| Variable | Value in mean ± SD or n (%) or median [inter quartile range] | p-value | |
|---|---|---|---|
| Normotensive, n=90 | Preeclampsia with severe features, n=50 | ||
| Prenatal | |||
| Age (years) | 28[7] | 23[11] | 0.001 |
| Body mass index (kg/m2) at booking visit | 29.5[8.3] | 26.8[6.0] | 0.028 |
| Gestational age (weeks) at delivery | 38[1] | 36[6] | <0.001 |
| SBP (mmHg) in the ward before delivery | 112.2 ± 12.1 | 143.0 ± 17.7 | <0.001 |
| DBP (mmHg) in the ward before delivery | 65.1 ± 10.8 | 92.2 ± 12.3 | <0.001 |
| Haemoglobin (g/dl) at booking | 11.7 ± 1.7 | 12.2 ± 1.8 | 0.116 |
| Haemoglobin (g/dl) at pre-deiivery | 11.3 ± 1.3 | 11.8 ± 1.5 | 0.086 |
| Parity | <0.001 | ||
| Primigravida | 8(8.9) | 23(46) | |
| Muitigravida | 82(91.1) | 27(54) | |
| Cigarette smoking during pregnancy | 1.00 | ||
| Yes | 1(111) | 0 | |
| No | 88(97.8) | 50(100) | |
| aMissing data | 1(11) | 0 | |
| Hypertension in previous pregnancy | <0.001 | ||
| Yes | 7(7.8) | 15(30) | |
| No | 73(81.1) | 12(24) | |
| aPrimigravida | 8(8.9) | 23(46) | |
| aMissing data | 2(2.2) | 0 | |
| Interpregnancy interval | <0.001 | ||
| <10 years | 77(85.6) | 23(46) | |
| >10 years | 4(4.4) | 3(6) | |
| aPrimigravida | 8(8.9) | 23(46) | |
| aMissing data | 1(11) | 1(2.0) | |
| Family history ot hypertension | 0.040 | ||
| Yes | 23(26.6) | 21(42) | |
| No | 54(71.1) | 27(54) | |
| aMissing data | 3(3.3) | 2(4) | |
| Calcium therapy to prevent preeciampsia | 0.041 | ||
| Yes | 85(94.4) | 42(84) | |
| No | 5(5.6) | 8(16) | |
| Aspirin therapy to prevent preeciampsia | 0.67 | ||
| Yes | 2(2.2) | 2(4) | |
| Commenced before 16 weeks ot gestation | 1(11) | 2(4) | |
| Commenced after 16 weeks ot gestation | 1(11) | 0 | |
| No | 88(97.8) | 48(96) | |
| Postnatal | |||
| bPostpartum haemogiobin (g/d) | 11.50 ± 2.0 | 10.41 ± 2.0 | 0.003 |
| 4-item Perceived Stress Scale | 2.0[4.3] | 3.0[5.3] | 0.022 |
| cPain score (Numeric rating scale of 1 – 10) | |||
| Day 0 | 7.5 ± 2.5 | 6.8 ± 2.8 | |
| Day 1 | 5.0 ± 2.1 | 5.0 ± 2.1 | |
| Day 2 | 1.9 ± 1.9 | 2.6 ± 2.2 | |
| Day 3 | 0.6 ± 1.3 | 1.4 ± 1.9 | |
| Breast feeding | <0.001 | ||
| Yes | 87(96.7) | 39(78) | |
| No | 1(11) | 11(22) | |
| aMissing data | 2(2.2) | 0(0) | |
| 5 minutes Apgar score 0 – 6 | 2(2.2) | 9(18) | 0.002 |
| Birth weight < 2500g | 1(11) | 31(62) | <0.001 |
Excluded from p-value calculation.
Of all the participants, one participant with preeclampsia with severe features had postpartum blood transfusion.
Pain score was <1 in both groups prior to delivery. The pain on postpartum days 0–3 showed a non-significant effect of patient group, p = 0.447. Time had a significant effect on pain, P <0.001. Abbreviations: SBP, systolic blood pressure; DBP, diastolic blood pressure.
The daily mean BP (systolic ± SD/diastolic ± SD in mmHg) of the normotensive group were as follows: predelivery 112.2 ± 12.1/65.1 ± 10.7, day zero 114.2 ± 12.1/66.2 ± 9.5, day one 112.9 ± 11.1/67.5 ± 8.4, day two 113.1 ± 12.4/68.8 ± 11.2 and day three 114.1 ± 11.9/70.0 ± 9.7. The values for sPE were as follows: predelivery 143.0 ± 17.7/92.2 ± 12.3, day zero 135.0 ± 14.6/81.1 ± 10.4, day one 131.9 ± 13.5/81.5 ± 9.5, day two 140.3 ± 13.3/85.6 ± 10.9 and day three 143.1 ± 12.5/90.7 ± 9.5. Figure 1 shows the line graphs of the daily mean BPs. There was a significant effect of time on systolic BP (F-ratio 8.6, p < 0.001, partial ecta squared [pη2] = 0.08), and on diastolic BP (F-ratio 15.6, p < 0.001, pη2 = 0.14). Additionally, participant group had a significant effect on systolic BP (F-ratio 168.3, p < 0.001, Pη2 = 0.64) and on diastolic BP (F-ratio 163.9, p < 0.001, Pη2 = 0.63). When compared to the pre-delivery BPs, the daily mean systolic and diastolic BPs increased in the normotensive group but decreased in the sPE group on day zero postpartum. From day zero to day one postpartum, there was a decrease in the daily mean systolic and an increase in the daily mean diastolic BPs in both groups. Thereafter, the daily mean BPs in both groups progressively increased from postpartum days one to three. On postpartum days zero and three, the mean systolic BP of the normotensive group was approximately the same (with a slight decrease between these time points [Figure 1]).
Figure 1.
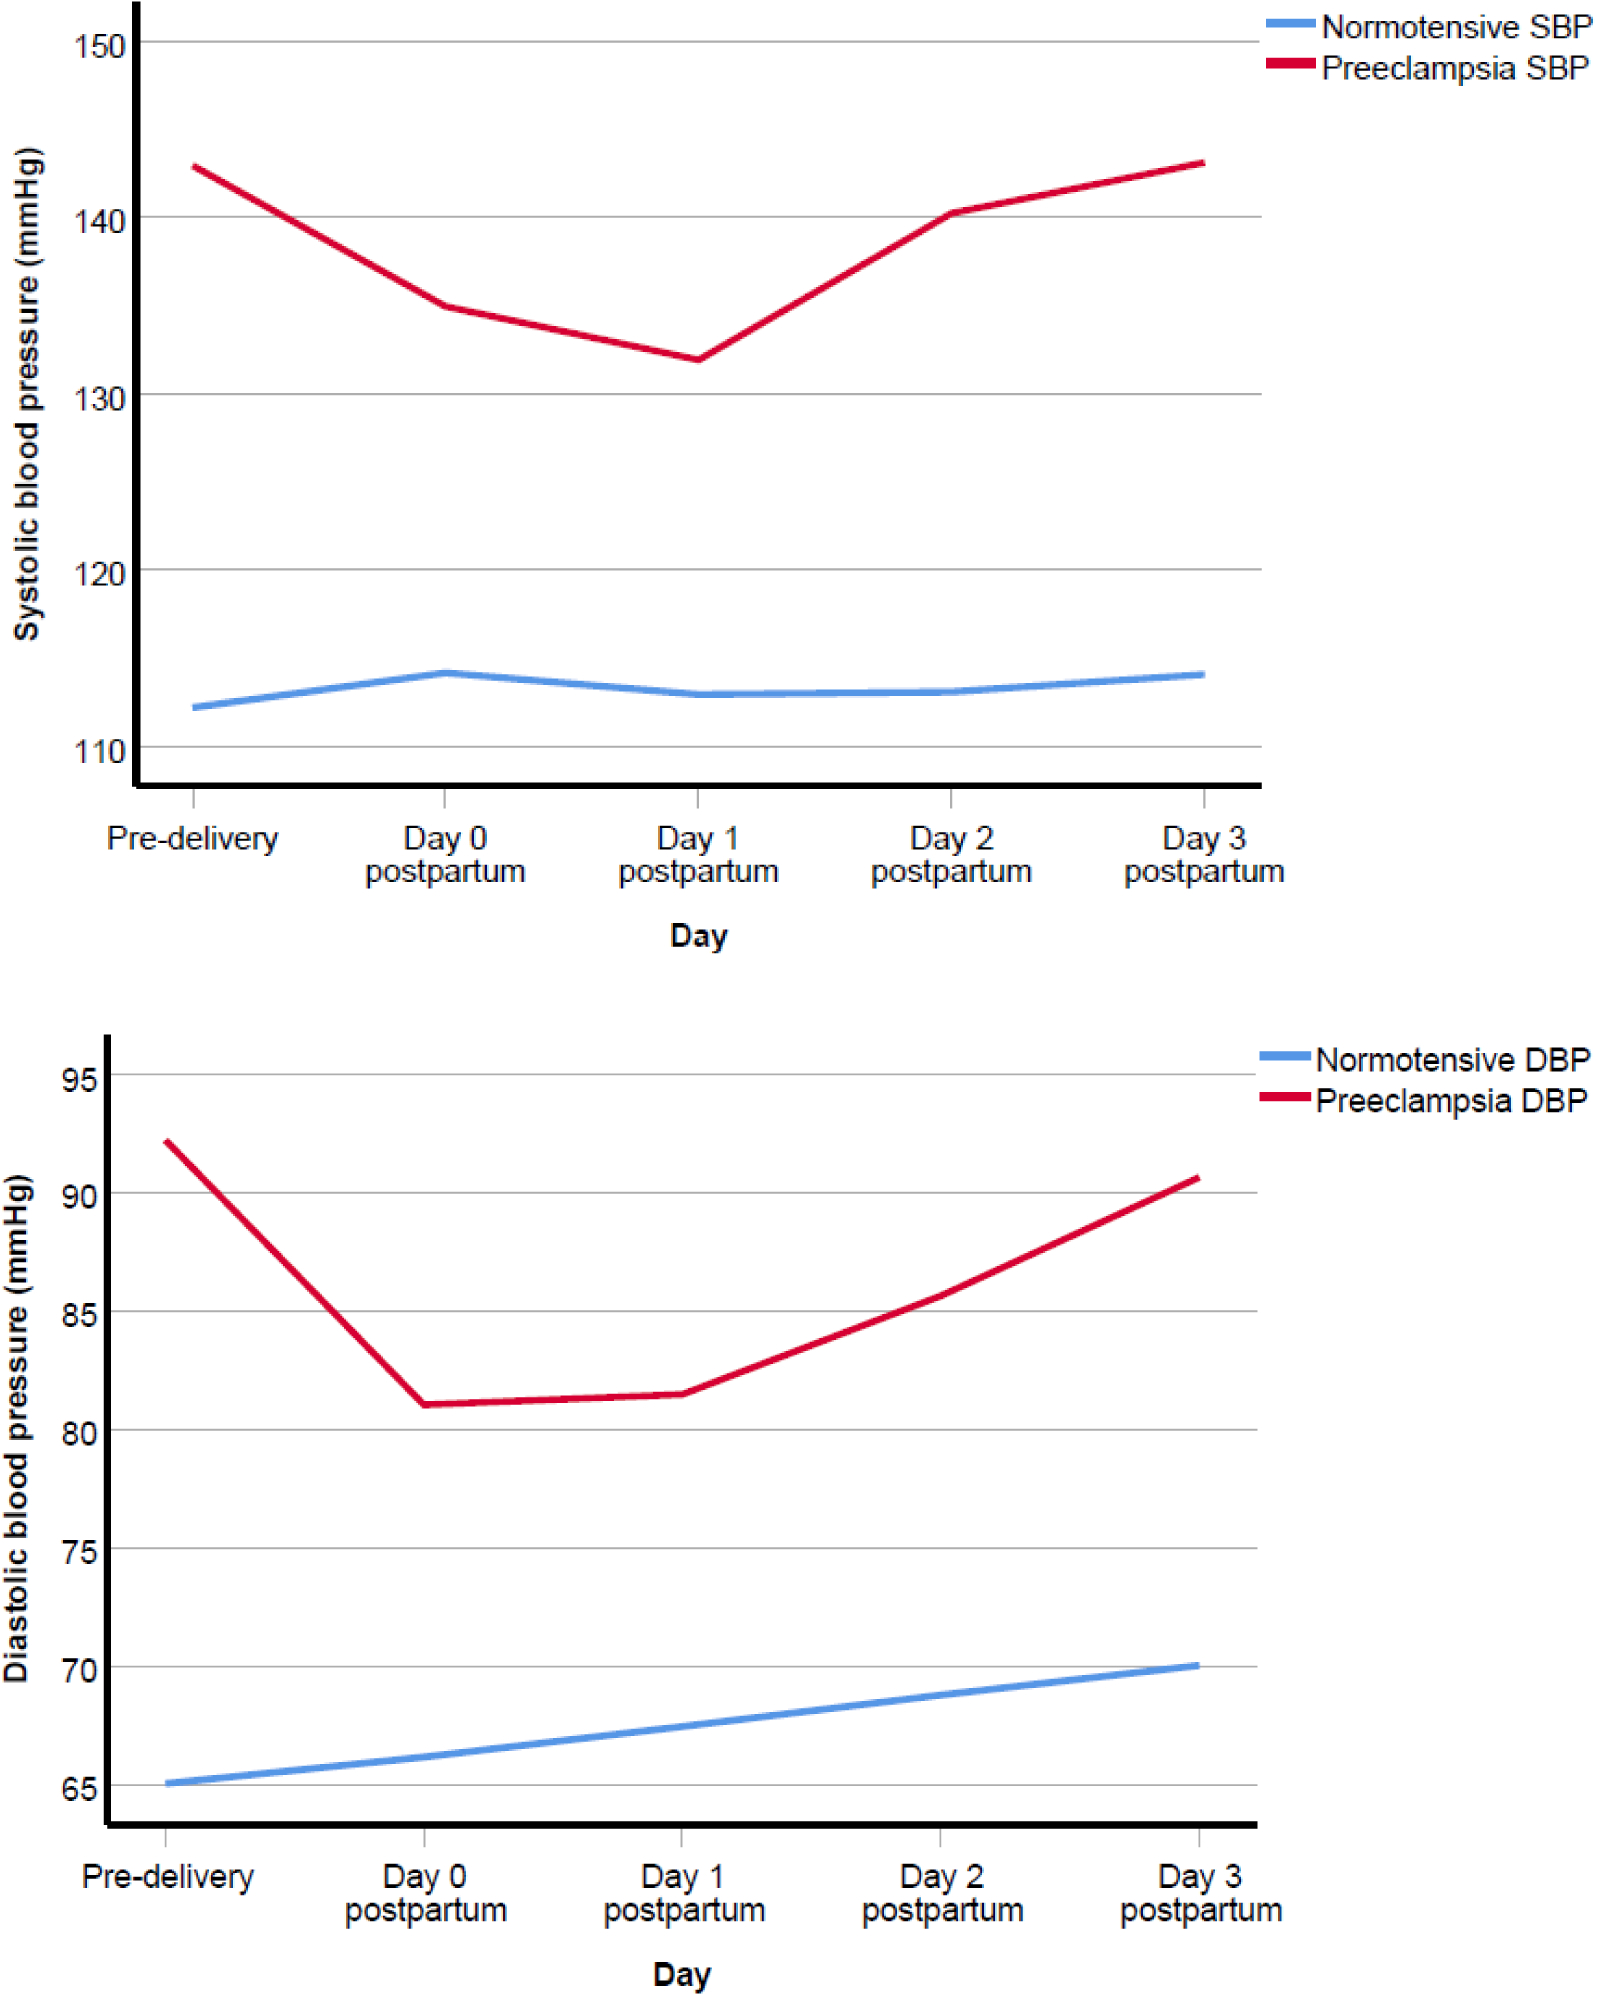
Mean pre-delivery and mean postpartum systolic blood pressure (SBP) and diastolic blood pressure (DBP).
The average increments in the mean daily BPs (systolic/diastolic) from postpartum days one to three were 5.6/4.6 mmHg in the sPE group and 0.6/1.3 mmHg in the normotensive group. Spinal anaesthesia exclusively was used for the delivery in 90% (45/50) of sPE and 95.6% (86/90) of the normotensive groups. De novo postpartum hypertension occurred in 24.4% (22/90) of the normotensive group, these being observed in 12, 6, 3, and 1 patient on postpartum days zero, one, two and three respectively. The characteristics of the normotensive group who either remained normotensive or developed de novo postpartum hypertension is shown in Table 2. In this group, the potential predictors of de novo postpartum hypertension were: systolic BP at booking (Area Under the Receiver Operating Characteristic Curve [AUROC] 0.7, CI 95% 0.5 – 0.8, p = 0.004, cut-off point 119 mmHg, sensitivity 68.2%, specificity 70.1%, PPV 42.9%, NPV 87.0%); systolic BP at 20 – 24 weeks’ gestation (AUROC 0.7, CI 95% 0.5 – 0.8, p = 0.031, cut-off point 116 mmHg, sensitivity 64.7%, specificity 66.7%, PPV 39.3%, NPV 85.0%); maternal weight before delivery (AUROC 0.7, CI 95% 0.5 – 0.8, p = 0.026, cut-off point 85 kg, sensitivity 68.2%, specificity 62.7%, PPV 37.5%, NPV 85.7%); and maternal body mass index before delivery (AUROC 0.7, CI 95% 0.5 – 0.8, p = 0.014, cut-off point 33.3 kg, sensitivity 68.2%, specificity 66.7%, PPV 41.7%, NPV 85.7%). Additionally, the risks of developing de novo postpartum hypertension based on the presence of the potential predictors follows:- (i) Systolic BP at booking ≥ 119 mmHg: RR 3.3, CI 95% 1.5 – 7.2, p = 0.003; (ii) highest systolic BP at 20 – 24 weeks’ gestation ≥ 116 mmHg: RR 2.6, CI 95% 1.1 – 6.2, p = 0.03; (iii) maternal weight before delivery ≥ 84.5 kg: RR 2.6, CI 95% 1.2 – 5.8, p = 0.017; and (iv) body mass index before delivery ≥ 33.3 kg/m2: RR 2.9, CI 95% 1.3 – 6.4, p = 0.008.
Table 2.
Characteristics of the normotensive group
| Variable | Value in mean ± SD or n (%) or median [inter quartile range] | P-value | |
|---|---|---|---|
| Remained normotensive, n = 68 | Had de novo postpartum hypertension, n = 22 | ||
| Prenatal | |||
| Age (years) | 29[8] | 27[10] | 0.944 |
| Maternal height (m) | 1.6[0.1] | 1.6[0.1] | 0.854 |
| Weight (kg) at booking visit | 74.1[21.1] | 81[21.9] | 0.081 |
| Body mass index (kg/m2) at booking visit | 28.8[8] | 31.4[8.8] | 0.060 |
| Gestational age (weeks) at booking visit | 14.5[8] | 12.5[7] | 0.602 |
| Parity | 0.37 | ||
| Primigravida | 7(10.3) | 1(4.5) | |
| Multigravida | 61(89.7) | 21(95.5) | |
| Family history of hypertension | 0.411 | ||
| Yes | 16(23.5) | 7(31.8) | |
| No | 50(73.5) | 14(63.6) | |
| aMissing data | 2(2.9) | 1(4.5) | |
| bSBP at booking visit | 115.7 ± 14.5 | 124.4 ± 19.7 | 0.007 |
| DBP at booking visit | 65.1 ± 10.7 | 66.9 ± 15.7 | 0.019 |
| bHighest SBP (mmHg) at 20–24 weeks | 111.2 ± 15.7 | 121.0 ± 8.3 | 0.040 |
| Highest DBP (mmHg) at 20–24 weeks | 64.0 ± 10.4 | 69.3 ± 9.6 | 0.283 |
| Gestational age (weeks) at delivery | 38.0 [1] | 38.0 [2] | 0.358 |
| bWeight (kg) before delivery | 83.2 [17] | 90.1 [15.6] | 0.026 |
| bBody mass index (kg/m2) at delivery | 32.2 [8.7] | 35.4 [6.0] | 0.014 |
| SBP (mmHg) in the ward before delivery | 111.7 ± 13.8 | 115.8 ± 12.5 | 0.087 |
| DBP (mmHg) in the ward before delivery | 67.0 ± 11.0 | 65.1 ± 12 | 0.510 |
| Haemoglobin (g/dl) at pre-delivery | 11.3 [1.4] | 11.2 [1.9] | 0.845 |
| sFlt-1 (pg/ml) before delivery | 2985 [2778] | 4968 [5427.9] | 0.222 |
| PIGF (pg/ml) before delivery | 453.4 [613.3] | 184.4 [424.3] | 0.082 |
| sFlt-1/PIGF ratio before delivery | 6.9 [12.9] | 47.6 [77.8] | 0.102 |
| Postnatal | |||
| Postpartum haemoglobin (g/dl) | 11.5 [2.8] | 10.7 [2.1] | 0.971 |
| 4-item Perceived Stress Scale | 1 [4.8] | 3.9[6.5] | 0.934 |
| cPain score (Numeric rating scale of 0 – 10) | |||
| Day 0 | 7.3 ± 2.8 | 8.1 ± 2.1 | |
| Day 1 | 5.2 ± 2.4 | 5.4 ± 2.0 | |
| Day 2 | 1.9 ± 1.7 | 3.3 ± 2.2 | |
| Day 3 | 0.4 ± 0.8 | 1.1 ± 2.0 | |
| Birth weight (kg) | 3002.2 ± 380.8 | 3414.3 ± 575.0 | 0.204 |
Excluded from p-value calculation.
Variable with significant p-value.
Pain score was <1 in both normotensive groups before delivery; and patient group had no effect on pain, p = 0.402, while time had significant effect on pain, p <0.001. Abbreviations: PIGF, Placental growth factor; SBP, Systolic blood pressure; sFlt-1, Soluble fms-like tyrosine kinase-1; DBP, Diastolic blood pressure.
The mean of daily highest BPs (systolic/diastolic) between days zero and three ranged from 118.7 – 125.6/74.8 – 76.6 mmHg in the normotensive group, and 148.1 – 157.9/91.2 −101.4 mmHg in the sPE group. The mean of the lowest daily BPs ranged from 102.9 – 109.4/56.3 – 64.0 mmHg in the normotensive group and 114.8 −128.4/68.1 – 80.7 mmHg in the sPE group.
Of the sPE group, 18/50 were diagnosed as early-onset preeclampsia, (EOPE [preeclampsia that manifests before 34 weeks gestation]), while 32/50 had late-onset preeclampsia (LOPE). Between postpartum days zero and three, the range of daily mean BP (EOPE vs LOPE) was systolic 133.6 – 143.8 vs 133.0 – 142.8 mmHg, and diastolic 81.3 – 93.7 vs 80.3 – 91.4 mmHg, although there were no adverse maternal outcomes.
Discussion
Key observations
In sPE, the BP decreased between predelivery period and postpartum day zero. There was a continuous increase in daily mean systolic and diastolic BPs in both sPE and normotensive groups from postpartum days one to three. The daily mean postpartum BP was higher in sPE than in the normotensive group. Fetal outcomes and maternal perceived stress scale were worse in the sPE than the normotensive group. De novo postpartum hypertension occurred in 24.4% (22/90) of the normotensive group. Maternal weight before delivery ≥ 84.5 kg and body mass index before delivery ≥ 33.3 kg/m2 were associated with the occurrence of de novo postpartum hypertension. sFlt-1/PIGF ratio was high in the hypertensive groups (sPE and de novo postpartum hypertension).
Relevance of the observations
Between postpartum days one to three, there was a continuous increase in BP levels in both groups. The average increase in the daily mean BPs (systolic/diastolic) from postpartum days one to three were 5.6/4.6 mmHg in sPE and 0.6/1.3 mmHg in the normotensive group. This may be partly attributable to the effects of fluid shift from the extra-to the intra-vascular space [9], but abnormal vascular relaxation and increased perceived maternal stress may also be a cause in sPE. In a previous study, the mean arterial pressure in 17 women diagnosed with preeclampsia was significantly higher than that in 62 normotensive healthy women who had CD [37]. It has also been shown that BP levels rise in the first four days postpartum, with an average increment of 6/4 mmHg in a normotensive group who had vaginal childbirth [38]. Another study involving 67 participants (42 with preeclampsia or chronic hypertension superimposed on preeclampsia, and 36 had CD), demonstrated that there was an average of 1–7 mmHg increment in both systolic and diastolic BP levels, with the BP rising to hypertensive levels between postpartum days three and six in most participants [39]. In the current study, daily mean BP levels of the normotensive group remained within normal limits, while those of the sPE increased to hypertensive levels on days two to three. Importantly, the systolic and diastolic BPs on postpartum day 0 was lower than the predelivery levels in women with sPE (Figure 1). This initial decrease may be misinterpreted by clinicians and regarded as the high blood pressure levels being “stabilized” and lead to erroneous early hospital discharge of women with sPE or less intense monitoring of their BP levels. The initial fall in levels of BP was subsequently followed by an increase (Figure 1). Therefore, BP should be monitored closely at least in the first 72 hours postpartum. The differences between the current study and others [38, 39] may be related to differing patient profiles given that treatment (such as analgesia, anti-hypertensive drugs and oxytocic agents) may affect BP levels. In the current study, we included only women with sPE who had CD and excluded those delivered vaginally as well as cases of preeclampsia without severe features. The findings of the present study lend credence to the recent International Society for the Study of Hypertension in Pregnancy (ISSHP) recommendation that BP levels should be monitored frequently in preeclampsia in the first three days following delivery [18]. Furthermore, the National Institute for Health and Clinical Excellence (NICE) guidelines advocate that the period of surveillance should be extended if the BP remains elevated [28]. This is critical, as normalization of BP levels in sPE may take up to 24 days postpartum to occur [40].
Despite the use of antihypertensive drug therapy, the daily mean postpartum BP levels were higher in the sPE group than the normotensive group. While managing puerperal hypertension has not been extensively studied [10], the most important factor that contributed to the high BP in sPE (more pronounced in EOPE then LOPE) is the pathological processes of this syndrome, [9] which probably accounted for the high rates of adverse perinatal outcomes and the high maternal perceived stress scale (Table 1) in this group. Additionally, adherence to clinical guidelines that recommend pharmacotherapy to treat pregnancy hypertension if BP ≥150/100 mmHg [28], and that when treating severe pregnancy hypertension the target BP is 140–150/90–100 mmHg [19], may account for the BPs levels in sPE observed in the present study. Future studies are needed to evaluate the safety of utilizing BP threshold of > 150/100 mmHg as an indication to commence postpartum antihypertensive therapy. Also, a Cochrane review (2013) on the prevention and treatment of postpartum hypertension concluded that there were no reliable data for managing postpartum hypertension [10]. Obtaining data on the management of hypertension in the immediate postpartum period is crucial, just as the emerging evidence that suggests that tight control of BP (ensuring diastolic BP < 85 mmHg) in nonproteinuric preexisting or gestational hypertension in the prenatal period may prevent maternal risks, such as severe hypertension, elevated liver enzymes and platelet counts ≤ 100 × 109/L [41]. Furthermore, a new definition of hypertension (BP ≥ 130/80 mmHg) has been recommended for use in the general adult population, with antihypertensive therapy being considered appropriate at this BP threshold if a 10-year risk of cardiovascular events exceeds 10% [42]. However, how the new diagnostic criteria will impact on the clinical management of HDP is uncertain. In the present study, 96%, 82%, 78% and 56% of sPE were on antihypertensive therapy on postpartum days zero, one, two and three respectively. This is not surprising, given that up to 28.4%, 26.2% and 19.2% of sPE have been reported to maintain the use of antihypertensive medication after three, six and 12 months of delivery respectively [43].
De novo postpartum hypertension occurred in 22/90 (24.4%) of the normotensive healthy group. However, only one of these patients required antihypertensive therapy due to the BP level exceeding the 150/100mmHg threshold. The rate of de novo postpartum hypertension in the current study is comparable to those of other studies: 26.5% in a combination of women who delivered either vaginally or abdominally [23], with the overall range being 0.3 – 27% of all pregnancies [44]. Some authors exclude the first 48 hours when assessing postpartum hypertension [23] while others [45, 46] include it and this may partly account for the wide variability in the incidence of de novo postpartum hypertension. Nonetheless, the warning signs associated with de novo postpartum hypertension identified in this study include systolic BP at booking ≥ 119 mmHg, highest systolic BP at 20 – 24 weeks’ gestation ≥ 116 mmHg, maternal weight before delivery ≥ 84.5 kg, and body mass index before delivery ≥ 33.3 kg/m2. A previous study has identified maternal age ≥ 40 years, black race, Latino ethnicity, final pregnancy body mass index ≥30 kg/m2 and gestational diabetes as being associated with de novo postpartum hypertension [45]. In another study, body mass index ≥34.1 kg/m2, highest antenatal systolic BP ≥ 127 mmHg, highest antenatal diastolic BP ≥ 78 mmHg, antenatal (9 – 96 hours before CD) median sFlt-1 ≥ 10 189 pg/ml and sFlt-1/PIGF ratio ≥ 52.1 were also associated with de novo postpartum hypertension [46]. In the present study, sFlt-1 and sFlt-1/PIGF ratio were higher in the normotensive group who developed de novo postpartum hypertension than in those who remained normotensive, but the levels were not statistically significant (Table 2). Expectedly, the angiogenic imbalance was higher in sPE than the normotensive group.
Strengths and Limitations
The authors acknowledge that this study has limitations which should be curtailed by future investigators of this topic. Future studies that include patients with other types of hypertensive disorders of pregnancy are required as they will assist to depict the contemporary postpartum haemodynamic changes. To ensure homogeneity of the groups, investigators of these future studies should consider matching participants using variables such as parity, age and body mass index which are associated with HDP. Additionally, the inclusion of a sufficient number of participants with EOPE as well as those with LOPE will be desirable to improve the comparison of postpartum BPs in both groups. Such comparison may show useful postpartum BP patterns given the understanding of the pathogenesis of the two entities. Briefly, EOPE occurs due to incomplete remodelling of spiral arteries while LOPE is associated with maternal risk such as obesity and develop following placental ageing and/or overgrowth of its vasculature [47, 48, 49]. In both entities, however, the processes cause syncytiotrophoblastic stress resulting in the release of pro-inflammatory factors into the mothers’ circulation [47, 48] and this postulate has gained wide acceptance [9, 50, 51]. Another limitation of the study includes the limited availability of recent data on BP patterns in the immediate postpartum period in sPE and normotensive pregnancies which restricts a literature comparison. Furthermore, the introduction of prophylactic therapy (calcium and or aspirin as shown in Table 1) prior to the development of preeclampsia, and/or the administration of antihypertensive treatment before the diagnosis of sPE, may cause a treatment paradox [52] on the effect that risk factors have on postpartum BP patterns. This implies that these medications might have possibly modified the effects of risk factors on the outcome measures. Furthermore, the administration of antihypertensive drugs to most patients in sPE group affects the primary endpoint, i.e. the BP. Unfortunately, the drug treatment of hypertension was indicated clinically, and it will be injudicious and harmful to deny such therapy for research purposes. Studies on assessment of BP in patients who are on antihypertensive agents face this challenge which we consider as an indicated cofounder. Moreover, MgSO4 may lower BP although it is not recommended to be used as an antihypertensive drug. Therefore, the assessment of haemodynamic changes that occur after stopping MgSO4 is of research interest and should be considered in future studies.
The present study has strength in being one of the few of its kind in contemporary obstetric practice. The inclusion of participants who had CD afforded the opportunity to investigate those who had similar modes of delivery, which assists in preventing the selective influence of specific delivery practices, such as spinal anaesthesia, that may be regarded as confounders biasing the data. The study provides important information on BP patterns in the immediate postpartum period, as a poor clinical judgement on any variable that affects BP in the puerperium has the potential to result in life-threatening complications [3].
Recommendations on postpartum follow-up of normotensive pregnant women
To prevent de novo postpartum hypertension in settings with a high burden of HDP such as South Africa, lifestyle modifications and management of risk factors for preeclampsia including the treatment of metabolic syndrome should be commenced prior to conception. During pregnancy, calcium supplementation should be provided to all normotensive pregnant women in countries with low dietary calcium levels while prophylactic aspirin should be offered to those at increased risk of preeclampsia. Identification of a warning sign associated with de novo postpartum hypertension should prompt increased surveillance in the postpartum period.
Patients with a warning sign or those who develop de novo postpartum hypertension should be managed as inpatients for at least 3 days postpartum and reviewed on days 6 and 42 postpartum. Such a patient should be advised to measure her BP at home with a device validated for use in pregnancy [53] and contact the health facility if she develops hypertension (≥ 140/90 mmHg) and/or feels ill. From the authors’ clinical experiences, some patients manifest with symptoms of impending eclampsia for the first time in the immediate postpartum period, and the development of such symptoms should prompt further clinical evaluation and appropriate management.
On the other hand, women who remain normotensive postpartum without a warning sign may be discharged from the hospital as soon as they are clinically fit and followed up between days 6 −10 postpartum for BP and CD wound assessment as well as reviewed in the postnatal clinic on day 42.
Conclusion
Following CD in normotensive pregnancy and sPE, BP changes occur in the immediate postpartum period. An understanding of the postpartum BP patterns is required to ensure that adequate plans are made to cater for the health needs of these pregnant women. The occurrence of a decrease in BP in the immediate postpartum period in sPE should not lead to their erroneous early hospital discharge. Future research that includes women who had vaginal delivery will further advance the understanding of contemporary postpartum BP patterns.
Supplementary Material
Acknowledgements
This work was supported by the Office of Global AIDS Coordinator and the U. S. Department of Health and Human Services, National Institutes of Health (NIH OAR and NIH OWAR) under Grant number 5R24TW008863. The contents of this publication are solely the responsibility of the authors and do not necessarily represent the official views of the government. We also wish to thank the South African National Health Laboratory Service (in Edendale Hospital) for preserving the serum samples, Roche for providing the sFlt-1 and PIGF reagents, and Ampath Laboratory in Durban, South Africa for measuring the serum concentrations of sFlt-1 and PIGF.
Footnotes
Conflicts of interest
None.
References
- 1.World Health Organization. World health statistics 2016: monitoring health for the SDGs, sustainable development goals. Geneva, Switzerland: World Health Organization; 2016. [Google Scholar]
- 2.Reinebrant HE, Leisher SH, Coory M, et al. Making stillbirths visible: a systematic review of globally reported causes of stillbirth. BJOG 2018;125(2):212–224. doi: 10.1111/1471-0528.14971. [DOI] [PubMed] [Google Scholar]
- 3.National Committee on the Confidential Enquiries into Maternal Deaths. Saving Mothers 2014–2016: Seventh triennial report on confidential enquiries into maternal deaths in South Africa: Short report. Pretoria: South African Department of Health 2018. [Google Scholar]
- 4.Granger JP, LaMarca BB, Cockrell K, et al. Reduced uterine perfusion pressure (RUPP) model for studying cardiovascular-renal dysfunctionin response to placental ischemia. Methods Mol Med 2006;122:383–392. [DOI] [PubMed] [Google Scholar]
- 5.Maynard SE, Min J-Y, Merchan J, et al. Excess placental soluble fms-like tyrosine kinase 1 (sFlt1) may contribute to endothelial dysfunction, hypertension, and proteinuria in preeclampsia. J Clin Invest 2003;111:649–658. [DOI] [PMC free article] [PubMed] [Google Scholar]
- 6.Society of Obstetricians and Gynaecologists of Canada (SOGC). Clinical Practice Guidelines. Diagnosis, Evaluation, and Management of the Hypertensive Disorders of Pregnancy: Executive Summary. No. 307. J Obstet Gynaecol Can 2014;36(5):416–438. [DOI] [PubMed] [Google Scholar]
- 7.Kuhn JC, Falk RS, Langesæter E. Haemodynamic changes during labour: continuous minimally invasive monitoring in 20 healthy parturients. Int J Obstet Anesth 2017;3(31):74–83. doi: 10.1016/j.ijoa.2017.03.003. [DOI] [PubMed] [Google Scholar]
- 8.Rosseland LA, Hauge TH, Grindheim G, et al. Changes in blood pressure and cardiac output during cesarean delivery: the effects of oxytocin and carbetocin compared with placebo. Anesthesiology 2013;119(3):541–551. doi: 10.1097/ALN.0b013e31829416dd. [DOI] [PubMed] [Google Scholar]
- 9.Ngene NC, Moodley J. Physiology of blood pressure relevant to managing hypertension in pregnancy. J Matern Fetal Neonatal Med 2017. November 27:1–10. 10.1080/14767058.2017.1404569 [DOI] [PubMed] [Google Scholar]
- 10.Magee L, von Dadelszen P. Prevention and treatment of postpartum hypertension. Cochrane Database of Systematic Reviews 2013, Issue 4 Art No: CD004351 DOI: 101002/14651858CD004351pub3. [DOI] [PMC free article] [PubMed] [Google Scholar]
- 11.World Health Organization. Obesity and overweight Fact sheet 2017. Available from: http://www.who.int/mediacentre/factsheets/fs311/en/ (accessed 20 January 2018)
- 12.Statistics South Africa. South Africa Demographic and Health Survey 2016: Key Indicators Report 2017. Available from: https://www.statssa.gov.za/publications/Report%2003-00-09/Report%2003-00-092016.pdf (accessed 20 January 2018)
- 13.Douglas K, Redman C. Eclampsia in the United Kingdom. BMJ 1994;309:1395–400. [DOI] [PMC free article] [PubMed] [Google Scholar]
- 14.Moodley J, Kalane G. A review of the management of eclampsia: practical issues. Hypertens Pregnancy 2006;25(2):47–62. doi: 10.1080/10641950500543897. [DOI] [PubMed] [Google Scholar]
- 15.Moodley J, Onyangunga O, Maharaj N. Hypertensive disorders in primigravid black South African women: A one-year descriptive analysis. Hypertens Pregnancy 2016;35(4):529–535. [DOI] [PubMed] [Google Scholar]
- 16.Guida JP, Costa ML, Parpinelli MA, et al. The impact of hypertension, hemorrhage, and other maternal morbidities on functioning in the postpartum period as assessed by the WHODAS 2.0 36-item tool. Int J Gynaecol Obstet 2018;141 Suppl 1:55–60. doi: 10.1002/ijgo.12467. [DOI] [PMC free article] [PubMed] [Google Scholar]
- 17.EQUATOR (Enhancing the QUAlity and Transparency Of health Research) Network. STROBE Statement—Checklist of items that should be included in reports of cohort studies. Available from: http://www.equator-network.org/reporting-guidelines/strobe/ (accessed 2 November 2018)
- 18.Brown M, Magee LA, Kenny LC, et al. The hypertensive disorders of pregnancy: ISSHP classification, diagnosis & management recommendations for international practice. Pregnancy Hypertens 2018;13:291–310. doi: 10.1016/j.preghy.2018.05.004 [DOI] [PubMed] [Google Scholar]
- 19.National Department of Health Republic of South Africa. Guidelines for maternity care in South Africa: A manual for clinics, community health centres and district hospitals 2015. Available from: https://www.health-e.org.za/wp-content/uploads/2015/11/Maternal-Care-Guidelines-2015_FINAL-21.7.15.pdf (accessed 14 July 2018)
- 20.Henderson JT, Thompson JH, Burda BU, et al. Screening for Preeclampsia: A Systematic Evidence Review for the U.S. Preventive Services Task Force. Evidence Synthesis No. 148 AHRQ Publication No. 14-05211-EF-1 Rockville, MD: Agency for Healthcare Research and Quality; 2017. Available from: https://www.ncbi.nlm.nih.gov/books/NBK447462/pdf/Bookshelf_NBK447462.pdf (accessed 31 October 2018) [PubMed] [Google Scholar]
- 21.Regitz-Zagrosek V, Roos-Hesselink JW, Bauersachs J, et al. 2018 ESC Guidelines for the management of cardiovascular diseases during pregnancy. Eur Heart J 2018;39(34):3165–3241. doi: 10.1093/eurheartj/ehy340. [DOI] [PubMed] [Google Scholar]
- 22.Moodley J, Ngene NC. Spontaneous liver haematoma rupture associated with pre-eclampsia in a low- to middle-income country: Lessons to be learnt from maternal death assessments. S Afr Med J. 2018;108(10):809–812. doi: 10.7196/SAMJ.2018.v108i10.13280. [DOI] [Google Scholar]
- 23.Kang E, Sugarman R, Ramadan H, et al. Prevalence, risk factors and associated complications of postpartum hypertension in rural Haiti. Pregnancy Hypertens 2017;10:135–142. doi: 10.1016/j.preghy.2017.07.143. [DOI] [PubMed] [Google Scholar]
- 24.Powers RW, Roberts JM, Cooper KM, et al. Maternal serum soluble fms-like tyrosine kinase 1 concentrations are not increased in early pregnancy and decrease more slowly postpartum in women who develop preeclampsia. Am J Obstet Gynecol 2005;193(1):185–191. doi: 10.1016/j.ajog.2004.11.038. [DOI] [PubMed] [Google Scholar]
- 25.Roche Diagnostics GmbH. Elecsys sFlt-1 Immunoassay, Package Insert (ms_05109523190.V9.en) Sandhofer Strasse 116, D-68305 Mannheim, Germany: 2018. [Google Scholar]
- 26.Roche Diagnostics GmbH. Elecsys PlGF Immunoassay, Package Insert (ms_05144671190.V10.en) Sandhofer Strasse 116, D-68305 Mannheim, Germany: 2018. [Google Scholar]
- 27.Ngene N, Onyia C, Moodley J, et al. Needlestick injury in a pregnant inpatient in an overcrowded hospital. South Afr J HIV Med 2014;15(2):66–68. [Google Scholar]
- 28.National Institute for Health and Clinical Excellence. Hypertension in pregnancy: diagnosis and management 2010. Available from: https://www.nice.org.uk/guidance/cg107 (accessed 8 March 2018)
- 29.Ngene NC, Moodley J. Baseline check of blood pressure readings of an automated device in severe pre-eclampsia and healthy normotensive pregnancy. Pregnancy Hypertens 2018;12:47–52. doi: 10.1016/j.preghy.2018.02.013. [DOI] [PMC free article] [PubMed] [Google Scholar]
- 30.Hypertension guideline working group: Seedat YK, Rayner B, Veriava Y. South African Hypertension Guideline 2014. Cardiovasc J Afr 2014;25(6):288–294. doi: 10.5830/CVJA-2014-062. [DOI] [PMC free article] [PubMed] [Google Scholar]
- 31.National Department of Health Republic of South Africa. A monograph on caesarean section 2013. Available from: http://www.kznhealth.gov.za/family/Caesarean-monograph-2013.pdf (assessed 14 July 2018)
- 32.Cohen S, Kamarck T, Mermelstein R. A global measure of perceived stress. J Health Soc Behav 1983;24(4):385–396. [PubMed] [Google Scholar]
- 33.Karam F, Bérard A, Sheehy O, et al. Reliability and Validity of the 4-Item Perceived Stress Scale Among Pregnant Women: Results From the OTIS Antidepressants Study. Res Nurs Health. 2012;35(4):363–375. [DOI] [PubMed] [Google Scholar]
- 34.MacArthur Research Network on Socioeconomic Status and Health. Perceived Stress Scale-4 Item. Available from: https://macses.ucsf.edu/research/psychosocial/pss4.php (accessed 10 September 2018)
- 35.Barton B, Peat J. Medical statistics: A guide to SPSS, data analysis and critical appraisal. 2nd ed. West Sussex, UK: John Wiley & Sons Ltd; 2014. [Google Scholar]
- 36.Cleophas TJ, Zwinderman AH. SPSS for Starters and 2nd Levelers. 2 ed Switzerland: Springer; 2016. [Google Scholar]
- 37.Lavie A, Ram M, Lev S, et al. Maternal cardiovascular hemodynamics in normotensive versus preeclamptic pregnancies: a prospective longitudinal study using a noninvasive cardiac system (NICaS™). BMC Pregnancy Childbirth 2018;18(1):229. doi: 10.1186/s12884-018-1861-7. [DOI] [PMC free article] [PubMed] [Google Scholar]
- 38.Walters BNJ, Thompson ME, Lee A, et al. Blood pressure in the puerperium. Clin Sci. 1986;71:589–594. [DOI] [PubMed] [Google Scholar]
- 39.Walters BNJ, Walters T. Hypertension in the puerperium. Lancet. 1987;330(8554):330. [DOI] [PubMed] [Google Scholar]
- 40.Itaya Y, Ono Y, Takagi K, et al. Postpartum recovery course of hypertension and proteinuria in severe preeclampsia patients. Int J Gynaecol Obstet 2009;107(Suppl 2):S459–S459. [Google Scholar]
- 41.Magee LA, von Dadelszen P, Rey E, et al. Less-tight versus tight control of hypertension in pregnancy. N Engl J Med 2015;372(5):407–17. doi: 10.1056/NEJMoa1404595. [DOI] [PubMed] [Google Scholar]
- 42.American College of Cardiology/American Heart Association Task Force on Clinical Practice Guidelines. 2017. ACC/AHA/AAPA/ABC/ACPM/AGS/APhA/ASH/ASPC/NMA/PCNA Guideline for the Prevention, Detection, Evaluation, and Management of High Blood Pressure in Adults: A Report of the American College of Cardiology/American Heart Association Task Force on Clinical Practice Guidelines. Available from: http://www.onlinejacc.org/content/71/19/e127 (accessed 26 July 2018)
- 43.Costa RA Sr., Silva VdS, Dias DB, et al. Postpartum evaluation of blood pressure and proteinuria in women with severe preeclampsia. Pregnancy Hypertens 2015; 5(1):71–71. doi: 10.1016/j.preghy.2014.10.142. [DOI] [Google Scholar]
- 44.Sibai BM. Etiology and management of postpartum hypertension-preeclampsia. Am J Obstet Gynecol 2012;206(6):470–475. [DOI] [PubMed] [Google Scholar]
- 45.Bigelow CA, Pereira GA, Warmsley A, et al. Risk factors for new-onset late postpartum preeclampsia in women without a history of preeclampsia. Am J Obstet Gynecol 2014;210(4):338.e1–338.e8. doi: 10.1016/j.ajog.2013.11.004. [DOI] [PubMed] [Google Scholar]
- 46.Goel A, Maski MR, Bajracharya S, et al. Epidemiology and Mechanisms of De Novo and Persistent Hypertension in the Postpartum Period. Circulation 2015;132(18):1726–1733. doi: 10.1161/CIRCULATIONAHA.115.015721. [DOI] [PMC free article] [PubMed] [Google Scholar]
- 47.Roberts JM, Redman CWG, Global Pregnancy Collaboration. Global Pregnancy Collaboration symposium: Prepregnancy and very early pregnancy antecedents of adverse pregnancy outcomes: Overview and recommendations. Placenta 2017;pii: S0143–4004(17):30661–6. doi: 10.1016/j.placenta.2017.07.012. [DOI] [PMC free article] [PubMed] [Google Scholar]
- 48.Staff AC, Redman CWG. The Differences Between Early- and Late-Onset Pre-eclampsia In: Saito S, editor. Preeclampsia: Basic, Genomic, and Clinical. Comprehensive Gynecology and Obstetrics Singapore: Springer Nature; 2018. p. 157–172. [Google Scholar]
- 49.Kwiatkowski S, Dołęgowska B, Kwiatkowska E, et al. Do the physiological aging of the placenta and the changes in angiogenesis marker sFlt-1 and PlGF concentrations predispose patients to late-onset preeclampsia? J Matern Fetal Neonatal Med 2019;32(1):11–20. doi: 10.1080/14767058.2017.1369517. [DOI] [PubMed] [Google Scholar]
- 50.Ngene NC, Moodley J. Role of angiogenic factors in the pathogenesis and management of pre-eclampsia. Int J Gynaecol Obstet 2018;14(1):5–13. doi: 10.1002/ijgo.12424. [DOI] [PubMed] [Google Scholar]
- 51.Bhorat I. Pre-eclampsia and the foetus: Cardiovascular perspective. Cardiovasc J Afr 2018;29(6):237–393. doi: 10.5830/CVJA-2017-039. [DOI] [PMC free article] [PubMed] [Google Scholar]
- 52.Magee LA, von Dadelszen P, Singer J, et al. Can adverse maternal and perinatal outcomes be predicted when blood pressure becomes elevated? Secondary analyses from the CHIPS (Control of Hypertension In Pregnancy Study) randomized controlled trial. Acta Obstet Gynecol Scand 2016;95(7):763–776. doi: 10.1111/aogs.12877. [DOI] [PMC free article] [PubMed] [Google Scholar]
- 53.Ngene CN, Moodley J. Blood pressure measurement in pregnancy and in hypertensive disorders of pregnancy: devices, techniques, and challenges. Cardiovasc J Afr. Accepted for publication on 31 October 2018. [DOI] [PubMed] [Google Scholar]
Associated Data
This section collects any data citations, data availability statements, or supplementary materials included in this article.