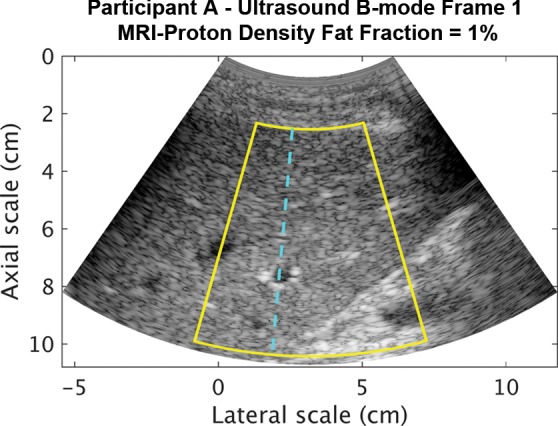
Figure 2a:

Data from 22-year-old woman with low proton density fat fraction (1%) (control participant, denoted participant A). Computer-reconstructed nonenhanced ultrasound B-mode images (sagittal plane with time gain compensation) and the underlying radiofrequency signals. (a) B-mode image frame 1 (with time gain compensation), with yellow outline superimposed to indicate the region of interest for deep learning analysis. (b) Radiofrequency signals corresponding to the blue line in a, without and with time gain compensation. (c) B-mode image frame 2 (with time gain compensation). (d) Radiofrequency signals corresponding to same location as indicated by the blue line in c but different frames (blue = frame 1, black = frame 2) without and with time gain compensation. Fixed region of interest includes signals from outside the liver.
