Abstract
Use of growth retardants enables post-planting optimization of vegetative growth, which is particularly important with the on-going climate change. Mepiquat chloride is an economical and safe retardant widely applied in cotton, but is not uniformly effective. Here identification of its molecular target as the ent-copalyl diphosphate synthase that initiates gibberellin biosynthesis enabled introduction of selective agrochemical inhibition, leaving intact more specialized metabolism important for resistance to biotic and abiotic stresses.
The gibberellin A (GA) phytohormones play a key role in promoting shoot elongation and vegetative growth1. Accordingly, GA metabolism is a critical agrochemical target as many agriculturally relevant plant-growth retardants, often used as anti-lodging agents in cereal crop plants, have been shown to act by inhibiting GA biosynthesis2.
GAs are diterpenoids originating from (E,E,E)-geranygeranyl diphosphate (GGPP), which is initially cyclized to ent-copalyl diphosphate (ent-CPP) by an ent-CPP synthase (CPS), with further cyclization catalyzed by ent-kaurene synthase (KS), followed by extensive elaboration catalyzed by cytochrome P450 (CYP) mono-oxygenases and, subsequently, 2-oxoglutarate dependent di-oxygenases (2ODDs)3. Both CYPs and 2ODDs form large enzymatic families in plants that are employed by many other metabolic processes as well4,5. Thus, while GA biosynthesis can be blocked by general inhibitors such as structural mimics of 2-oxoglutarate and nitrogenous heterocycles, which target 2ODDs and CYPs, respectively, these also retard other essential metabolism2.
Beyond the oxygenases, the CPS and KS from GA biosynthesis have repeatedly undergone gene duplication and neo-functionalization to give rise to more specialized (di)terpenoid metabolism that typically plays important roles in plant defense6. Although structurally and mechanistically distinct, these cyclases both catalyze carbocationic cascade reactions7. Hence, it has been proposed that their inhibition by positively charged compounds such as the quaternary ammonium-containing mepiquat chloride (1,1-dimethyl-piperidinium chloride, DPC), chlormequat chloride and Amo 1618, is due to electronic analogy of these compounds to the relevant high-energy intermediates2, although there is little other structural similarity. However, at least the latter two of these agriculturally-utilized plant growth inhibitors largely target CPS rather than KS8.
The CPS from GA metabolism exemplifies the enzymatic family of class II diterpene cyclases, which initiate biosynthesis of the large (~7,000 known) labdane-related diterpenoid natural product super-family9. These compounds are particularly important in cereal plant defense10. Accordingly, the use of general inhibitors of class II diterpene cyclases might be expected to block not only plant growth (i.e., via the targeted GA biosynthesis), but defense as well (i.e., via inadvertent interference with more specialized labdane-related diterpenoid metabolism), particularly in this critical crop plant family. Thus, while offering the advantage of post-planting control of vegetative growth, which will be of increasing agronomic value given the variability in weather associated with climate change, such agrochemical manipulation of GA biosynthesis might also impose adverse effects due to inhibition of important more-specialized metabolic processes as well. Intriguingly, there is evidence of selectivity for at least some GA inhibitors. In particular, while highly effective in cotton (Gossypium hirsutum) where it is widely used, DPC is much less potent in many other plants – e.g., rice (Oryza sativa) and maize (Zea mays)11.
Here the selective nature of DPC inhibition was investigated. Based on the working hypothesis that DPC targets CPS, the recently identified cotton GhCPS12 was expected to be sensitive to inhibition. Given the reported insensitivity of maize, which was verified here (Supplementary Fig. S1), and the early identification of the ZmCPS1 (An1) primarily associated with GA metabolism in maize13, this was expected to be insensitive. Their susceptibility was examined in a transgenic approach using the model plant A. thaliana for which there are known AtCPS (GA1) mutants, with both severely (ga1–1) and moderately (ga1–5) dwarfed lines available14. Given that the parental/wild-type (WT) A. thaliana var. Landsberg erecta (Arabidopsis) is moderately susceptible to growth inhibition by DPC (and consistent with the expected effect this can be reversed by application of bioactive GA; Supplementary Fig. S2), in addition to GhCPS and ZmCPS1, AtCPS also was expressed in both ga1–1 and ga1–5 Arabidopsis. As expected, all three CPSs were able to complement the dwarf phenotype of both ga1 mutants (Supplementary Fig. S3). Consistent with its ability to genetically complement ga1, GhCPS is correctly localized to plastids/chloroplasts (Supplementary Fig. S4). Strikingly, these transgenic lines exhibited very different responses to DPC. While the ga1 lines expressing AtCPS exhibited moderate susceptibility to growth retardation similar to WT Arabidopsis (Extended Data Fig. E1), the ZmCPS1 complemented lines are almost completely resistant and the GhCPS complemented lines were significantly more sensitive (Fig. 1). Analogous expression of these CPSs in WT Arabidopsis confirmed the dominant role of CPS susceptibility to the effect of DPC on plant growth (Extended Data Fig. E2). Thus, DPC not only seems to target CPS, but also do so in a selective manner.
Figure 1.
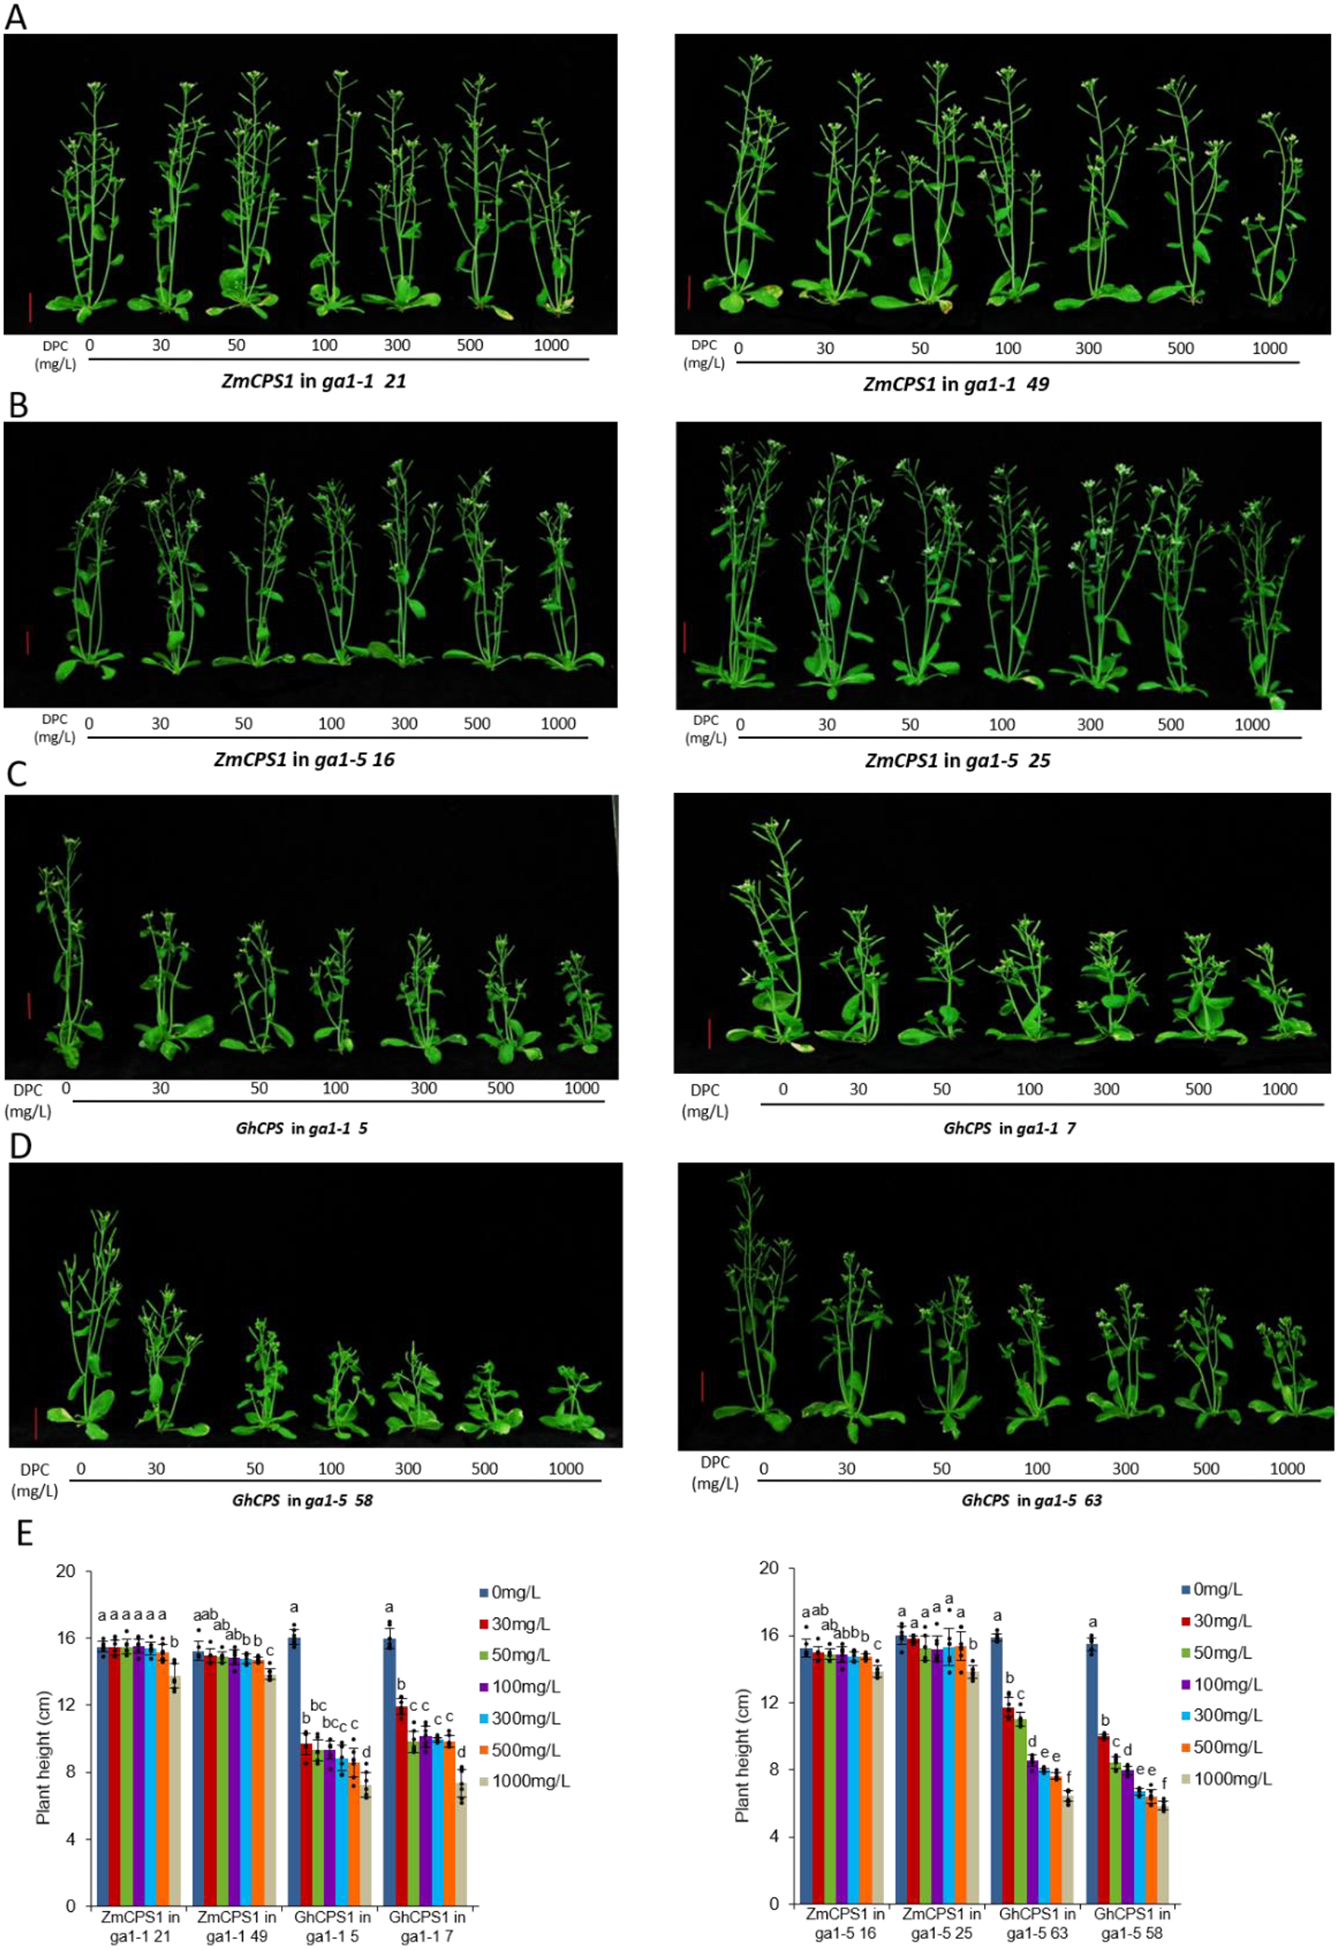
DPC targets CPS. Effect of DPC on transgenic Arabidopsis (ga1 mutants) expressing either ZmCPS1 or GhCPS. Pictured are A) ga1–1 + ZmCPS1; B) ga1–5 + ZmCPS1; C) ga1–1 + GhCPS; D) ga1–5 + GhCPS plants to which DPC has been applied at the indicated concentrations (vertical red bars = 2 cm), as well as E) histograms of plant heights (n=7; means ± s.d., while letters (a – f) indicate significant differences – i.e. P < 0.05 for two-sided Fisher’s LSD – dots indicate values measured for individual plants).
To further investigate the utility of GhCPS for introduction of selective growth retardation by DPC, a similar transgenic approach was employed in maize. To generate the appropriate genetic background ZmCPS1/An1 was targeted for mutagenesis via the CRISPR/Cas9 method. As previously reported13, homozygous zmcps1/an1 knock-out mutants exhibit severe defects in seed development, and the ear sheath essentially blocks application of bioactive GA3, complicating propagation. Thus, the work reported here was carried out with diallelic zmcps1/an1 mutant plants, with one allele carrying a single base insertion and the other an in-frame three-base deletion, as the latter apparently is not disruptive (i.e., plants homozygous for this single amino acid deletion exhibited normal growth and development), that do exhibit impaired growth (Supplementary Fig. S5). Diallelic embryos were then transformed with a GhCPS expression construct, and the resulting expression levels measured (Extended Data Fig. E3). In contrast to WT maize, these transgenic plants do respond to DPC (Extended Data Fig. E4), particularly those that remain diallelic (Fig. 2), which also exhibited higher GhCPS expression levels. Although the effect is limited, this presumably reflects the fact that an1 mutants only exhibit a semi-dwarf phenotype13, which is due to the presence of another maize CPS (An2/ZmCPS2) that produces ent-CPP15 and must partially complement the loss of An1/ZmCPS1 in an1 plants as the other maize CPSs exhibit different activity16. The limited effectivity of DPC in these transgenic maize plants suggests that ZmCPS2 also is insensitive. Importantly, DPC application did not reduce grain numbers or weight (Extended Data Table E1), demonstrating that DPC sensitivity can be introduced into maize without impacting yield.
Figure 2.
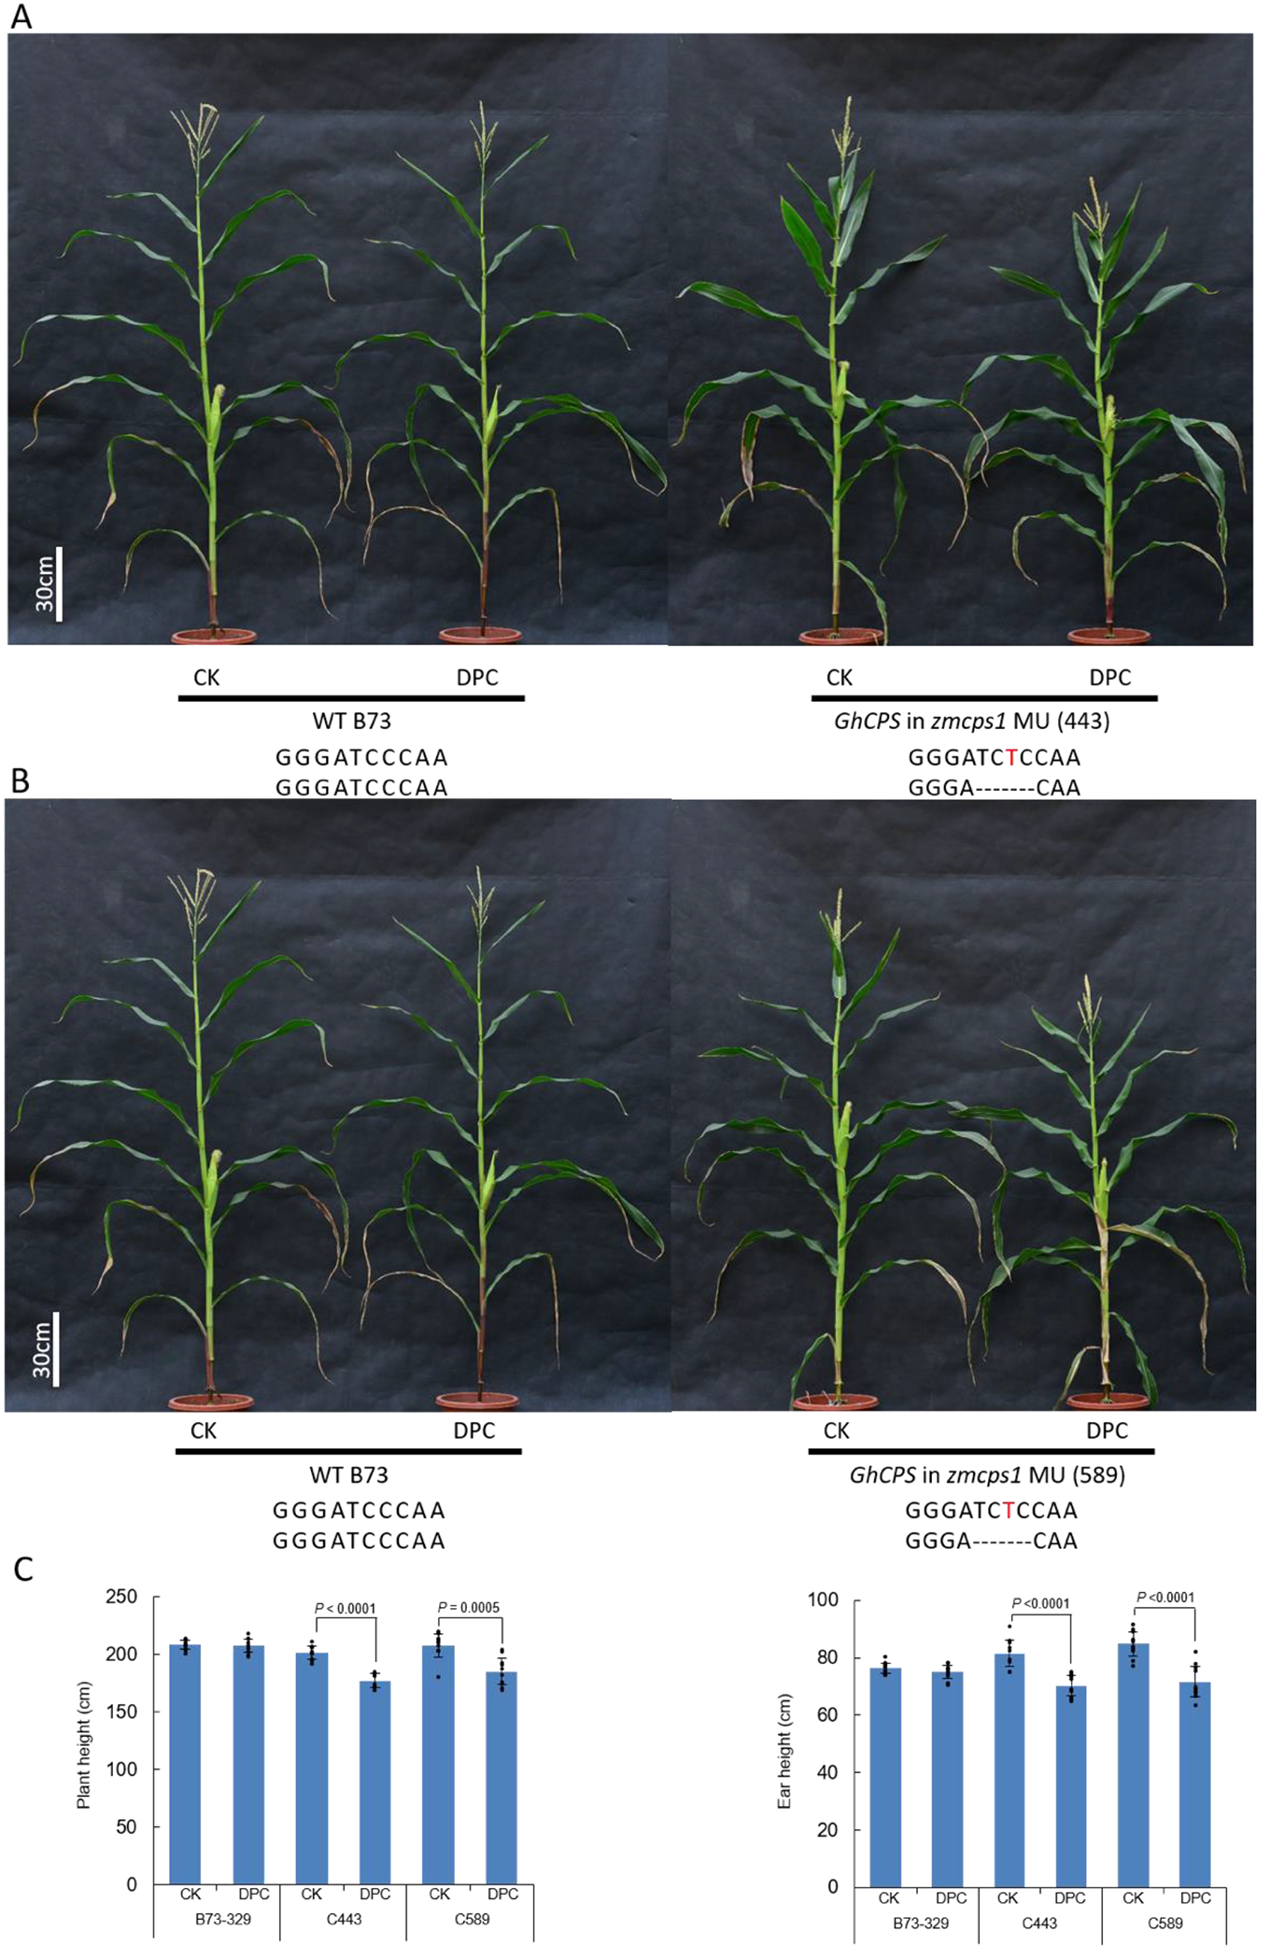
Introducing DPC sensitivity into maize. Effect of DPC on transgenic maize, specifically zmcps1/an1 mutants also expressing GhCPS. Pictured are A) GhCPS in zmcps1 MU (443); B) GhCPS in zmcps1 MU (589) plants to which DPC (500mg/L) has been applied, as well as C) a histogram showing plant (Left) and ear (Right) heights (n=10; means ± s.d., with significant differences (using two-sided Student’s t-test) indicated by shown P values, dots indicate values measured for individual plants).
Unlike Arabidopsis, maize exhibits more specialized labdane-related diterpenoid metabolism, which plays important roles in response to both biotic and abiotic stresses. In particular, maize utilizes An2/ZmCPS2 for production of kauralexins, which play an important role in not only defense against fungal pathogens and rootworm herbivory, but also in drought resistance17. Given the suggestion that ZmCPS2 is resistant, it seemed likely that kauralexin production should be unaffected by DPC, which was verified here (Extended Data Fig. E5).
To further characterize the inhibition of CPS by DPC mechanistic studies with the highly susceptible GhCPS were attempted. Unfortunately, recombinant GhCPS was found to be instable in vitro. Nevertheless, when GhCPS was expressed in E. coli also engineered to make its substrate GGPP18, the production of ent-copalol, derived from dephosphorylation of ent-CPP by endogenous phosphatases, was observed (Supplementary Fig. S6). Whole-cell inhibition studies with these cultures indicated that GhCPS activity was effectively blocked by DPC (Extended Data Fig. E6).
Fortuitously, AtCPS has long since been identified19, shown to be amenable to enzymatic studies in vitro20, and seems to be at least somewhat susceptible to inhibition by DPC (Supplementary Fig. S2). This was further demonstrated by comparison of the ability of DPC to inhibit AtCPS versus ZmCPS1 or ZmCPS2 in vitro (Extended Data Fig. E7), revealing that AtCPS is ~100-fold more susceptible than the maize CPSs (i.e., IC50 of 0.03 versus 2 or 4 mM, respectively). For direct comparison these CPSs also were incorporated into the engineered E. coli system for whole-cell DPC inhibition studies, and DPC found to most effectively inhibit GhCPS in this system as well (Extended Data Fig. E8).
To provide mechanistic insight into DPC inhibition AtCPS was subjected to additional in vitro analysis (Extended Data Fig. E9). While complicated by the known substrate inhibition20, DPC does not appear to be a competitive inhibitor, as it affects both productive and non-productive (inhibitory) substrate binding (KM and Ksi, respectively), along with catalytic rate (Table 1). Hence, DPC does not mimic carbocation intermediates of the catalyzed reaction, nor necessarily bind in the active site at all. Indeed, DPC may be an uncompetitive inhibitor as it seems to decrease KM, although increase Ksi, suggesting it may selectively bind the enzyme-substrate complex and act through an allosteric mechanism. Accordingly, DPC presumably binds elsewhere and indirectly inhibits CPS activity by altering protein structural conformation. Given the differences between the readily inhibited GhCPS and resistant ZmCPSs (~51% amino acid sequence identity), as well as the further confounding intermediate susceptibility of AtCPS, it has not yet been possible to identify the DPC binding site, let alone the structure-function relationships that underlie susceptibility.
Table 1.
Effect of DPC on AtCPS kinetic constants1
| 0 | 10 μM DPC | 100 μM DPC | |
|---|---|---|---|
| kcat (s−1) | 0.3 ± 0.2 | 0.22 ± 0.06 | 0.09 ± 0.02 |
| KM (μM) | 7 ± 5 | 4 ± 2 | 3 ± 1 |
| Ksi (μM) | 5 ± 4 | 12 ± 6 | 60 ± 40 |
| R2 | 0.92 | 0.90 | 0.95 |
Kinetic parameters calculated from fitting the observed data to the substrate inhibition equation (KaleidaGraph 4.0; Synergy). Values indicate the average ± standard error from the curve fit. The experiment was independently repeated twice with similar results.
Although it has been previously suggested that the more general inhibition exerted by non-specific plant growth retardants is an acceptable side-effect2, this also blocks metabolic responses that may be important for adaptation to adverse conditions. Accordingly, in order to most effectively use such agrochemicals to ameliorate the effects of adverse weather patterns, such as those expected to result from climate change (e.g., to pause growth during unexpected periods of drought or flooding), the introduction of susceptibility to selective inhibitors such as DPC (as shown here) seems a fruitful avenue of investigation.
MATERIALS AND METHODS
Plant Materials and Growth Conditions
The Landsberg erecta accession of Arabidopsis thaliana was used unless stated otherwise. The mutants ga1–1 (CS58) and ga1–5 (CS3106) were ordered from the Arabidopsis Biological Resource Center (www.arabidopsis.org).
Seedlings were grown on Murashige and Skoog (MS) medium (Phyto Technology Laboratories) containing 3% (w/v) Suc and 0.8% (w/v) agar (and, for the non-complimented ga1 mutants, treated with GA3 – sprayed with a 10−6 M solution) for 5 to 7 d, then transplanted into pots (7 × 7 × 7 cm) containing soil (PINDSTRUP SPHAGNUM MOSS PEAT). The potted plants were kept at 22 °C with illumination at 120 μmol m−2s−1 for a 16 h light and 8 h dark cycle. The relative humidity was ~ 70% (±5%). Non-complimented ga1 mutant seedlings were treated with GA3 every two days (foliar spray with 10−6 M solution).
Maize B73–329 was used for all the studies described here. Seeds were grown in square plastic pots (20 × 20 × 30 cm in height) containing a mixture of vermiculite and commercial garden soil (1:1; v/v) and grown in a greenhouse cycling between 14 h light at 25 °C and 10 h dark at 18 °C.
Cotton (Gossypium hirsutum L., Xinkang 4) was grown in round pots (13 cm diameter and 13 cm in height) containing a mixture of vermiculite and commercial garden soil (1:1; v/v) in a glass greenhouse cycling between 14 h light at 28 °C and at 10h dark at 20 °C.
Construction of transgenic Arabidopsis, Subcellular Localization and Treatment
The full-length cDNA of GhCPS, ZmCPS1 and AtCPS were individually fused upstream of GFP under the control of the super promoter in the pCAMBIA1300 vector, as previously described21. The forward primer used for GhCPS introduced an XbaI restriction site (5’-CTAGTCTAGAATGTTTTCCCATTCCTTCCT-3’), while the reverse introduced a KpnI restriction site (5’-CGGGGTACCGCGTACTTTCTCAAAG-3’). The forward primer used for ZmCPS1 introduced a SpeI restriction site (5’-CGGACTAGTATGAAGCTCCTCTCGCCGGC-3’), while the reverse introduced a KpnI restriction site (5’-CGGGGTACCTTAAACAGGCTCAAAGATAACTCT-3’). The forward primer used for AtCPS introduced a SpeI restriction site (5’-CGGACTAGTATGTCTCTTCAGTATCATGTTC-3’), while the reverse introduced a KpnI restriction site (5’-CGGGGTACCGACTTTTTGAAACAAGACT −3’).
Each of these vectors was separately transformed into Agrobacterium tumefaciens strain GV3101, and the resulting strain then used to transform Arabidopsis plants (WT, ga1–1 and ga1–5) by the floral dip method22. Transformed seedlings were selected on MS plates containing 30 mg/L hygromycin. The described studies were carried out with seedlings of the T2 generation of hygromycin-resistant and single copy containing plants.
GhCPS Subcellular Localization
To visualize GhCPS-GFP sub-cellular localization, the roots of seven-day-old transgenic Arabidopsis plants were transferred onto glass slides, covered with slips, and observed under a confocal laser microscope (FV1000, Olympus, Japan) with an excitation of 488 nm and an emission of 500–550 nm. The observed punctate pattern of GhCPS-GFP contrasts with the more uniform distribution of GFP and was interpreted as reflecting import into plastids.
Super1300:GhCPS-GFP vector was transformed into A. tumefaciens strain EHA105 and infiltrated into leaves of N. benthamiana. After 3 days incubation at 25 °C, the tobacco leaves were used for fluorescence signal observation. Green and red fluorescence were observed under a confocal laser microscope (FV1000, Olympus, Japan). GFP was excited with a 488 nm laser. The emission spectra were collected at 500–550 nm for GFP. To detect auto-fluorescence of chlorophyll, samples were examined with a long-pass 630 nm filter set, as previously described23. The overlapping red and green fluorescence demonstrates localization of GhCPS-GFP into chloroplasts.
DPC treatment
Cotton was treated with DPC (foliar spray with solutions of 0, 30, 50, 100, 300, 500, 1000 mg/L) at the two-leaf stage. Plant height was measured 15 days after this treatment. Each treatment set contained 15 replicates.
For Arabidopsis, seeds were germinated on MS plates for 10 days and then transferred to pots with soil. DPC (CAS 24307–26-4, Sigma-Aldrich, USA) treatment (foliar spray with solutions of 0, 30, 50, 100, 300, 500, 1000 mg/L) was started upon bolting, with selection of plants containing equal numbers of leaves. To demonstrate that GA can reverse DPC growth inhibition, WT plants were treated with 500 mg/L DPC and then GA3 (foliar spray with 10−6 M solution every two days). Plant height was then measured 15 days after this treatment. Each treatment set consisted of at least 7 replicates.
For analysis of effect on maize growth and development, plants were treated with DPC (foliar spray) at the 9-leaf growth stage (specifically when the 9th internode was 1 cm in length). Five concentrations of DPC were used for the sensitivity assay (0, 50, 100, 500, 1000 mg/L), with 500 mg/L DPC used for comparison among transgenic maize, zmcps1 mutant and WT (B73–329). Plant and ear heights were measured at the silking stage, ~22–25 days after treatment. Following maturation, each ear was harvested separately and naturally air-dried under room condition. Then the grains were threshed from each ear by hand. The number of grains per ear were counted and the total grain weight per ear also measured. The 100-grain weight was calculated by the rate of total grain weight to number of grains per ear. Each treatment set consisted of 10 replicates.
For analysis of effect on maize kauralexin production, seeds were sterilized, germinated and seedlings grown hydroponically, as previously described24. When the third leaf was fully expanded, the seedlings were individually transferred into a glass bottle (height 15 cm × 5 cm diameter) containing 150 mL full strength Hoagland’s nutrient solution, and treated with water or 1000 mg/L DPC (foliar spray). A week later, leaves, roots and roots exudates were harvested separately. The leaves and roots were separately ground to fine powder in liquid N2 and extracted twice with hexanes. This organic extract was concentrated by rotary evaporation and methylated with CH2N2 for GC-MS analysis. For root exudate analysis, the spent media was loaded onto 0.1 g Bond Elut C18 spin-cartridges (Thermo, USA), which were then eluted with 10 ml of 100% ethyl acetate. This eluate was dried under N2 and the residue dissolved in hexanes, methylated as above, then analyzed by GC-MS. Kauralexin content was quantified by peak size (extracted ion abundance) based on a standard curve generated with an authentic standard for kauralexin B1. Each treatment set consisted of 5 replicates.
One-way analyses of variance (ANOVA) procedure was conducted with SAS (V8, SAS Institute Inc., Cary, NC, USA). Multiple comparisons among different lines and treatments were corrected based on Fisher’s protected least significant difference (LSD). Student’s unpaired t-tests were used for pairwise comparisons. P values < 0.05 and/or 0.01 were considered significant.
Construction of transgenic maize
The CRISPR-Cas9 (clustered regularly interspaced short palindromic repeat-CRISPR-associated protein 9) knockout lines were created by the Research Center for Functional Genomics and Crop Breeding of China Agricultural University according to previous methods25,26. Briefly, a pCAMBIA-derived CRISPR/Cas9 binary vector with two gRNAs: GAAATTGCGAAATGGCCAG (target1) and AGCTGAAGCGGATCCCAAG (target2) expression cassettes targeting two adjacent sites of ZmCPS1 was generated and then transformed into A. tumefaciens strain EHA105. The resulting recombinant strain was then transformed into maize by infection of immature embryos from the B73–329 inbred line. In order to identify CRISPR-Cas9 induced mutations, the gRNA-targeted sites were sequenced with the following primers: 5’-ATCAACCGTACTGCTGCAAACAG-3’ and 5’-CGCTAGCCTCCACATGTTCT-3’ for target 1, and 5’-AAGACCTTGAGGATGAGCACCAG-3’ and 5’-AAGTAGCGGGAGATCCCGAGT-3’ for target 2. Given the difficulties with homozygous knock-out mutants of zmcps1/an1, diallelic (single base insertion and three-base deletion) plants were used for propagation. The A. tumefaciens strain EHA105 containing the Super1300-GhCPS vector was used to infect immature embryos from the seeds of such a diallelic zmcps1/an1 plant (T1 generation). Resulting transgenic (diallelic) zmcps1/an1 + GhCPS plants were selected by sequencing and PCR (of GhCPS), with the next generation of plants used in the experiments described here (with sequencing of the zmcps1 loci to identify genotype). GhCPS expression levels were analyzed by real-time quantitative PCR, carried out as previously described24, using actin as a control with the following primers: ZmActin-F: GTTCCCTGGGATTGCCGAT; ZmActin-R: CTGCTGAAAAGTGCTGAG; GhCPS-qRT-F: TCCTCCCTTACCCTTTGCAG; GhCPS-qRT-R: GCATATTCTTGAGTGCGGGG. Control plants were from the corresponding (T3) generation and also sequenced to identify their zmcps1 genotype.
Characterization of GhCPS
For recombinant expression GhCPS was truncated (removing the first 94 amino acids) to create a pseudo-mature construct, which was sub-cloned into the Gateway vector system via PCR amplification and directional topoisomerase-mediated insertion into pENTR/SD/D-TOPO and verified by complete sequencing. An analogous truncated pseudo-mature AtCPS in pENTR has been previously described20, as have the similar ZmCPS1 and ZmCPS2 constructs15. Each of these CPSs were individually transferred via directional recombination to the previously described T7 promoter-based expression vector pGG-DEST18. A codon-optimized GhCPS gene was also synthesized and incorporated into the Bac-to-Bac Baculovirus expression system (Thermo-Fisher) as previously described27, but no activity was observed with the resulting recombinant protein upon purification, or even with cell-free extracts.
For whole-cell inhibition studies a previously described modular metabolic engineering system was used18. All metabolic engineering was carried out using the E. coli OverExpress C41 strain(Lucigen), and included pIRS to increase flux to isoprenoid metabolism as previously described28, with pDEST17-AtKS included in the experiment verifying the stereochemical product outcome of GhCPS. Recombinant cultures were grown in 50 mL TB medium (pH 7.0), with the appropriate antibiotics, in 250 mL Erlenmeyer flasks. These cultures were firstly grown at 37 °C to mid-log phase (OD600 = 0.6~0.8), then the temperature dropped to 16 °C for 0.5 – 1 h prior to induction with 1 mM isopropylthiogalactoside (IPTG) and supplementation with 40 mM pyruvate and 1 mM MgCl2. To examine the effect of DPC this was added to final concentrations of 0, 30, 50, 100, 300, 500 or 1000 mg/L, with 3 replicates for each. The induced cultures were grown for an additional 3 days before extraction with an equal volume of hexanes. The extracts were dried under N2 and then resuspended in 1 mL fresh hexanes for analysis.
For characterization and quantification of the products, gas chromatography with mass spectra detection (GC-MS) was carried out with a 3900 GC with Saturn 2100T ion trap MS (Varian) equipped with HP-5 MS column (Agilent). Samples (1 μL) were injected in splitless mode by an 8400 autosampler with the injection port at 250 °C, the column oven temperature initially started at 50 °C, which was maintained for 3 min, and then increased at a rate of 15 °C/min to 300 °C, where it was held for another 3 min. Mass spectra were recorded by mass-to-charge ratio (m/z) values in a range from 90 to 650, starting from 13 min after sample injection until the end of the run. The production of ent-copalol, derived from dephosphorylation of ent-CPP by endogenous phosphatases, and (where relevant) ent-kaurene, was verified by comparison of retention time and mass spectra to that of authentic standards.
Inhibition of AtCPS and ZmCPSs
Expression vectors (pDEST-17 based) for truncated pseudo-mature AtCPS, as well as ZmCPS1 and ZmCPS2, also have been previously described15,20. These were transformed into the C41 OverExpress strain of E. coli (Lucigen) for production and isolation of each CPS much as previously described29. Briefly, the recombinant E. coli were grown in liquid NZY media to OD600 = 0.8 at 37 °C, shifted to 16 °C for prior 0.5–1 h to induction with 1 mM IPTG, then grown overnight. The cells were harvested and lysed using a homogenizer. The proteins were purified with 2 mL nickel-nitrilotriacetic acid superflow resin column using a BioLogic LP chromatography system (BioRad). All steps of the purification were carried out at 4 °C and resulting purity of the CPSs examined by SDS-PAGE analysis (each ~90% pure). The proteins were then dialyzed in 50 mM MOPSO (pH 6.8) and 2 mM DTT overnight at 4 °C, then aliquots were flash frozen in liquid N2 and stored at −80 °C.
All enzymes assays were carried out at 30 °C in 1 mL of assay buffer (50 mM HEPES (pH 7.75), 100 mM KCl, 10% glycerol (v/v) and 0.01 mM MgCl2) with appropriate CPS, as well as GGPP and DPC. For time course assays, each assay was incubated with 5 μM GGPP and different concentrations of CPS (0.01, 0.02, 0.05, 0.1 μM) for 15, 30, 60 or 120 sec. For kinetics assays, each assay was incubated with different concentrations of GGPP (0.5, 1, 2, 3, 5, 7.5, 10, 12.5, 15, 20 or 30 μM) and appropriate CPS and time. For IC50 assays, each assay was incubated with CPS and GGPP for the appropriate time and with various concentrations of DPC (0, 10−11, 10−10, 10−9, 10−8, 10−7, 10−6, 10−5, 10−4, 10−3, 10−2, 10−1 or 100 M). Reactions were terminated by adding 100 μL of 20 mM NEM in 500 mM glycine (pH 11), then incubating for 5 min at 75 °C. Excess NEM was deactivated by adding 20 μL 1 M DTT and incubating for 15 min at room temperature, followed by neutralization with 60 μL 1M HCl. Dephosphorylation to enable analysis by GC was carried out by the addition of 133 μL of 10 × CIAP buffer (Promega) and 15 U calf intestinal alkaline phosphatase, with incubation at 37 °C overnight. The resulting alcohols (geranylgeraniol and ent-copalol) were extracted with 1 mL hexanes thrice, with the extracts from each assay pooled, dried under N2 and resuspended in 50 μL hexanes for GC analysis. After initial product verification by GC-MS, catalytic turnover was quantified by GC-FID (flame ionization detection). Kinetic parameters were calculated from fitting the observed data to the substrate inhibition equation (Kaleida Graph 4.0, Synergy Software; Reading, PA).
Extended Data
Extended Data Figure E1.
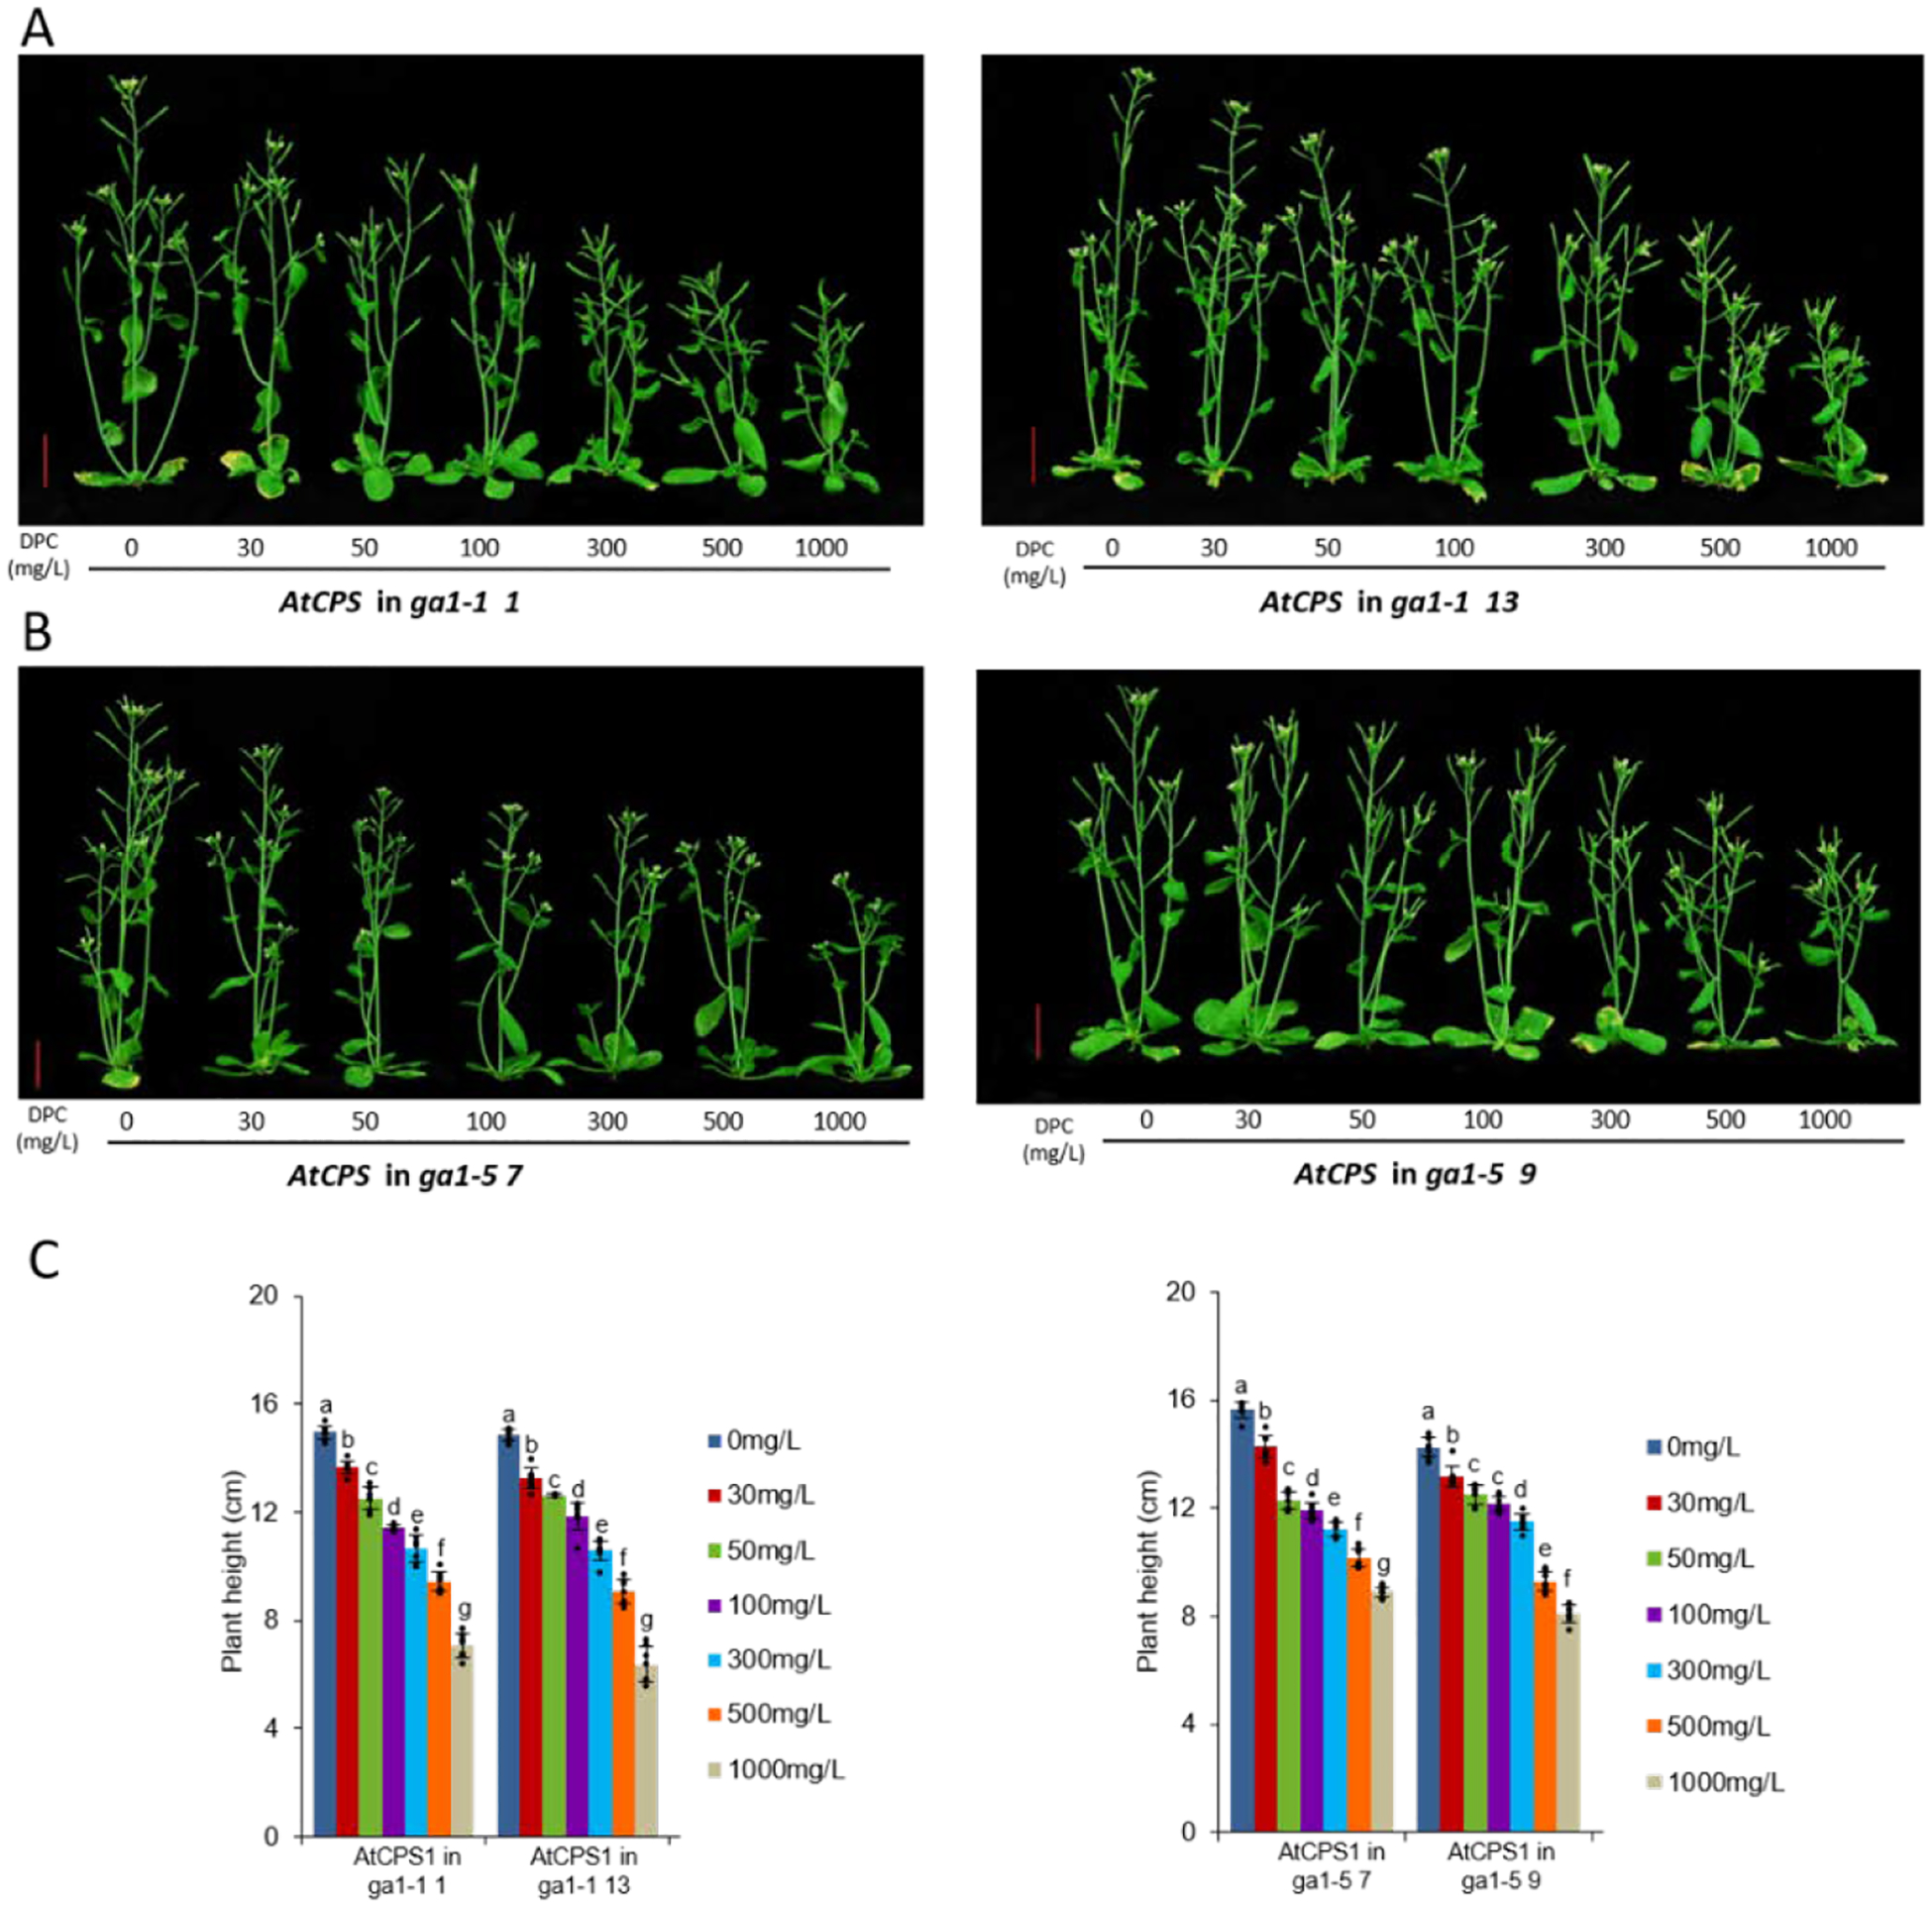
DPC can retard growth of ga1 mutants of Arabidopsis recombinantly expressing AtCPS. A) ga1–1 + AtCPS and B) ga1–5 + AtCPS plants treated with the indicated concentrations of DPC (vertical red bars = 2 cm). C) Histogram of plant heights (n=7; means ± s.d., while letters (a – f) indicate significant differences – i.e. P < 0.05 for two-sided Fisher’s LSD – dots indicate values measured for individual plants).
Extended Data Figure E2.
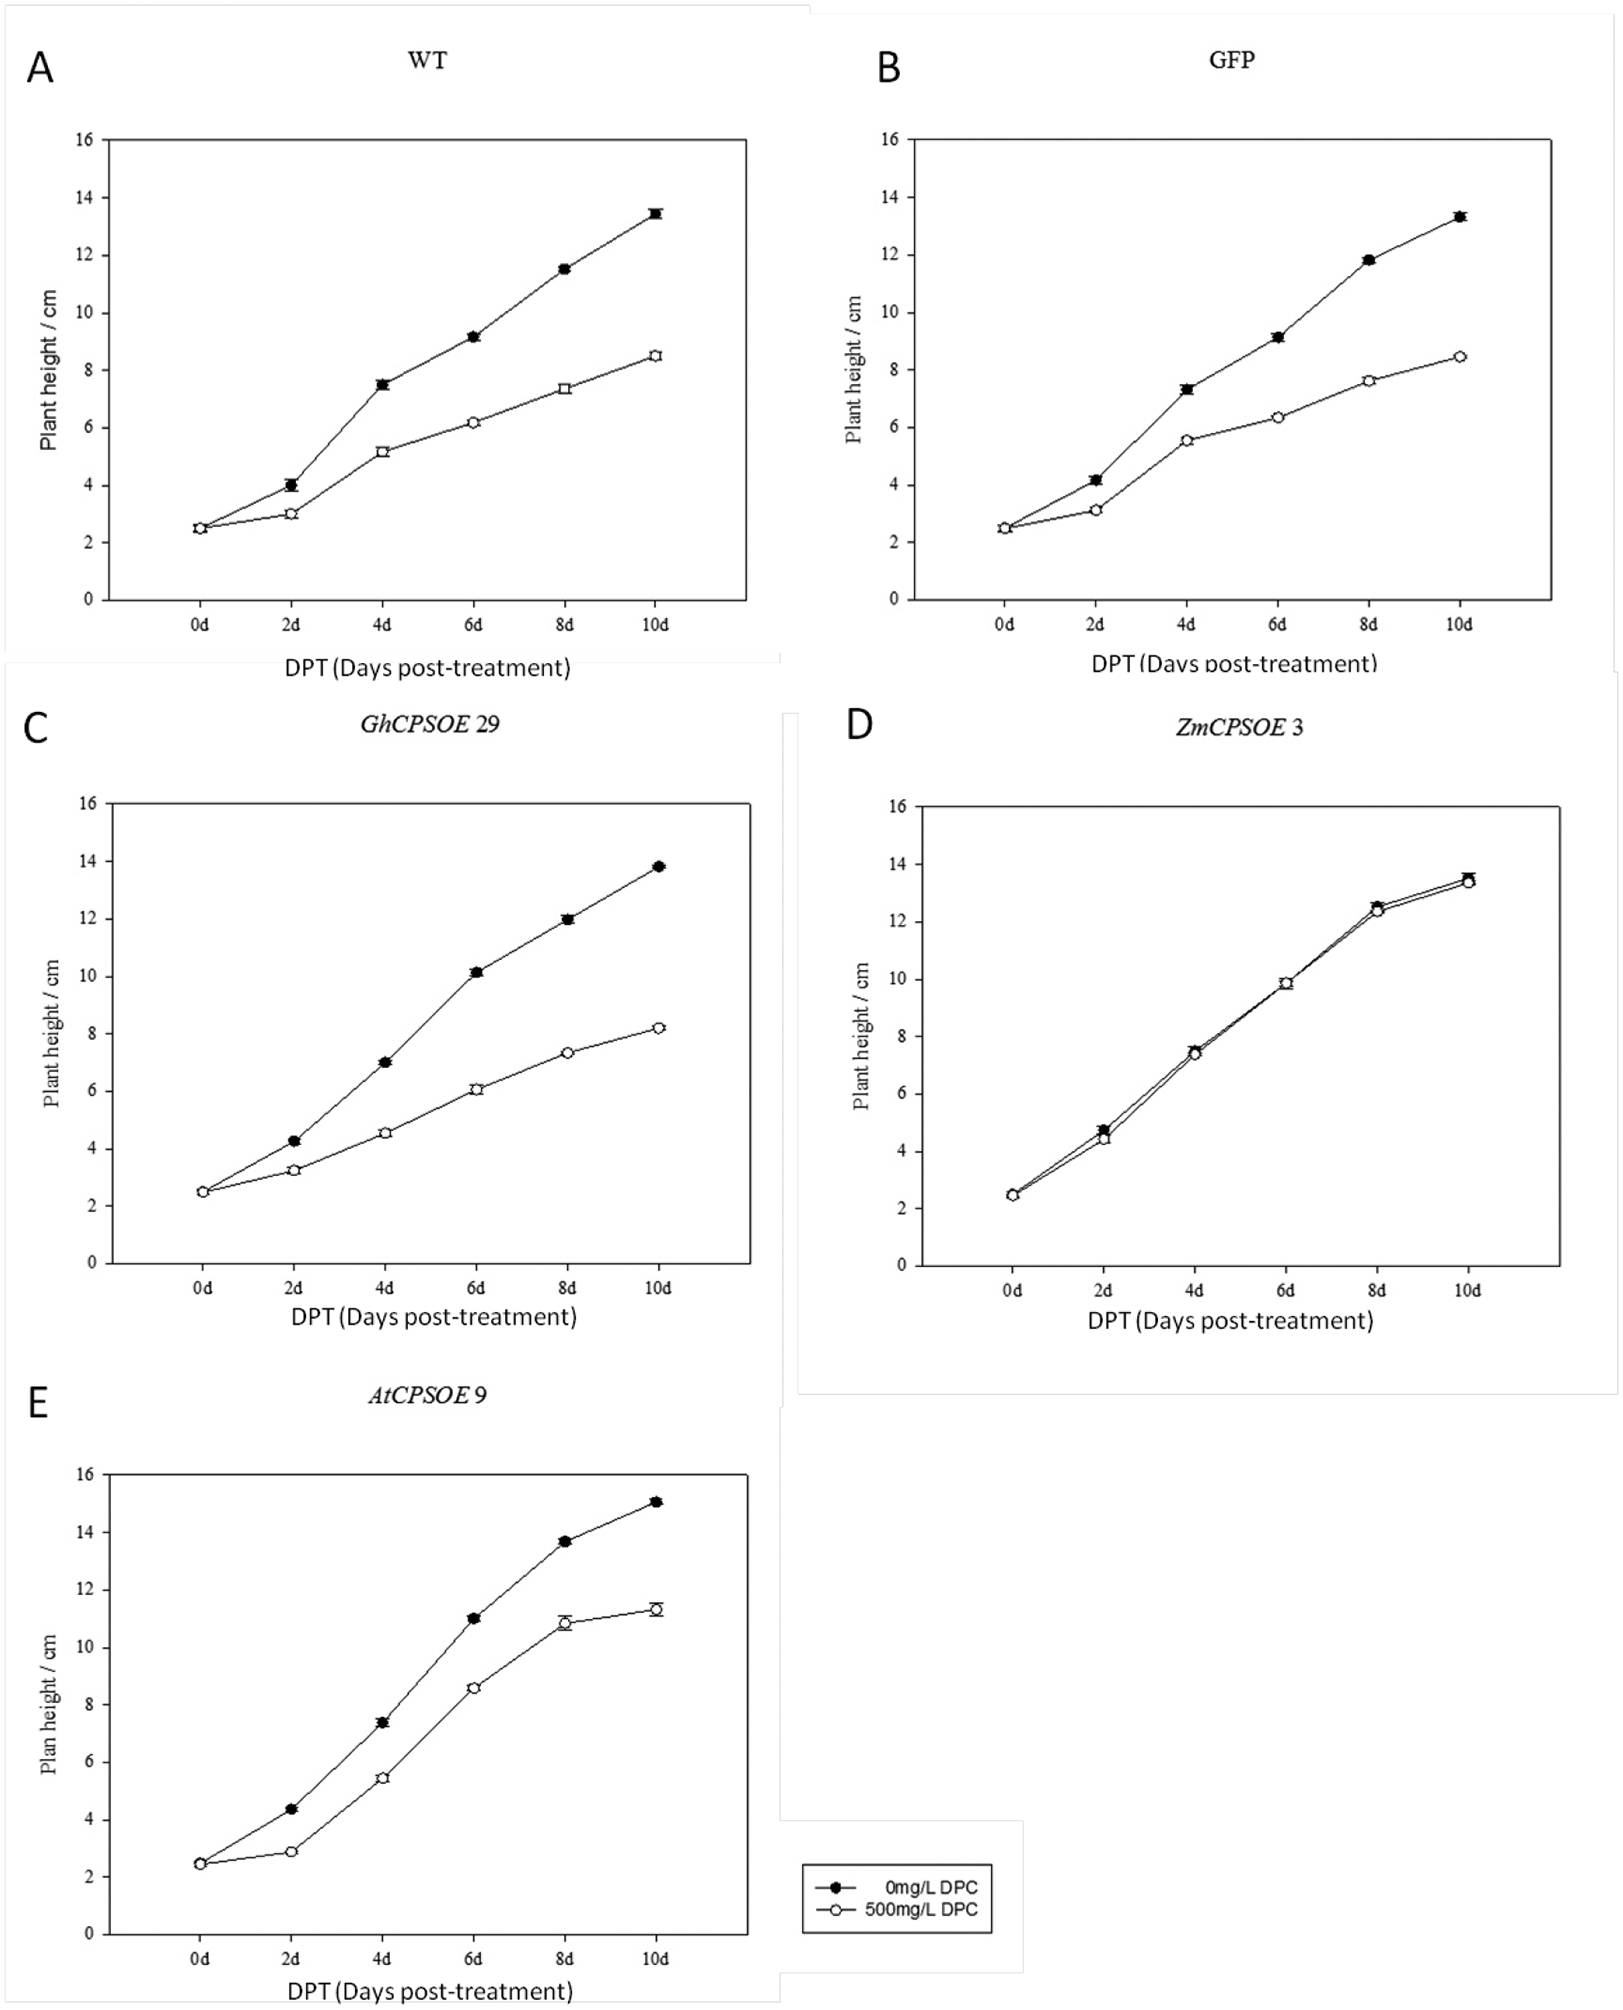
DPC can retard growth of WT Arabidopsis recombinantly expressing AtCPS or GhCPS, but not ZmCPS1. Growth curves are from A) WT; B) Super 1300-GFP +WT; C) Super 1300-GFP-GhCPS +WT; D) Super 1300-GFP-ZmCPS1+WT; E) Super 1300-GFP-AtCPS +WT plants to which DPC (500 mg/L) has been applied (n=7; means ± s.d.). Plant height was measured every two days after DPC treatment.
Extended Data Figure E3.
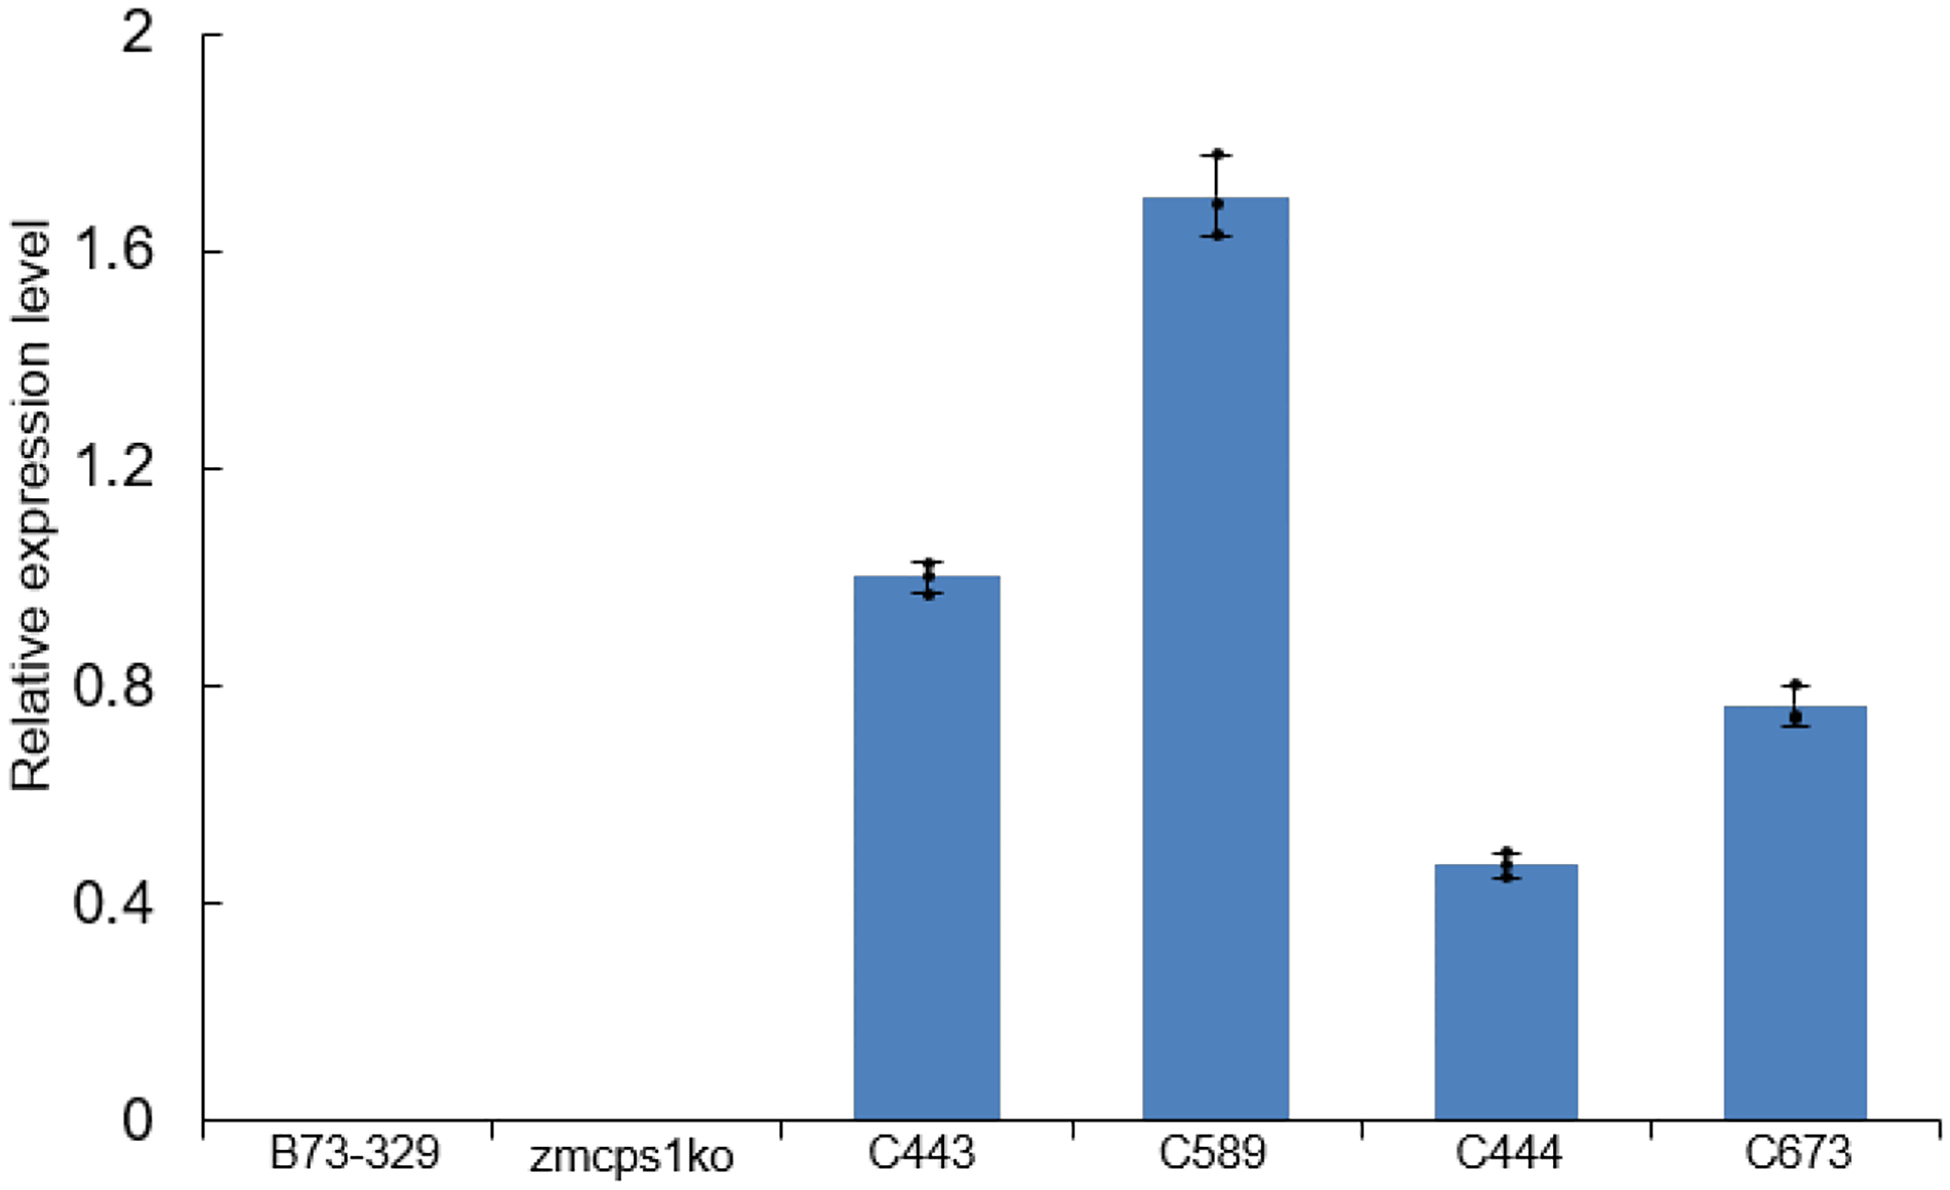
Relative expression level of GhCPS in transgenic maize lines used here (n=3; means ± s.d., dots indicate values measured for technical replicates).
Extended Data Figure E4.
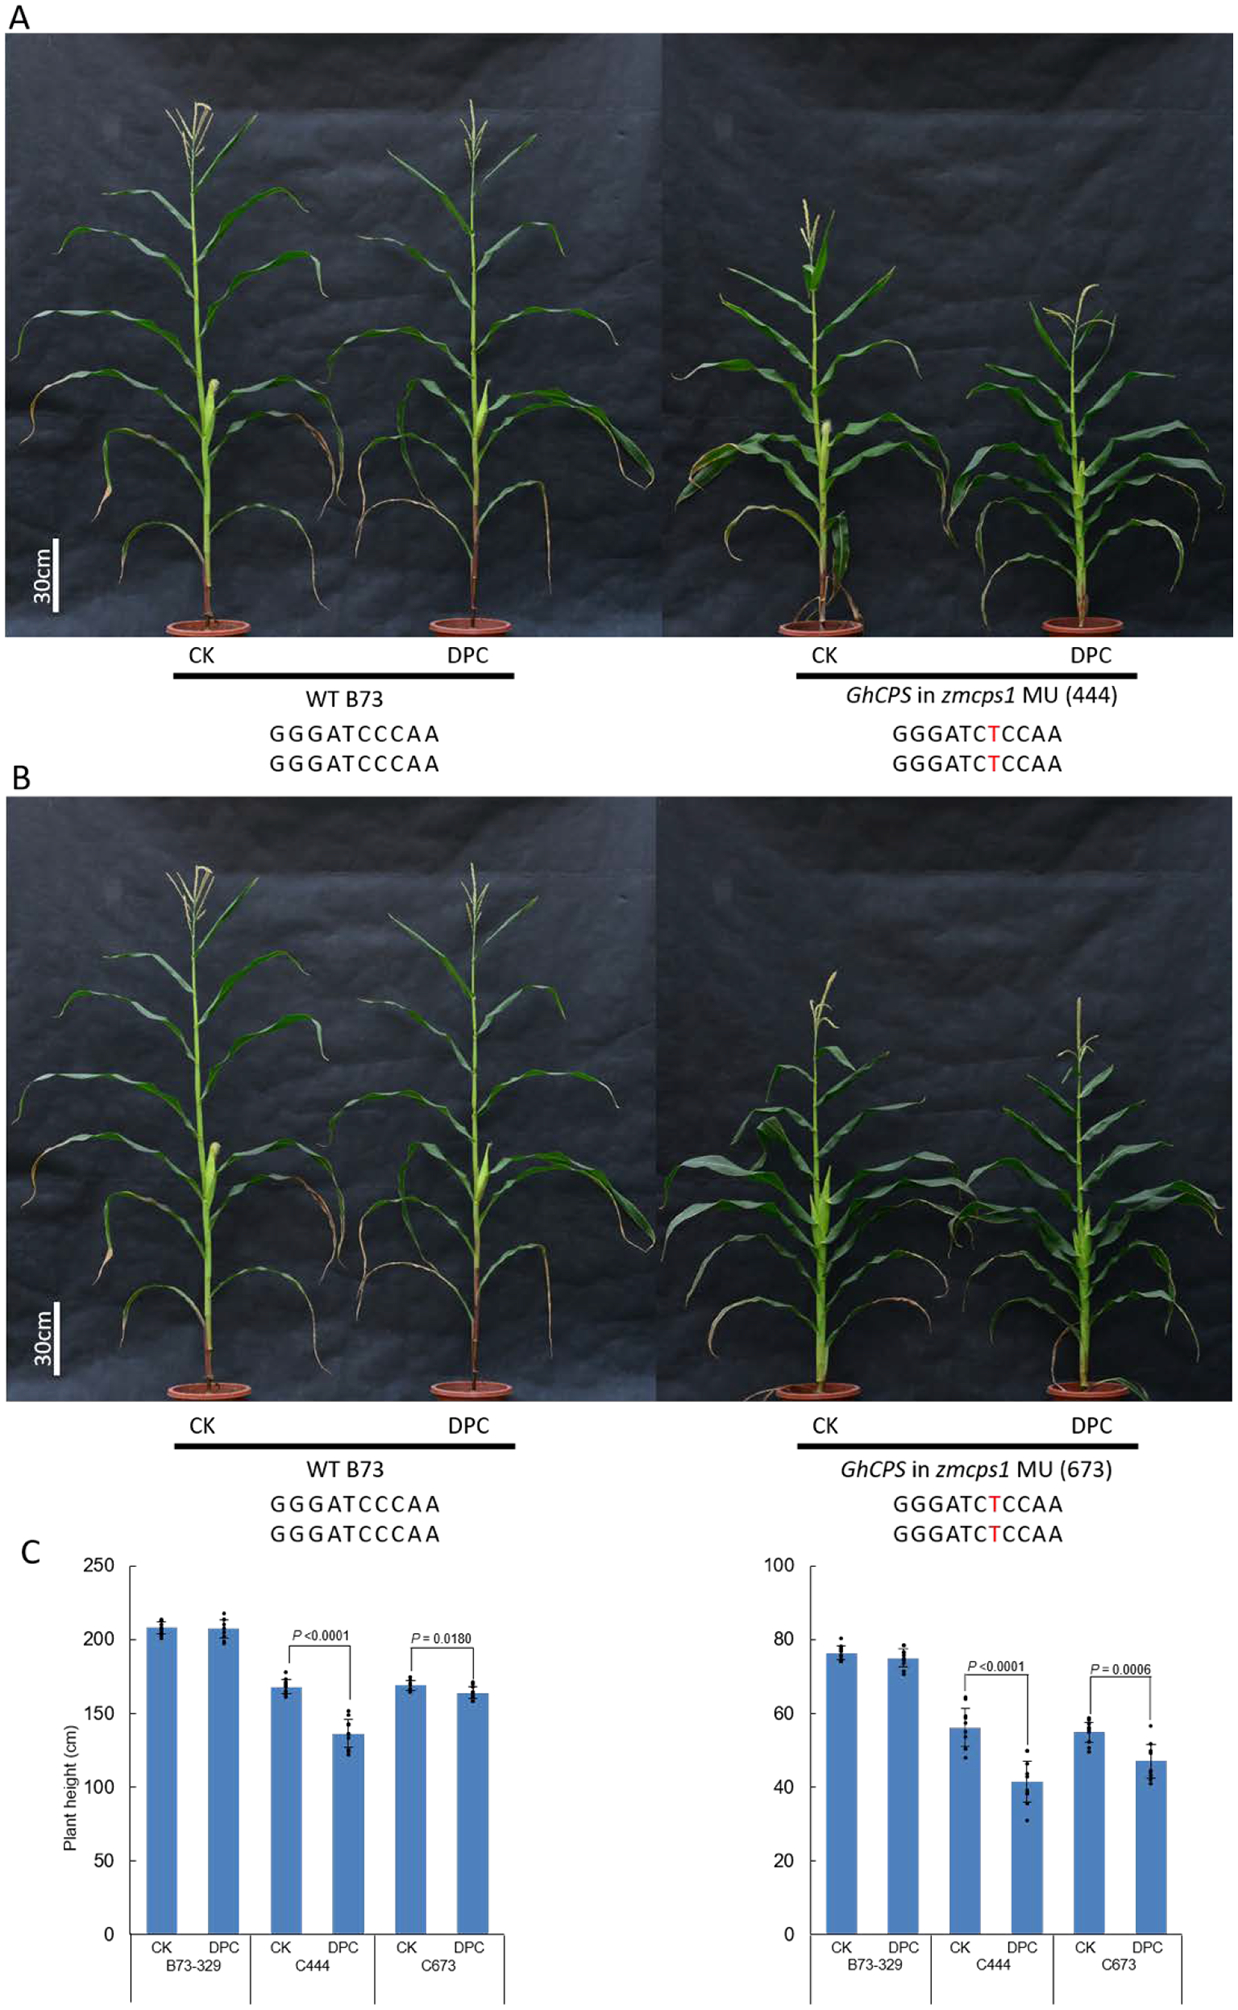
Effect of DPC on homozygous zmcps1/an1 transgenic maize, also expressing GhCPS. Pictured are A) GhCPS in zmcps1 MU (444); B) GhCPS in zmcps1 MU (673) plants to which DPC (500 mg/L) has been applied, as well as C) a histogram showing plant (Left) and ear (Right) height (n=10; means ± s.d., with significant differences (using two-sided Student’s t-test) indicated by shown P values, dots indicate values measured for individual plants).
Extended Data Figure E5.
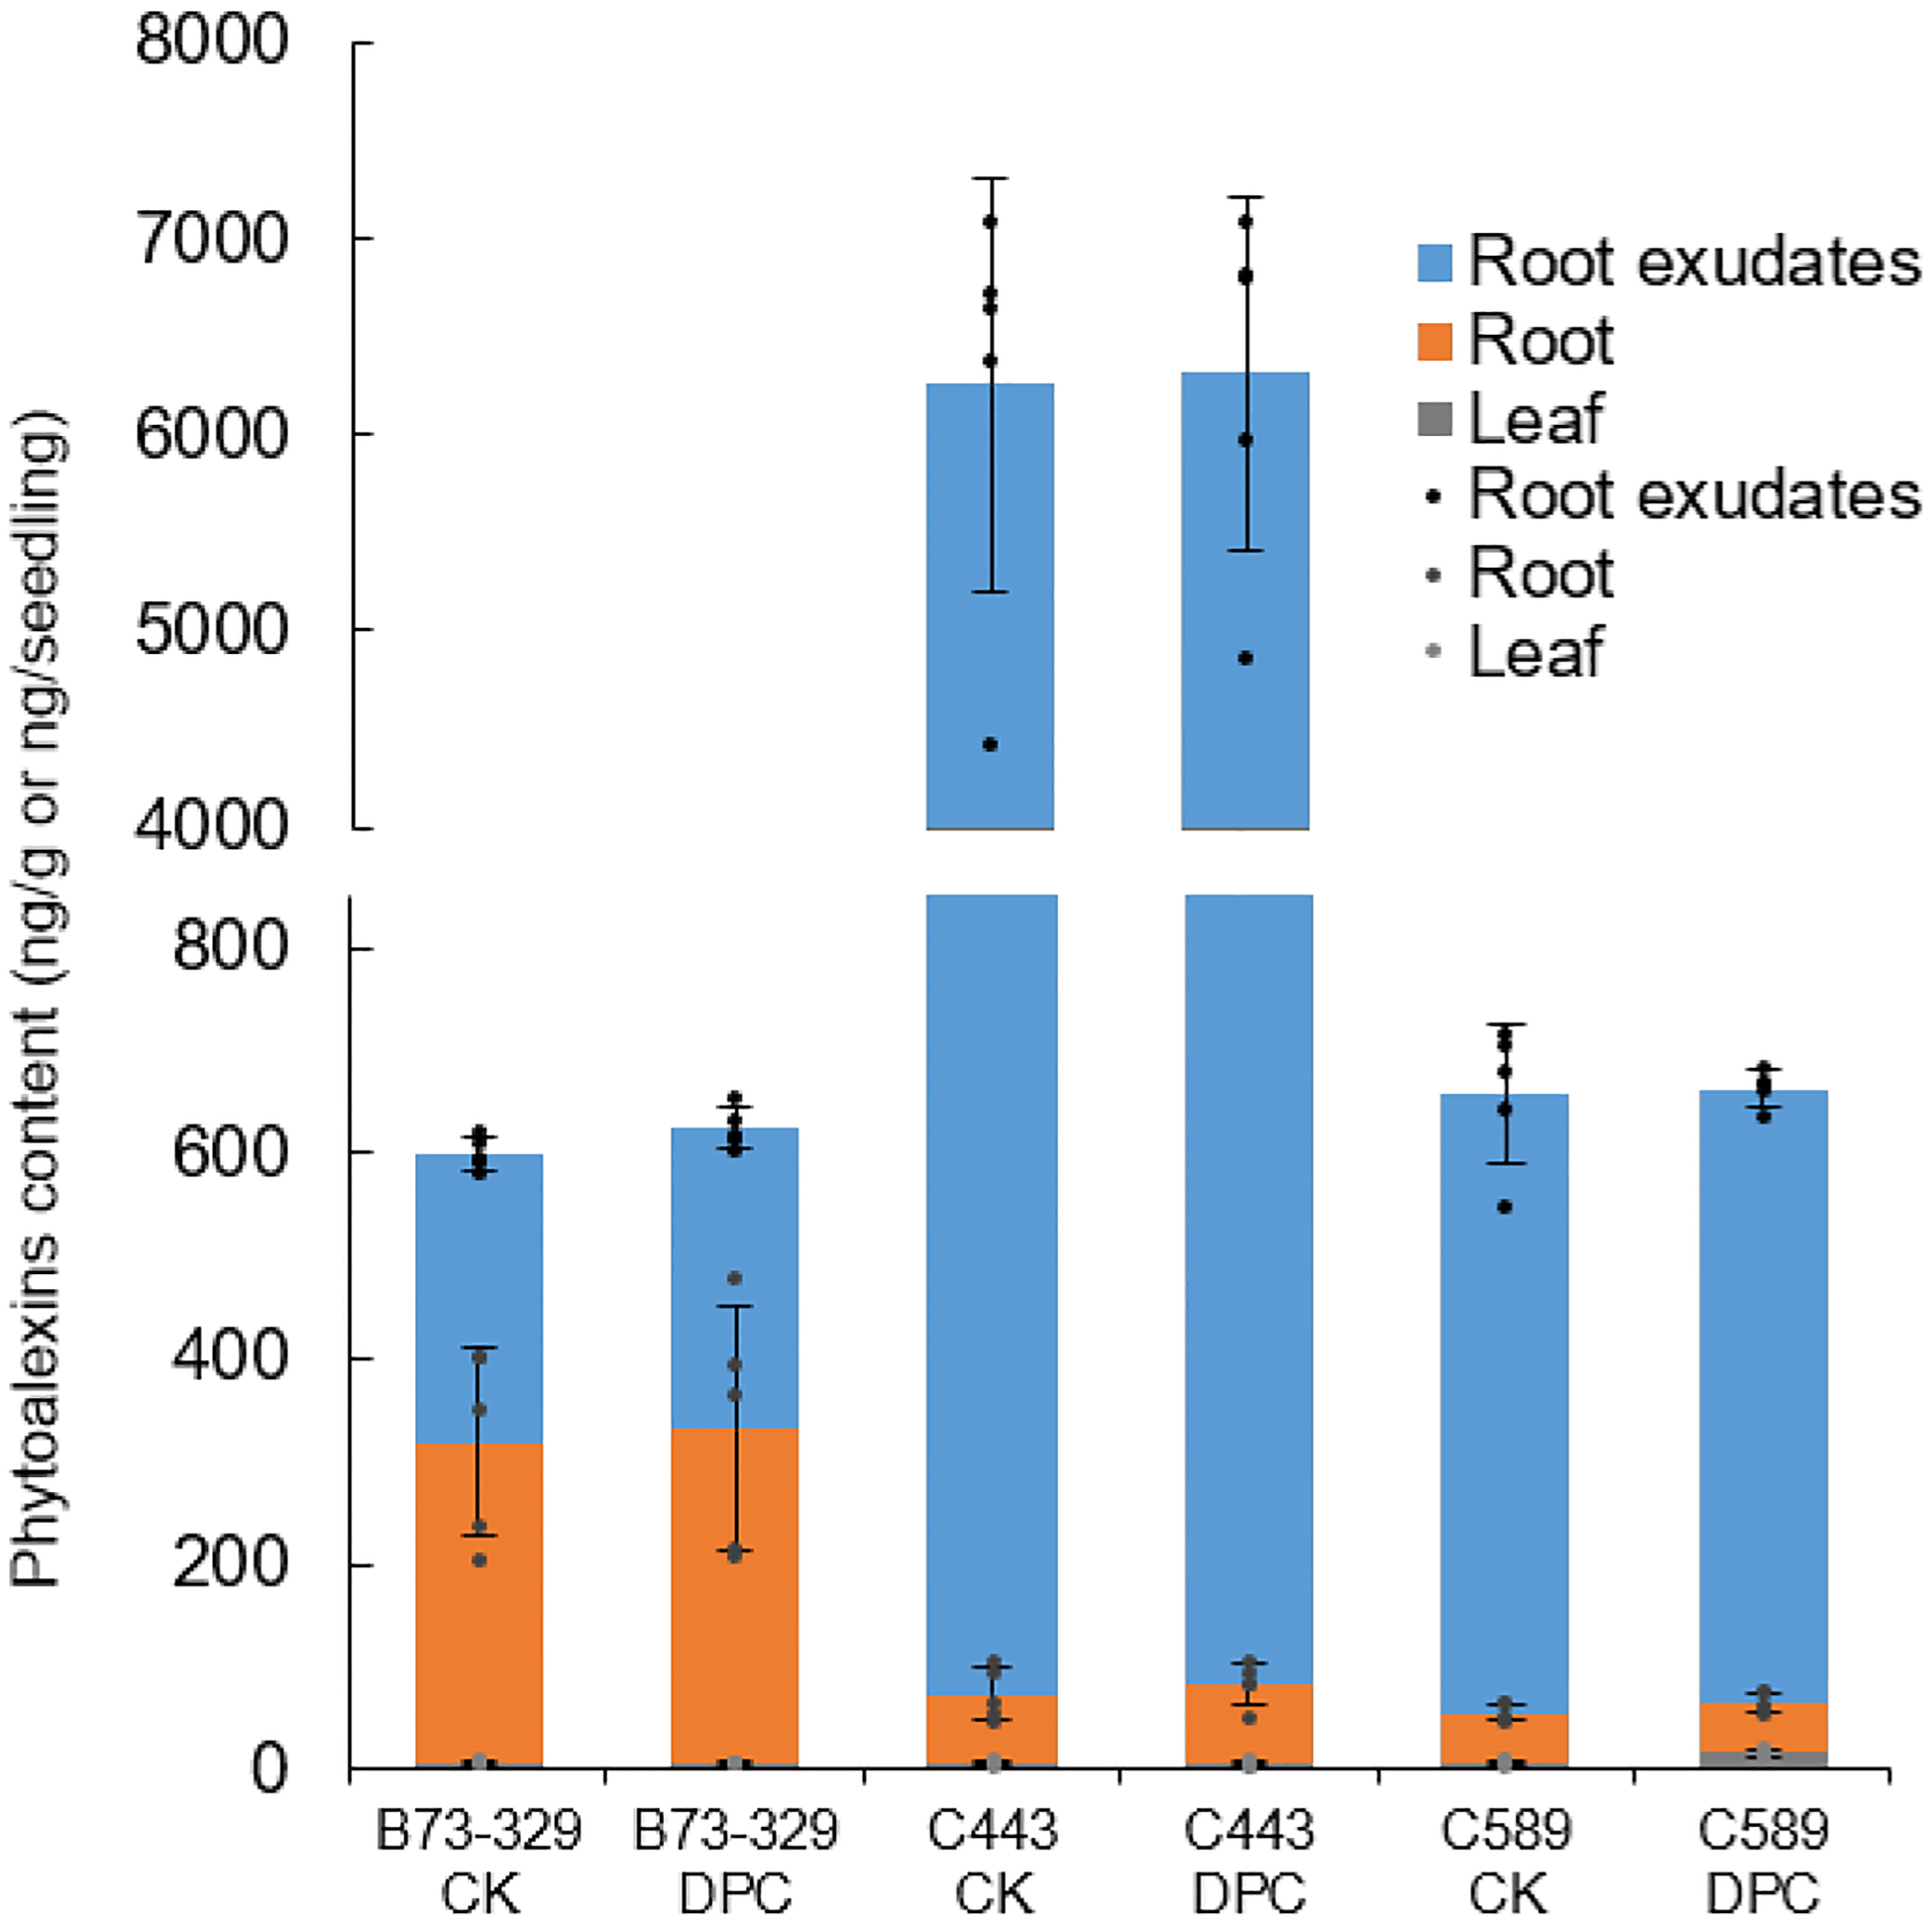
DPC does not affect kauralexin (phytoalexin) production in maize (n=5; means ± s.d., dots indicate values measured for individual plants).
Extended Data Figure E6.
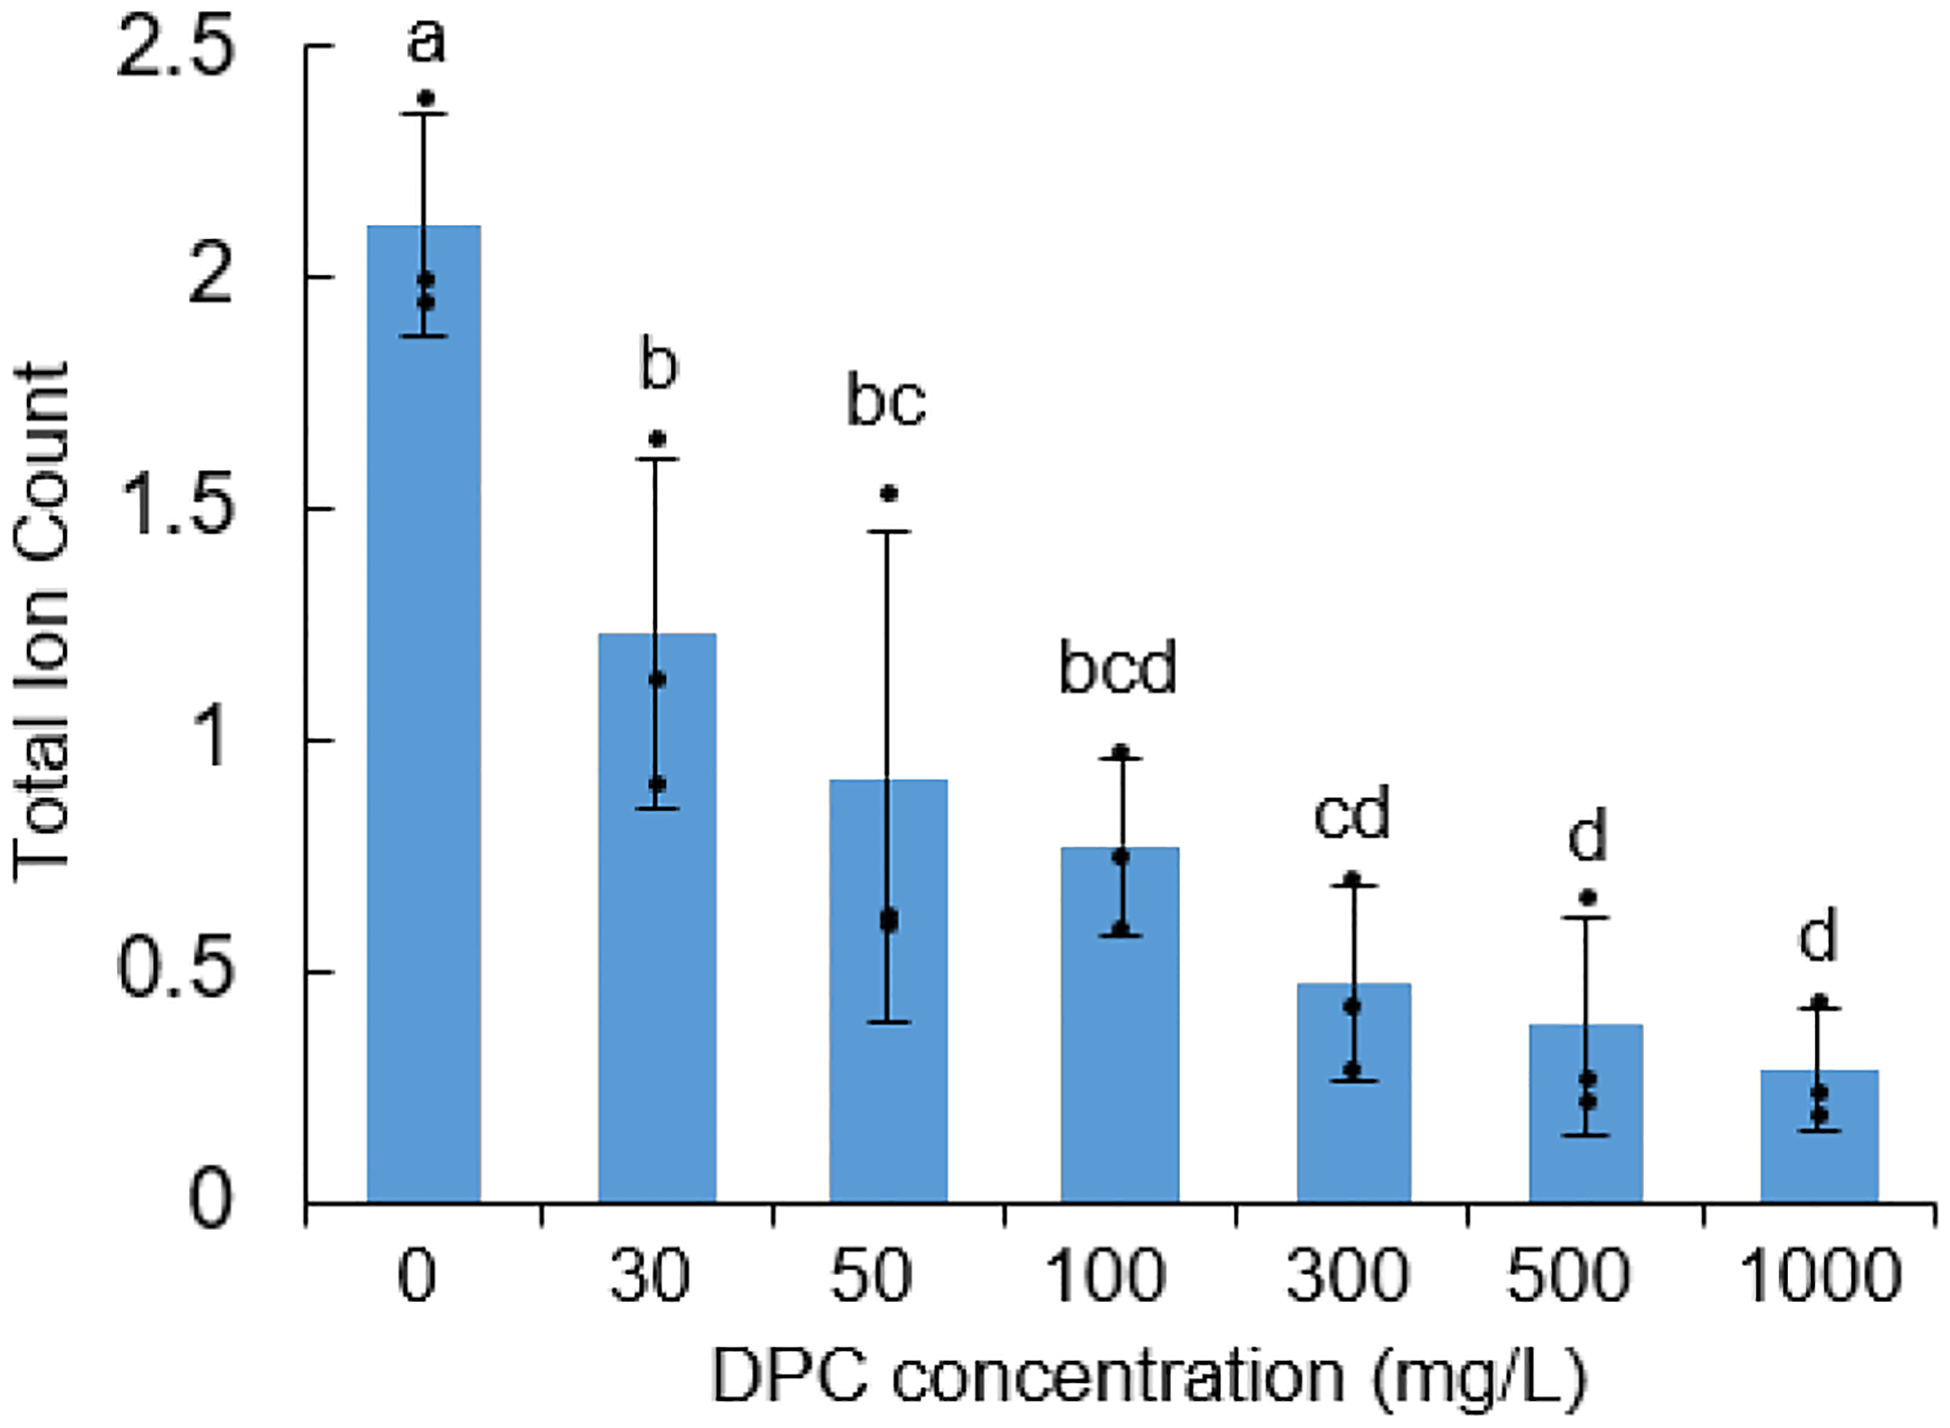
DPC can inhibit production of ent-CPP by GhCPS in E. coli also engineered to produce GGPP (n=3; means ± s.d., with significant differences – i.e. P < 0.05 for two-sided Fisher’s LSD – dots indicate values measured for individual cultures).
Extended Data Figure E7.
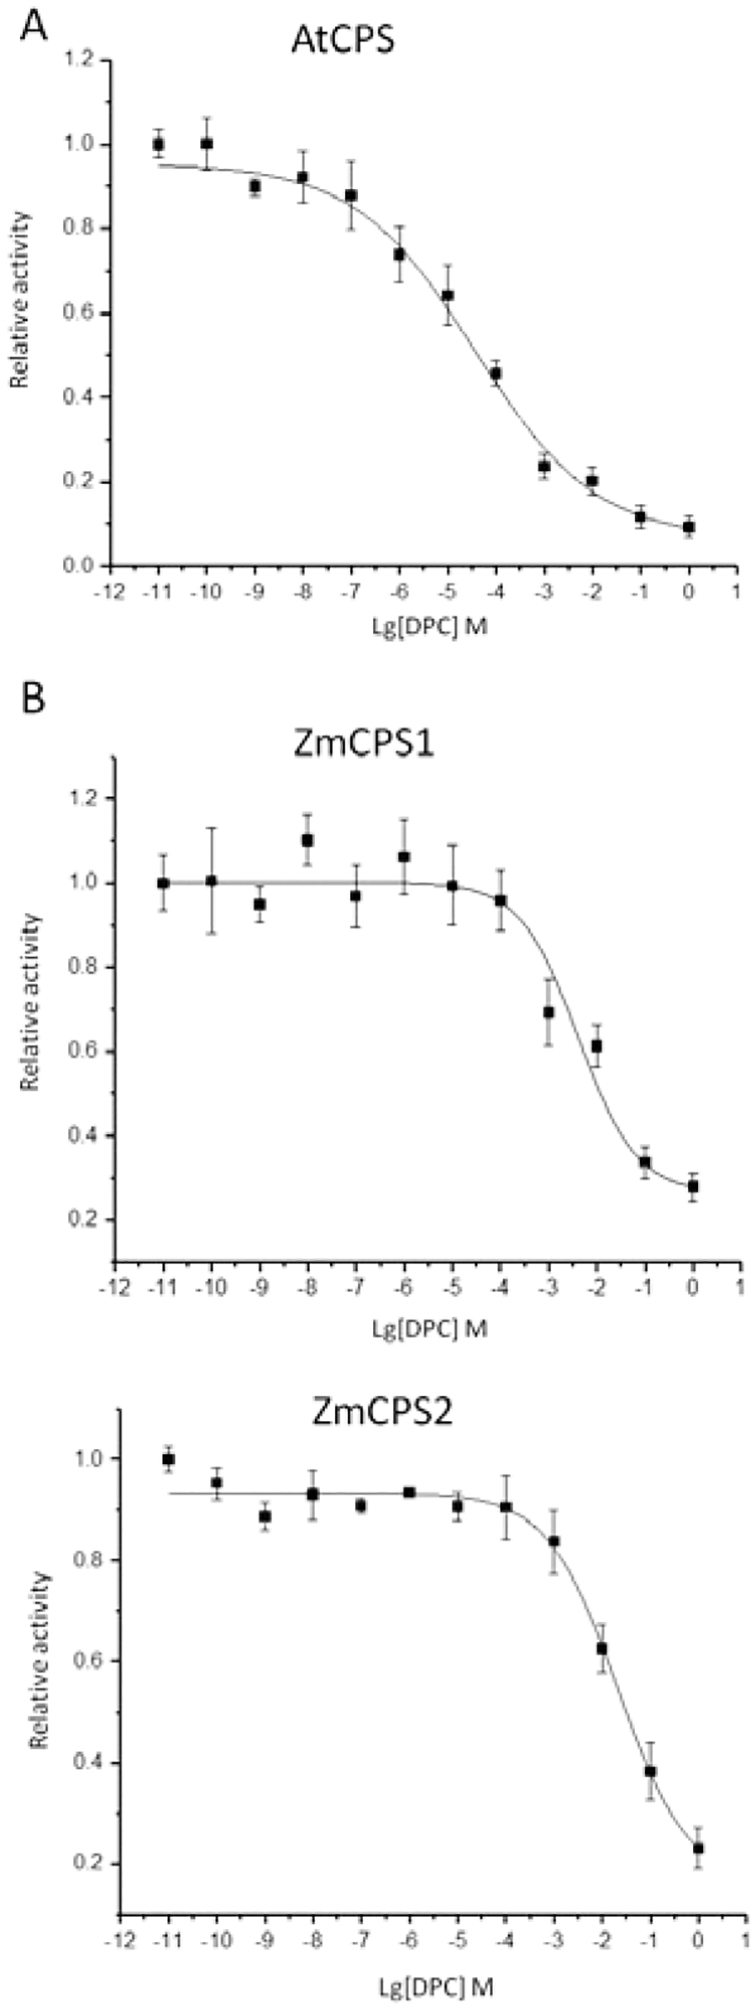
DPC is a selective CPS inhibitor. Effect of increasing DPC concentration on the activity of A) AtCPS; B) ZmCPS1; or C) ZmCPS2. Average from three independent measurements, error bars represent standard deviation. Lines indicate fit to y = A1 + (A2-A1)/(1 + 10^((LOGx0-x)*p)).
Extended Data Figure E8.
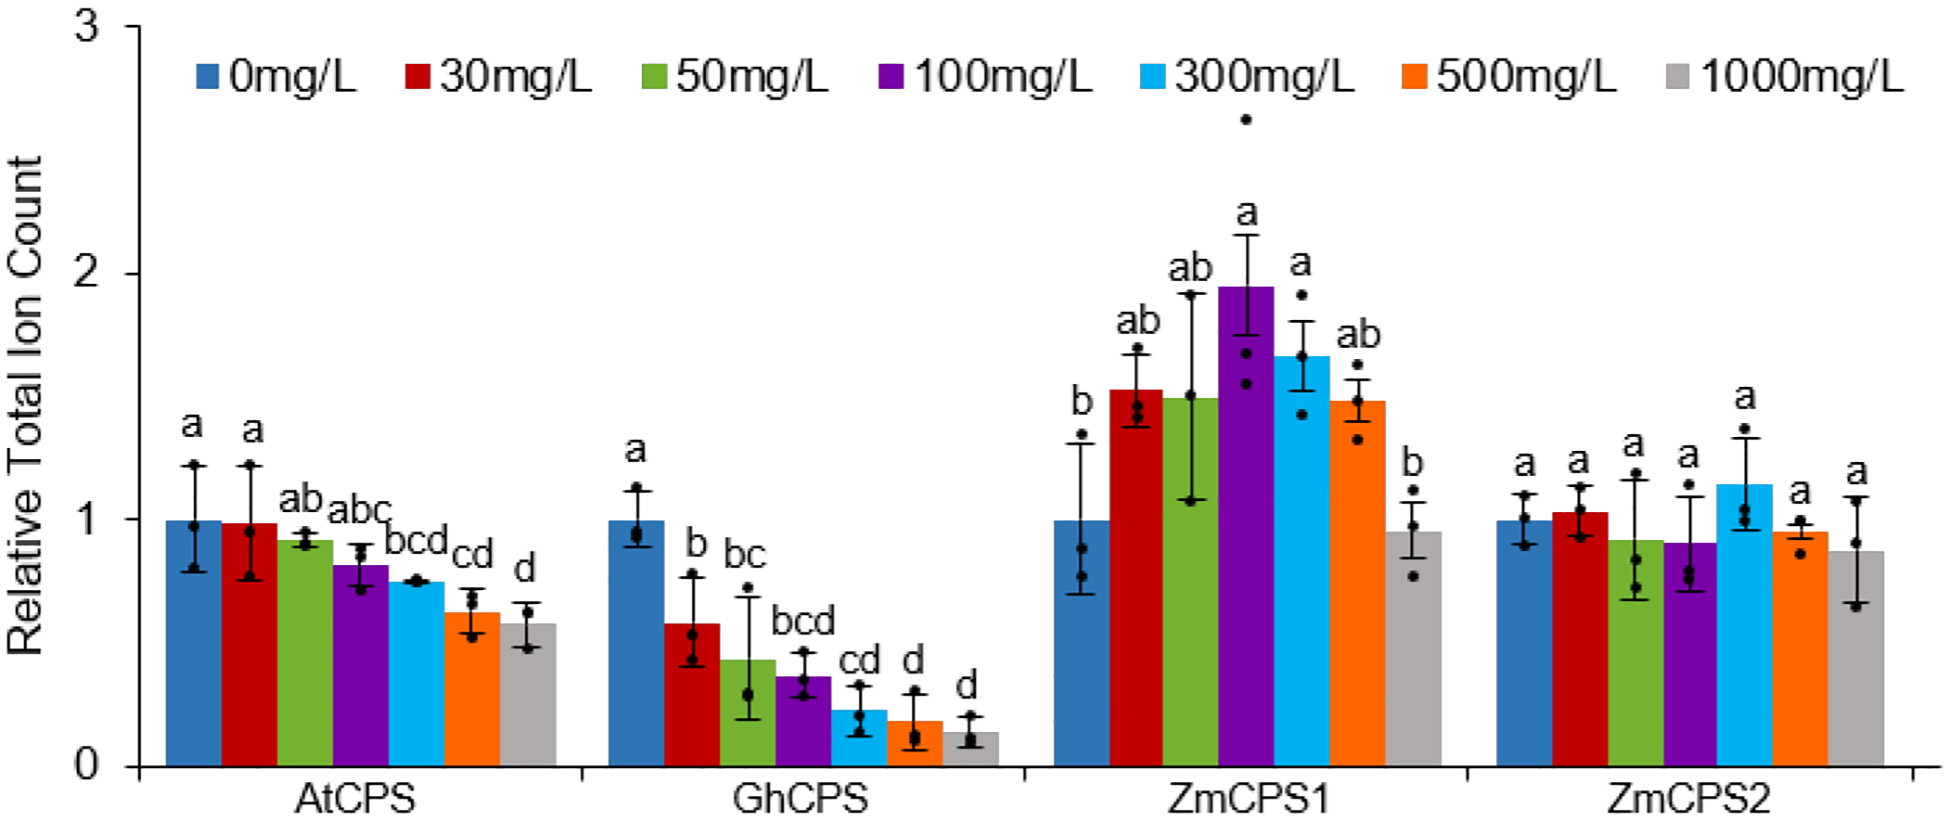
DPC has a highly variable effect on production of ent-CPP by distinct CPSs in E. coli also engineered to produce GGPP (n=3; means ± s.d., with significant differences – i.e. P < 0.05 for two-sided Fisher’s LSD – dots indicate values measured for individual cultures).
Extended Data Figure E9.
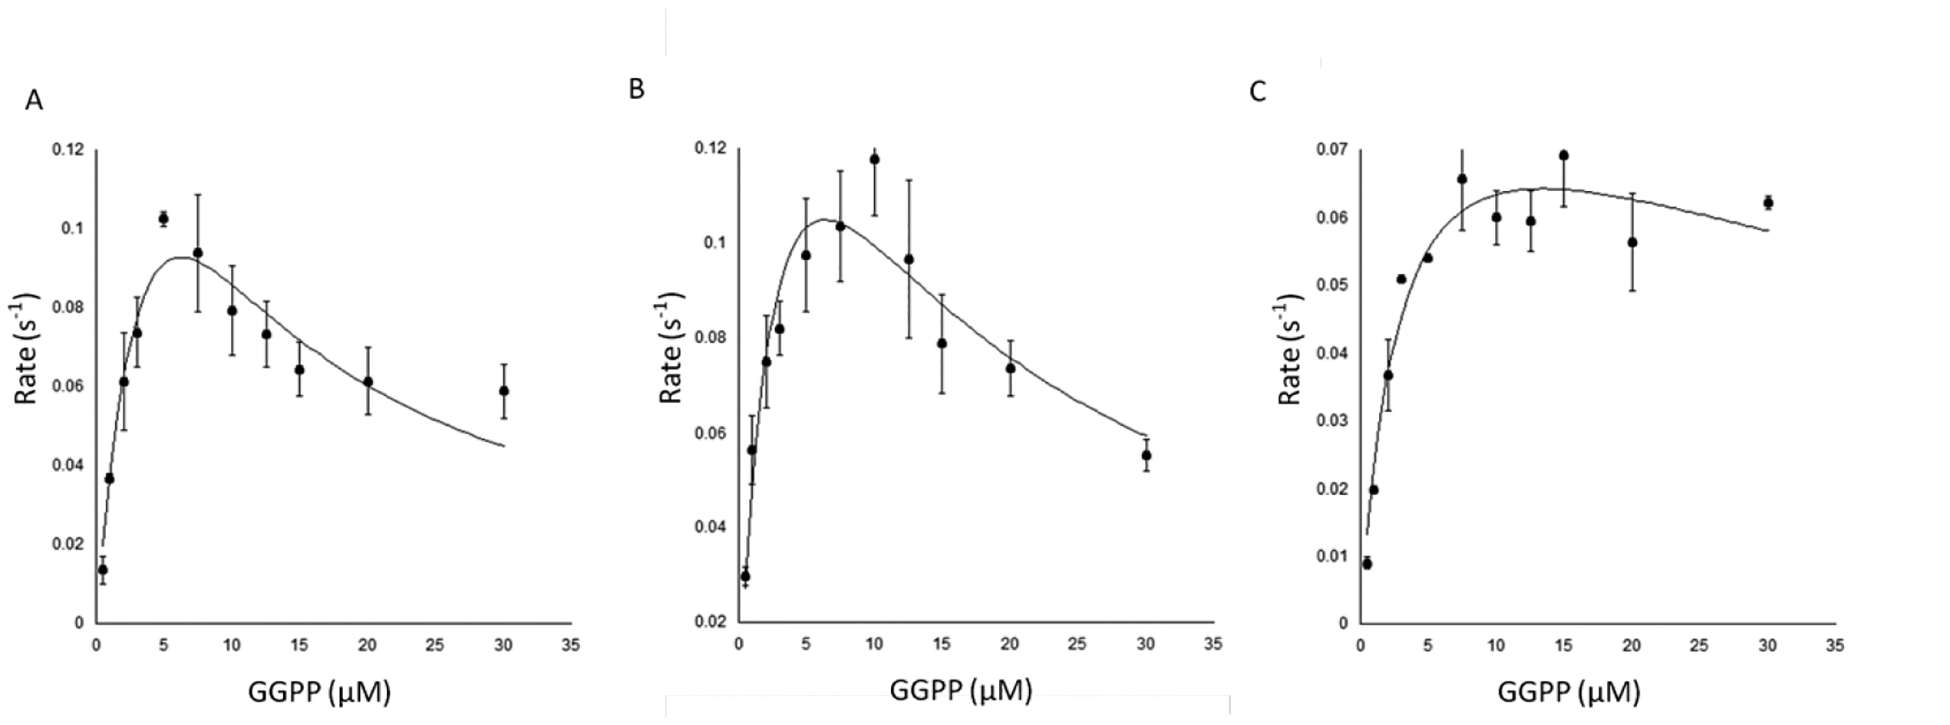
Effect of DPC on kinetic assays with AtCPS. Plot of observed reaction rate with varying concentrations of GGPP in the presence of A) 0 B) 10 or C) 100 μM DPC. Average from three independent measurements, error bars represent standard deviation. Line depicts fit to the substrate inhibition formula as previously described20.
Extended Data Table E1.
Grain yield component of different lines following DPC treatment
| Line | Treatment | Grain number per ear | 100 grain weight (g) | Yield per plant (g) | |||
|---|---|---|---|---|---|---|---|
| WT | CK | 130 | b | 25.57 | a | 33.31 | b |
| DPC | 131 | b | 25.34 | a | 33.10 | b | |
| 443 | CK | 117 | b | 23.08 | b | 27.12 | c |
| DPC | 120 | b | 23.66 | ab | 28.60 | c | |
| 589 | CK | 170 | a | 22.15 | b | 37.63 | a |
| DPC | 172 | a | 22.11 | b | 37.57 | a | |
Values are the means (n=7). Different letters in the same column indicate significant differences between the lines and/or treatments (P < 0.05; using two-sided Fisher’s LSD).
Supplementary Material
Acknowledgements
This work was supported by grants from the National Natural Science Foundation of China (Grant No. 31930079 to Z.L.), and NIH (GM076324 to R.J.P.), as well as a fellowship from The International Postdoctoral Exchange Fellowship Program (20170057 to J.Z.). The CRISPR/Cas9 vector was obtained from the Maize Functional Genomic Project of China Agriculture University. We thank Fangjun Li for providing GhCPS, Prof. Zhizhong Gong for providing the pSuper1300 vector, Prof. Yan Guo for providing the method for use of CRISPR/Cas9 in maize, and Zhanying Zhang for providing the method for subcellular localization in tobacco leaf.
Footnotes
Competing financial interests
The authors declare a financial interest as Z.L. has filed a patent related to the results reported here.
Additional Information
Supplementary Figures are available in the online version of the paper.
REFERENCES
- 1.Daviere JM & Achard P Development 140, 1147–51 (2013). [DOI] [PubMed] [Google Scholar]
- 2.Rademacher W Annu Rev Plant Physiol Plant Mol Biol 51, 501–531 (2000). [DOI] [PubMed] [Google Scholar]
- 3.Hedden P & Thomas SG Biochem J 444, 11–25 (2012). [DOI] [PubMed] [Google Scholar]
- 4.Nelson D & Werck-Reichhart D Plant J 66, 194–211 (2011). [DOI] [PubMed] [Google Scholar]
- 5.Kawai Y, Ono E & Mizutani M Plant J 78, 328–43 (2014). [DOI] [PubMed] [Google Scholar]
- 6.Zi J, Mafu S & Peters RJ Annu. Rev. Plant Biol 65, 259–286 (2014). [DOI] [PMC free article] [PubMed] [Google Scholar]
- 7.Gao Y, Honzatko RB & Peters RJ Nat. Prod. Rep 29, 1153–75 (2012). [DOI] [PMC free article] [PubMed] [Google Scholar]
- 8.Shechter I & West CA J. Biol. Chem 244, 3200–3209 (1969). [PubMed] [Google Scholar]
- 9.Peters RJ Nat. Prod. Rep 27, 1521–1530 (2010). [DOI] [PMC free article] [PubMed] [Google Scholar]
- 10.Schmelz EA et al. Plant J 79, 659–678 (2014). [DOI] [PubMed] [Google Scholar]
- 11.Rademacher W in The Gibberellins, Vol. 49 (ed. Hedden P) 359–404 (2016). [Google Scholar]
- 12.Wang L et al. Cotton Science 26, 189–196 (2014). [Google Scholar]
- 13.Bensen RJ et al. Plant Cell 7, 75–84 (1995). [DOI] [PMC free article] [PubMed] [Google Scholar]
- 14.Koornneef K, van Eden J, Hangart CJ & de Jongh AMM Genet. Res. Camb 41, 57–68 (1983). [Google Scholar]
- 15.Harris LJ et al. Plant Mol. Biol 59, 881–894 (2005). [DOI] [PubMed] [Google Scholar]
- 16.Murphy KM, Ma LT, Ding Y, Schmelz EA & Zerbe P Front Plant Sci 9, 1542 (2018). [DOI] [PMC free article] [PubMed] [Google Scholar]
- 17.Vaughan MM et al. Plant Cell Environ (2015). [Google Scholar]
- 18.Cyr A, Wilderman PR, Determan M & Peters RJ J. Am. Chem. Soc 129, 6684–6685 (2007). [DOI] [PMC free article] [PubMed] [Google Scholar]
- 19.Sun T-P & Kamiya Y Plant Cell 6, 1509–1518 (1994). [DOI] [PMC free article] [PubMed] [Google Scholar]
- 20.Prisic S & Peters RJ Plant Physiol 144, 445–454 (2007). [DOI] [PMC free article] [PubMed] [Google Scholar]
- 21.Hua DP et al. Plant Cell, 24, 2546–2561 (2012). [DOI] [PMC free article] [PubMed] [Google Scholar]
- 22.Clough SJ, & Bent AF Plant J 16, 735–743 (1998). [DOI] [PubMed] [Google Scholar]
- 23.Zhang ZY et al. Nat. Commun 8, 14788 (2017). [DOI] [PMC free article] [PubMed] [Google Scholar]
- 24.Zhang J et al. J. Exp. Bot 67, 1339–1355 (2016). [DOI] [PMC free article] [PubMed] [Google Scholar]
- 25.Zhang M et al. New Phytol 217, 1161–1176 (2018). [DOI] [PubMed] [Google Scholar]
- 26.Xing HL et al. BMC Plant Biol 14, 327 (2014). [DOI] [PMC free article] [PubMed] [Google Scholar]
- 27.Wang X et al. Nature 534, 575–578 (2016). [DOI] [PubMed] [Google Scholar]
- 28.Morrone D et al. Appl. Microbiol. Biotechnol 85, 1893–1906 (2010). [DOI] [PMC free article] [PubMed] [Google Scholar]
- 29.Potter K et al. Angew Chem Int Ed Engl. 53, 7198–7202 (2014). [DOI] [PMC free article] [PubMed] [Google Scholar]
Associated Data
This section collects any data citations, data availability statements, or supplementary materials included in this article.


