

Abstract
Purpose
To evaluate the performance of chest CT regarding the initial presentation of patients suspected of having coronavirus disease 2019 (COVID-19).
Materials and Methods
Data from 103 patients who were under investigation for COVID-19 based on inclusion criteria according to the World Health Organization Interim Guidance were retrospectively collected from January 21, 2020, to February 14, 2020. All patients underwent chest CT scanning and reverse-transcription polymerase chain reaction (RT-PCR) testing for COVID-19 at hospital presentation. The sensitivity, specificity, positive predictive value (PPV), and negative predictive value (NPV) (with 95% confidence intervals) were calculated to evaluate the performance of CT. Subgroup analyses were also performed based on the geographical distribution of these cases in the province of Henan, China.
Results
There were 88/103 (85%) patients with COVID-19 confirmed by RT-PCR testing. The overall sensitivity, specificity, PPV, and NPV were 93% (85%, 97%), 53% (27%, 77%), 92% (83%, 96%), and 42% (18%, 70%), respectively. Similar results were shown in both geographic regions. The respective sensitivity, specificity, PPV, and NPV for chest CT in the districts of Xinyang and Zhumadian (n = 56) were 92% (80%, 97%), 63% (26%, 90%), 93% (81%, 98%), and 56% (23%, 85%), while these indicators in the district of Anyang (n = 47) were 95% (81%, 99%), 43% (12%, 80%), 90% (76%, 97%), and 60% (17%–93%). There were no significant differences in the prevalence of positive examinations in the two geographic subgroups for CT (P = .423) or RT-PCR (P = .931).
Conclusion
Although initial chest CT obtained at hospital presentation showed high sensitivity in patients under investigation for COVID-19 in the two geographic regions in Henan Province, the NPV was only modest, suggesting a low value of CT as a screening tool.
© RSNA, 2020
Summary
In patients suspected of having coronavirus disease 2019, the initial chest CT showed high sensitivity but low specificity.
Key Points
■ The sensitivity, specificity, positive predictive value, and negative predictive value (with 95% confidence intervals) were 93% (85%, 97%), 53% (27%, 77%), 92% (83%, 96%), 42% (18%, 70%), respectively. Similar results were shown in both geographic regions studied.
■ There were no significant differences in the distribution of positive rates of tests in the two geographic regions between CT (P = .423) and reverse-transcription polymerase chain reaction testing (P = .931).
Introduction
In December 2019, a major outbreak of viral pneumonia caused by a new coronavirus started in Wuhan, China (1–3). The disease caused by this novel virus has been named coronavirus disease 2019 (COVID-19) by the World Health Organization (4). The disease has spread widely throughout China, followed by other countries worldwide, and it is now considered a pandemic (5–9). As the disease spread in the communities has increased, many of the infected persons may not have an obvious history of exposure (10). The rapid rate of spread confirms the highly infectious nature of the novel coronavirus, which is transmitted from person to person by means of droplets, direct contact, and inhaled air (11).
Given that early detection and isolation of COVID-19 cases could potentially decrease the spread rate, initial efforts focused on the use of chest CT at the forefront of diagnosis, in addition to reverse-transcription polymerase chain reaction (RT-PCR) testing (12). Most common CT features of COVID-19 include multilobar ground-glass opacities with or without consolidation in the periphery of the lungs (13–16). Although early studies evaluating the clinical performance of chest CT obtained at initial presentation in the city of Wuhan, China showed high sensitivity (17), it is still questionable if chest CT should have any role in routine screening for COVID-19 in patients with suspected infection. Therefore, the purpose of the present study was to evaluate the performance of chest CT in patients under investigation for COVID-19 from two centers in the province of Henan, China, which is located near the center of this pandemic.
Materials and Methods
Patients and Data Collection
This analysis was retrospective and approved by the relevant institutional review boards. The need for written patient consent was waived. The authors reviewed the medical records from 103 patients who were considered under investigation for COVID-19 between January 21, 2020, and February 14, 2020, from two areas in Henan Province, China. The inclusion criteria of patients under investigation are summarized in Table 1 (4). The following exclusion criteria were applied: (a) a person with a history of fever for more than 14 days but without symptoms and signs for acute respiratory infection or exposure history within 14 days; (b) a person with history of acute respiratory infection for more than 14 days but without exposure history; (c) a person with history of acute respiratory infection within 14 days but without exposure history, laboratory test results, or other examination findings providing sufficient evidence to exclude COVID-19 (eg, other respiratory viruses, including influenza A [H1N1, H3N2, H7N9], influenza B, respiratory syncytial virus, parainfluenza, adenovirus, severe acute respiratory syndrome coronavirus, and Middle East respiratory syndrome). All patients under investigation were kept in the hospital for at least 2 weeks. RT-PCR tests performed on throat-swab, sputum, or alveolar lavage fluid specimens in all patients were used as the standard of reference in this study. RT-PCR testing was performed within 3 days after initial chest CT scanning. For those who showed initially negative RT-PCR results, repeat tests were done at intervals of 1–3 days. Up to four RT-PCR tests were performed in each patient.
Table 1:
SARI Suspicious for COVID-19: World Health Organization, January 2020

These patients were also divided into two subgroups based on the geographical distribution. Subgroup 1 included 56 residents from the Xinyang and Zhumadian districts (population estimated at 11.6 million inhabitants), which are located in the southernmost area of Henan Province, adjacent to the city of Wuhan. Subgroup 2 included 47 residents from Anyang district (population estimated at 5.2 million inhabitants), which is located in the northernmost area of Henan Province, relatively distant from Wuhan.
CT Scanning and Image Analysis
Chest CT was performed in all patients at initial clinical presentation by using multislice CT systems (Philips Brilliance 16-detector CT and Philips Brilliance 128-detector iCT; Philips, Best, Netherlands; GE Lightspeed 16-detector CT; GE Healthcare, Waukesha, Wis), without intravenous contrast material, using standard clinical protocols. Parameters used included a peak x-ray tube voltage of 120 kV, automatic tube current modulation (145–300 mAs), and a slice thickness of 2–3 mm without an interslice gap. Studies were obtained in the supine position during inspiratory pause (except in one elderly patient who was unable to hold his breath). The images were reviewed by three radiologists with 8–15 years of experience in chest CT imaging, who were blinded to the laboratorial status (including the RT-PCR testing) of the patients, using a clinical picture archiving and communication system workstation. All diverging interpretations were resolved by discussion until a consensus was reached.
All CT images were assessed according to previous reports of radiologic findings in COVID-19 (13–16), using the Fleischner Society lexicon as a reference (18). The distribution of the lung opacities was defined as peripheral if the involvement was limited to the outer one-third of the lungs, and it was defined as central if the involvement was limited to the inner two-thirds of the lungs. Lymphadenopathy was defined as the presence of hilar or mediastinal lymph nodes ≥ 10 mm in the short-axis dimension.
Statistical Analysis
The sensitivity, specificity, positive predictive value (PPV), and negative predictive value (NPV) for diagnosing COVID-19 are reported with 95% confidence intervals, using RT-PCR findings as the reference. The continuous demographic features and CT radiation dose were described as the mean (standard deviation). Pearson χ2 analysis was used to test differences in CT performance and RT-PCR positivity prevalence between geographic regions. Statistical analysis was performed using SPSS 26.0 software (IBM, Armonk, NY). The statistical significance level was set to .05.
Results
A total of 103 patients underwent chest CT and RT-PCR testing, including 48 males and 55 females, with a mean age of 46 (15) years, ranging from 12 to 98 years. The mean CT dose index and dose-length product were 9.34 (4.13) mGy and 314.03 (152.86) mGy·cm, respectively. A total of 88/103 (85%) patients had confirmation of COVID-19, and the number of patients diagnosed on the first, second, third, or fourth RT-PCR test were 37 (42%), 29 (33%), 14 (16%), and eight (9%), respectively.
A total of 82/88 (93%) COVID-19 cases had abnormalities on CT (Table 2), while 6/88 patients had a normal CT. In 23/82 (28%) patients, CT images showed pure ground-glass opacities (Fig 1), and in 58/82 (71%) patients, CT images showed ground-glass opacities mixed with consolidation (Fig 2). Only one (1/82) patient showed pure consolidation in the right lower lobe. In terms of distribution of the pulmonary opacities, in 63/82 (77%) patients, the distribution of the lung opacities was peripheral; in 3/82 (4%) patients, the distribution was central; and in 16/82 (20%) patients, the distribution was both central and peripheral (Fig 3). Of 82 patients, 25 (31%) patients had unilateral opacities, and 57 patients (70%) had bilateral opacities. In addition, opacities tended to involve multiple lobes (81%): in 14 of 82 (17%) patients, the right upper lobe was affected; in 37 patients (45%), the right middle lobe was affected; in 58 patients (71%), the right lower lobe was affected; in 17 patients (21%), the left upper lobe was affected; in 41 patients (50%), the lingula was affected; and in 63 patients (77%), the left lower lobe was affected. Meanwhile, lymphadenopathy and pleural effusion were less common. Only one patient had a unilateral pleural effusion, which was accompanied by low serum protein level, elevated serum creatinine level, and a history of chronic pyelonephritis, suggesting renal etiology. None of those patients in this cohort showed lymphadenopathy.
Table 2:
Chest CT Findings
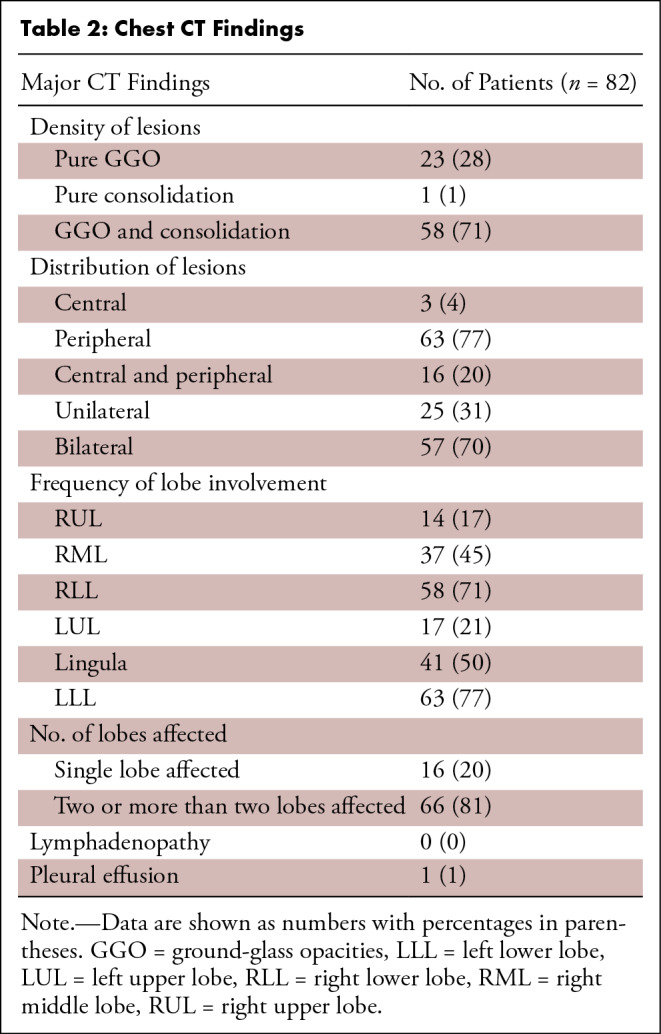
Figure 1:
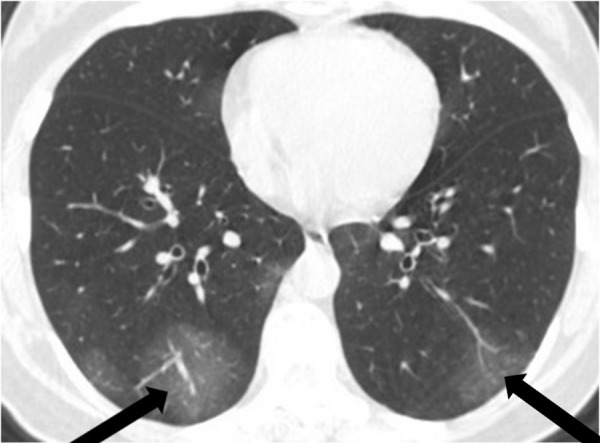
A 44-year-old woman with fever for 3 days, lymphocytopenia, and a traveling history to Wuhan in January 2020. Axial chest CT image shows bilateral peripheral multifocal ground-glass opacities (arrows).
Figure 2:
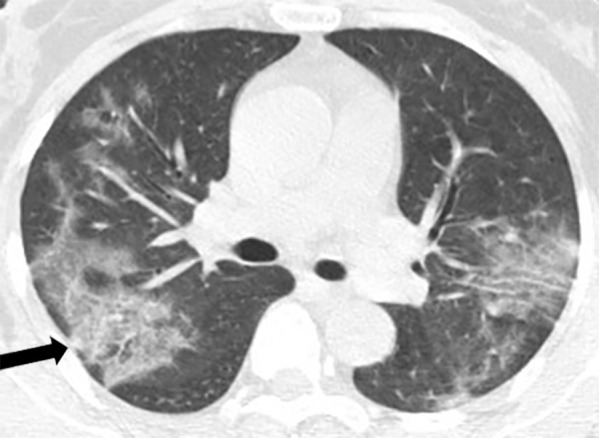
A 57-year-old man, a lifelong inhabitant of Wuhan, China, with a fever for 4 days, shivers, and a dry cough. Axial chest CT image shows peripheral and central multifocal ground-glass opacities with small foci consolidation (arrow).
Figure 3a:
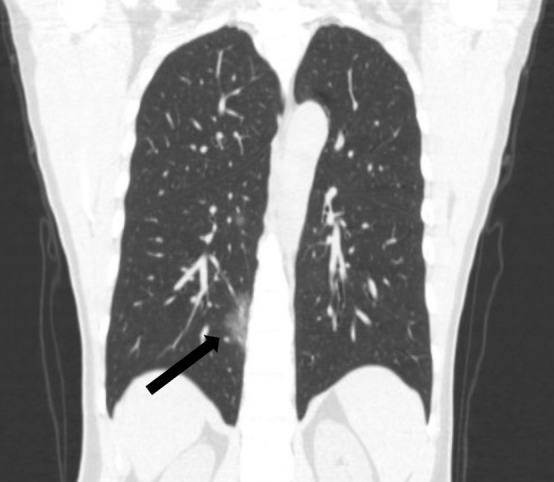
A 45-year-old man, with an exposure history of working in Wuhan, presenting with a fever for 2 days, a cough, and a sore throat. (a) Coronal and (b) sagittal chest CT images show a focus of ground glass in the peripheral right lower lobe (black arrow) and a smaller focus of ground glass in the central right lower lobe (white arrow).
Figure 3b:
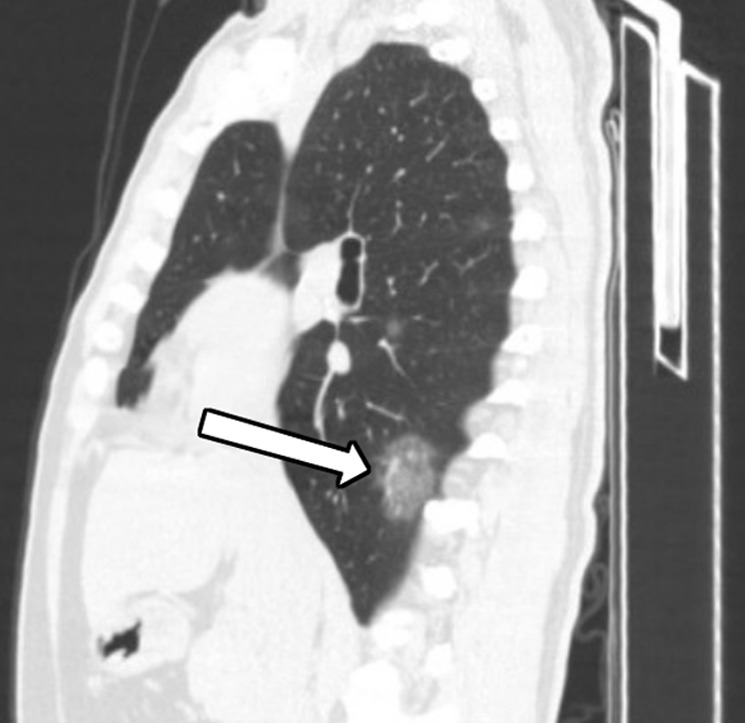
A 45-year-old man, with an exposure history of working in Wuhan, presenting with a fever for 2 days, a cough, and a sore throat. (a) Coronal and (b) sagittal chest CT images show a focus of ground glass in the peripheral right lower lobe (black arrow) and a smaller focus of ground glass in the central right lower lobe (white arrow).
The sensitivity, specificity, PPV, and NPV (with 95% confidence intervals) were 93% (85%, 97%), 53% (27%, 77%), 92% (83%, 96%), and 42% (18%, 70%) in the entire cohort, respectively (Table 3). Similar results were seen in both geographic subgroups. The sensitivity, specificity, PPV, and NPV in subgroup 1 were 92% (80%, 97%), 63% (26%, 90%), 93% (81%, 98%), and 56% (23%, 85%), while in subgroup 2, they were 95% (81%, 99%), 43% (12%, 80%), 90% (76%, 97%), and 60% (17%, 93%), respectively. In addition, there were no significant differences in the distribution of normal and abnormal CT or RT-PCR positivity in the two geographic subgroups (respectively, P = .423 and P = .931) (Table 4 and Table 5, respectively).
Table 3:
Diagnostic Performance of CT for Detecting COVID-19

Table 4:
Comparison of CT Scanning between Two Subgroups

Table 5:
Comparison of RT-PCR between Two Subgroups

Discussion
In the present study, the sensitivity and specificity of chest CT in patients under investigation for COVID-19 were 93% and 53%, respectively, using the results of RT-PCR as the standard of reference, with no significant differences between two distinct regions in the Chinese province of Henan, one of which is geographically closer to the center of the disease outbreak in Wuhan. The sensitivity in this study is similar to that of a previous study (97%) reported by Ai et al, who focused on the subjects in Wuhan (17).
Noticeably, the sensitivity of the first RT-PCR testing was only about 42% in our study, increasing to 75% on the second round of testing. In fact, this observation has been also seen in reports from other medical centers (19,20). As a result, many experts in China had proposed CT as a screening tool for COVID-19. Although CT was initially included in the diagnostic criteria for COVID-19 in Hubei province in the fifth edition of the Pneumonia Diagnosis and Treatment Plan for New Coronavirus Infection issued by the National Health Commission of China, it was later removed in the sixth edition (21). Our results suggest that chest CT may have a limited screening role for patients under investigation, as the NPV for COVID-19 was only modest in both geographic regions (ie, 56%–60%). Currently, the definite diagnosis of COVID-19 still relies on RT-PCR testing or fast genetic sequencing.
The specificity of CT findings for COVID-19 in our study was relatively low, even in patients specifically under investigation for the disease. In fact, ground-glass opacities, consolidation, interlobular/intralobular septal thickening, a crazy paving pattern, or other features on CT have been reported in several other noninfectious and infectious processes, such as severe acute respiratory syndrome, common viral pneumonias, and other interstitial lung diseases (22). In our study, 15 patients under investigation for COVID-19, who showed findings on CT consistent with the disease, were found to have other diagnoses. Our observation is aligned with those of other reports. For instance, Ai et al estimated a sensitivity of 28% for the initial CT in a large single-center study in the city of Wuhan with 1014 patients (17). Slight differences in specificity between the two studies could have occurred due to the diverse demographic profile, inclusion criteria, or diagnostic criteria.
Remarkably, 6/88 RT-PCR–positive patients had a normal CT. Follow-up CT obtained 2–3 days after the initial scan in these patients (not systematically studied here) became positive in one of six patients, while the other five patients remained negative during their hospitalization. These five patients presented with a normal lymphocyte count and only minor symptoms.
In this study, we also noted that none of the patients had mediastinal or hilar lymphadenopathy. Those CT findings are aligned with the report by Chung et al (14). These special CT features accompanied with the decreased number of peripheral blood lymphocytes may contribute to disclose the pathogenesis of COVID-19 infection. Huang et al reported that the virus of COVID-19 can consume lymphocytes, which may also be an important substrate for the rapid proliferation of the virus in early stages of the disease (3). We contemplate that this cytopathic effect on lymphocytes could be one of the causes for the lack of lymphadenopathy.
This study is not without limitations. First, CT readers were aware of the high suspicion level for COVID-19 in the population cohorts, which could have led to observer bias. Nevertheless, they were still blinded to the RT-PCR status of the patients. Second, the PPV and NPV could be affected by local prevalence of COVID-19 in our sample of patients under investigation. To balance the magnitude of such effects, we included patients from distinct geographic regions from our province, one closer to and another distant from the center of the outbreak. Last, we used RT-PCR in different specimens as the standard of reference in our study. Although the sensitivity of RT-PCR has been reported to vary significantly, such effects could have been balanced in our study by obtaining multiple sequential tests during hospital admission.
We conclude that (a) although initial chest CT showed a high sensitivity for detecting COVID-19, the NPVs observed in both geographic regions (56% and 60%) were too low for proposing this examination as a screening tool in patients under investigation and that (b) the specificity of CT findings was also relatively low, reinforcing the need to consider all of the clinical information, exposure history, and alternative diagnoses.
Z.W. and Y.C. contributed equally to this work.
Disclosures of Conflicts of Interest: Z.W. disclosed no relevant relationships. Y.C. disclosed no relevant relationships. L.Z. disclosed no relevant relationships. H.L. disclosed no relevant relationships. K.D. disclosed no relevant relationships. Z.L. disclosed no relevant relationships. J.C. disclosed no relevant relationships. L.C. disclosed no relevant relationships. D.W. disclosed no relevant relationships.
Abbreviations:
- COVID-19
- coronavirus disease 2019
- NPV
- negative predictive value
- PPV
- positive predictive value
- RT-PCR
- reverse-transcription polymerase chain reaction
References
- 1.Lu H, Stratton CW, Tang YW. Outbreak of pneumonia of unknown etiology in Wuhan, China: the mystery and the miracle. J Med Virol 2020;92(4):401–402. [DOI] [PMC free article] [PubMed] [Google Scholar]
- 2.Hui DSI, I Azhar E, Madani TA, et al. The continuing 2019-nCoV epidemic threat of novel coronaviruses to global health – the latest 2019 novel coronavirus outbreak in Wuhan, China. Int J Infect Dis 2020;91:264–266. [DOI] [PMC free article] [PubMed] [Google Scholar]
- 3.Huang C, Wang Y, Li X, et al. Clinical features of patients infected with 2019 novel coronavirus in Wuhan, China. Lancet 2020;395(10223):497–506 [Published correction appears in Lancet 2020;395(10223):496.]. [DOI] [PMC free article] [PubMed] [Google Scholar]
- 4.World Health Organization . Clinical management of severe acute respiratory infection when novel coronavirus (nCoV) infection is suspected: interim guidance. World Health Organization Web site. https://apps.who.int/iris/handle/10665/331446. Published January 12, 2020.
- 5.World Health Organization . Novel coronavirus: Thailand (ex-China). World Health Organization Web site. https://www.who.int/thailand/emergencies/novel-coronavirus-2019. Published January 14, 2020. Accessed January 19, 2020.
- 6.World Health Organization . Novel coronavirus: Japan (ex-China). World Health Organization Web site. https://www.who.int/csr/don/16-january-2020-novel-coronavirus-japan-ex-china/en/. Published January 16, 2020.
- 7.World Health Organization . Novel coronavirus: Republic of Korea (ex-China). World Health Organization Web site. https://www.who.int/csr/don/21-january-2020-novel-coronavirus-republic-of-korea-ex-china/en/. Published January 21, 2020.
- 8.Centers for Disease Control and Prevention . First travel-related case of 2019 novel coronavirus detected in United States. Centers for Disease Control and Prevention Web site. https://www.cdc.gov/media/releases/2020/p0121-novel-coronavirus-travel-case.html. Published January 21, 2020.
- 9.Yang W, Cao Q, Qin L, et al. Clinical characteristics and imaging manifestations of the 2019 novel coronavirus disease (COVID-19): a multi-center study in Wenzhou city, Zhejiang, China. J Infect 2020;80(4):388–393. [DOI] [PMC free article] [PubMed] [Google Scholar]
- 10.She J, Jiang J, Ye L, Hu L, Bai C, Song Y. 2019 novel coronavirus of pneumonia in Wuhan, China: emerging attack and management strategies. Clin Transl Med 2020;9(1):19. [DOI] [PMC free article] [PubMed] [Google Scholar]
- 11.Xu X, Chen P, Wang J, et al. Evolution of the novel coronavirus from the ongoing Wuhan outbreak and modeling of its spike protein for risk of human transmission. Sci China Life Sci 2020;63(3):457–460. [DOI] [PMC free article] [PubMed] [Google Scholar]
- 12.General Office of National Health Committee, Office of State Administration of Traditional Chinese Medicine . Notice on issuing the Pneumonia Diagnosis and Treatment Plan for Novel Coronavirus Infection (trial version 5) The State Council of the People’s Republic of China Web site. http://www.gov.cn/zhengce/zhengceku/2020-02/05/content_5474791.htm. Published February 4, 2020.
- 13.Lin X, Gong Z, Xiao Z, Xiong J, Fan B, Liu J. Novel coronavirus pneumonia outbreak in 2019: computed tomographic findings in two cases. Korean J Radiol 2020;21(3):365–368. [DOI] [PMC free article] [PubMed] [Google Scholar]
- 14.Chung M, Bernheim A, Mei X, et al. CT imaging features of 2019 novel coronavirus (2019-nCoV). Radiology 2020;295(1):202–207. [DOI] [PMC free article] [PubMed] [Google Scholar]
- 15.Lei J, Li J, Li X, Qi X. CT Imaging of the 2019 novel coronavirus (2019-nCoV) pneumonia. Radiology 2020;295(1):18. [DOI] [PMC free article] [PubMed] [Google Scholar]
- 16.Lee KS. Pneumonia associated with 2019 novel coronavirus: can computed tomographic findings help predict the prognosis of the disease? Korean J Radiol 2020;21(3):257–258. [DOI] [PMC free article] [PubMed] [Google Scholar]
- 17.Ai T, Yang Z, Hou H, et al. Correlation of chest CT and RT-PCR testing in coronavirus disease 2019 (COVID-19) in China: a report of 1014 cases. Radiology 2020;296(2):E32–E40. [DOI] [PMC free article] [PubMed] [Google Scholar]
- 18.Hansell DM, Bankier AA, MacMahon H, McLoud TC, Müller NL, Remy J. Fleischner Society: glossary of terms for thoracic imaging. Radiology 2008;246(3):697–722. [DOI] [PubMed] [Google Scholar]
- 19.Fang Y, Zhang H, Xie J, et al. Sensitivity of chest CT for COVID-19: comparison to RT-PCR. Radiology 2020;296(2):E115–E117. [DOI] [PMC free article] [PubMed] [Google Scholar]
- 20.Xie X, Zhong Z, Zhao W, Zheng C, Wang F, Liu J. Chest CT for typical 2019-nCoV pneumonia: relationship to negative RT-PCR testing. Radiology 2020;296(2):E41–E45. [DOI] [PMC free article] [PubMed] [Google Scholar]
- 21.Yang W, Yan F. Patients with RT-PCR–confirmed COVID-19 and normal chest CT. Radiology 2020;295(2):E3. [DOI] [PMC free article] [PubMed] [Google Scholar]
- 22.Wong KT, Antonio GE, Hui DS, et al. Thin-section CT of severe acute respiratory syndrome: evaluation of 73 patients exposed to or with the disease. Radiology 2003;228(2):395–400. [DOI] [PubMed] [Google Scholar]